
Lara’s Weekly: Elliott Wave and Technical Analysis of S&P500 and Gold and US Oil | Charts – April 10, 2020

S&P 500
Price continues to move higher towards the target, which is currently the same for both the main and alternate Elliott wave counts.
Summary: The bounce may end about 2,934 next week. If this target is wrong, it may not be high enough; the first major bounce within a new bear market does tend to be fairly deep. A normal range would be from 3,069 to 3,261.
Thereafter, the downwards trend may resume with strength.
The biggest picture, Grand Super Cycle analysis, is here.
Last monthly charts are here. Video is here. Members are encouraged to view all three monthly charts. The third is much more bearish than this main wave count and remains a valid possibility.
ELLIOTT WAVE COUNTS
WEEKLY CHART
Click chart to enlarge.
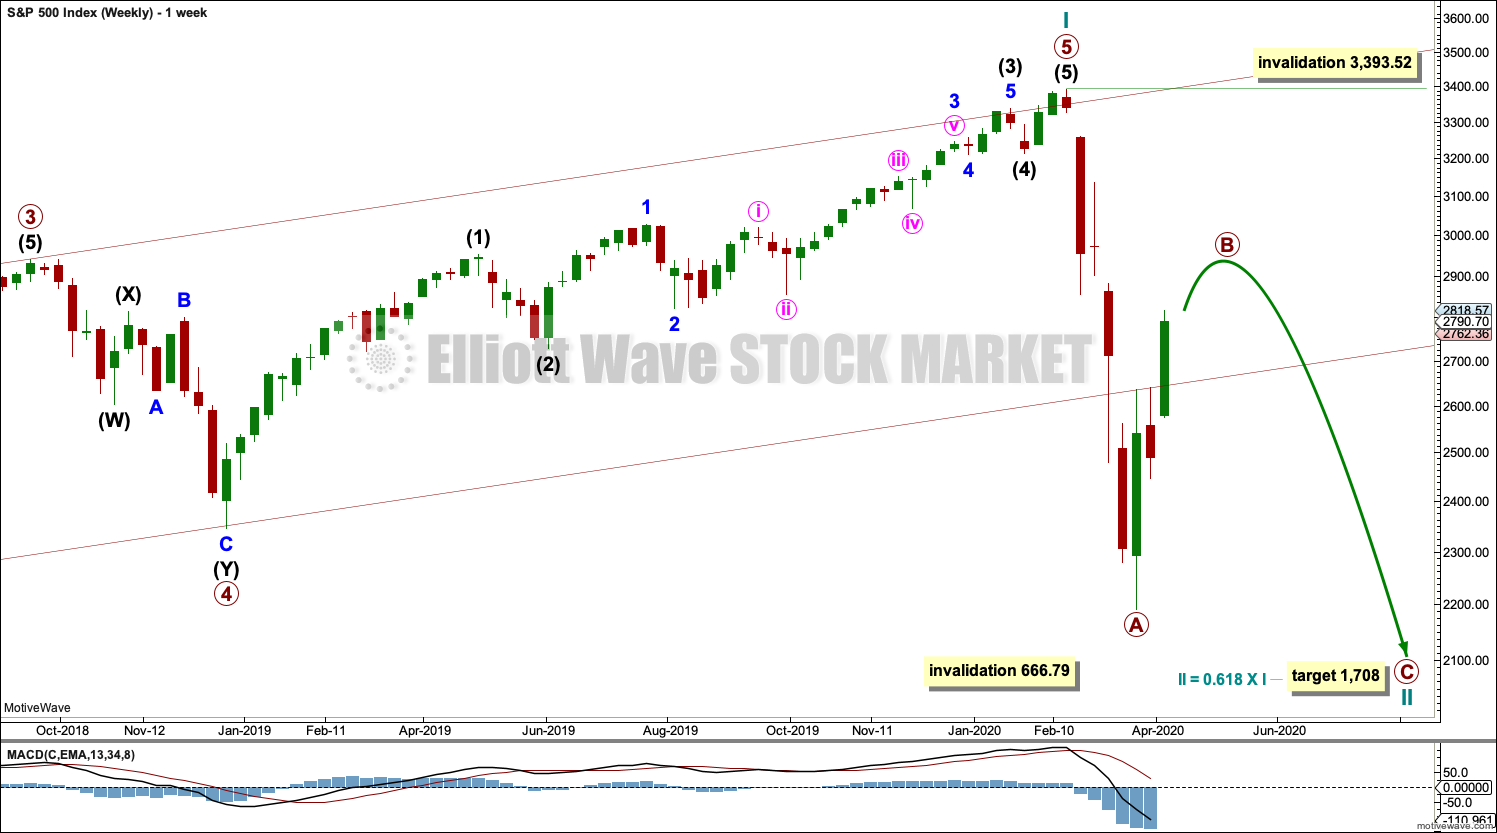
The channel is now breached by a full weekly candlestick below and not touching the lower edge. Further confidence in this wave count may be had. Price has closed above the lower edge of this channel.
Price has reached below the 0.382 Fibonacci ratio of cycle wave I at 2,352 on the last downwards movement. The structure of cycle wave II may need further to go to complete. The next Fibonacci ratio at 0.618 is now a preferred target for cycle wave II to end.
Cycle wave II would most likely subdivide as a zigzag; thus far that looks like what is unfolding. When primary waves A and B may both be complete, then the target may be calculated using a Fibonacci ratio between primary waves A and C. At that stage, the final target may change or widen to a zone.
Cycle wave II may not move beyond the start of cycle wave I below 666.79.
DAILY CHART
Click chart to enlarge.
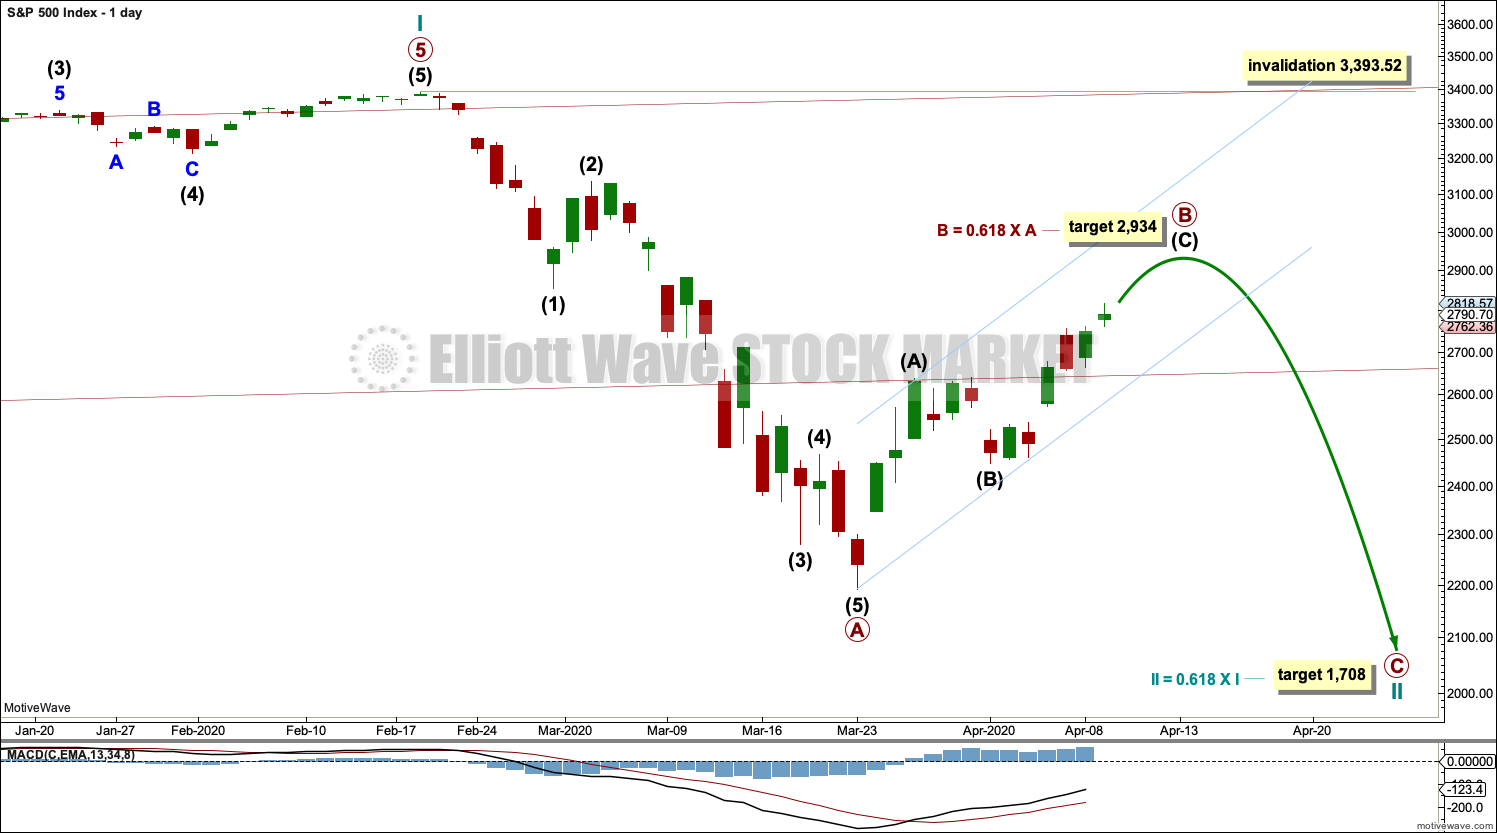
Draw the wide maroon trend channel carefully: draw the first trend line from the end of primary wave 1 at 2,093.55 (December 26, 2014), to the end of primary wave 3 at 2,940.91 (September 21, 2018), then place a parallel copy on the end of primary wave 2 at 1,810.10 (February 11, 2016). The channel is fully breached indicating a trend change from the multi-year bull trend to a new bear trend. Resistance at the lower edge has been overcome; price has closed above this trend line. Primary wave B may now end closer to the 0.618 Fibonacci ratio of primary wave A at 2,924.
Cycle wave II may subdivide as any Elliott wave corrective structure except a triangle. It would most likely be a zigzag. Primary wave A may be a complete five wave impulse. Primary wave B may not move beyond the start of primary wave A above 3,393.52.
ALTERNATE DAILY CHART
Click chart to enlarge.
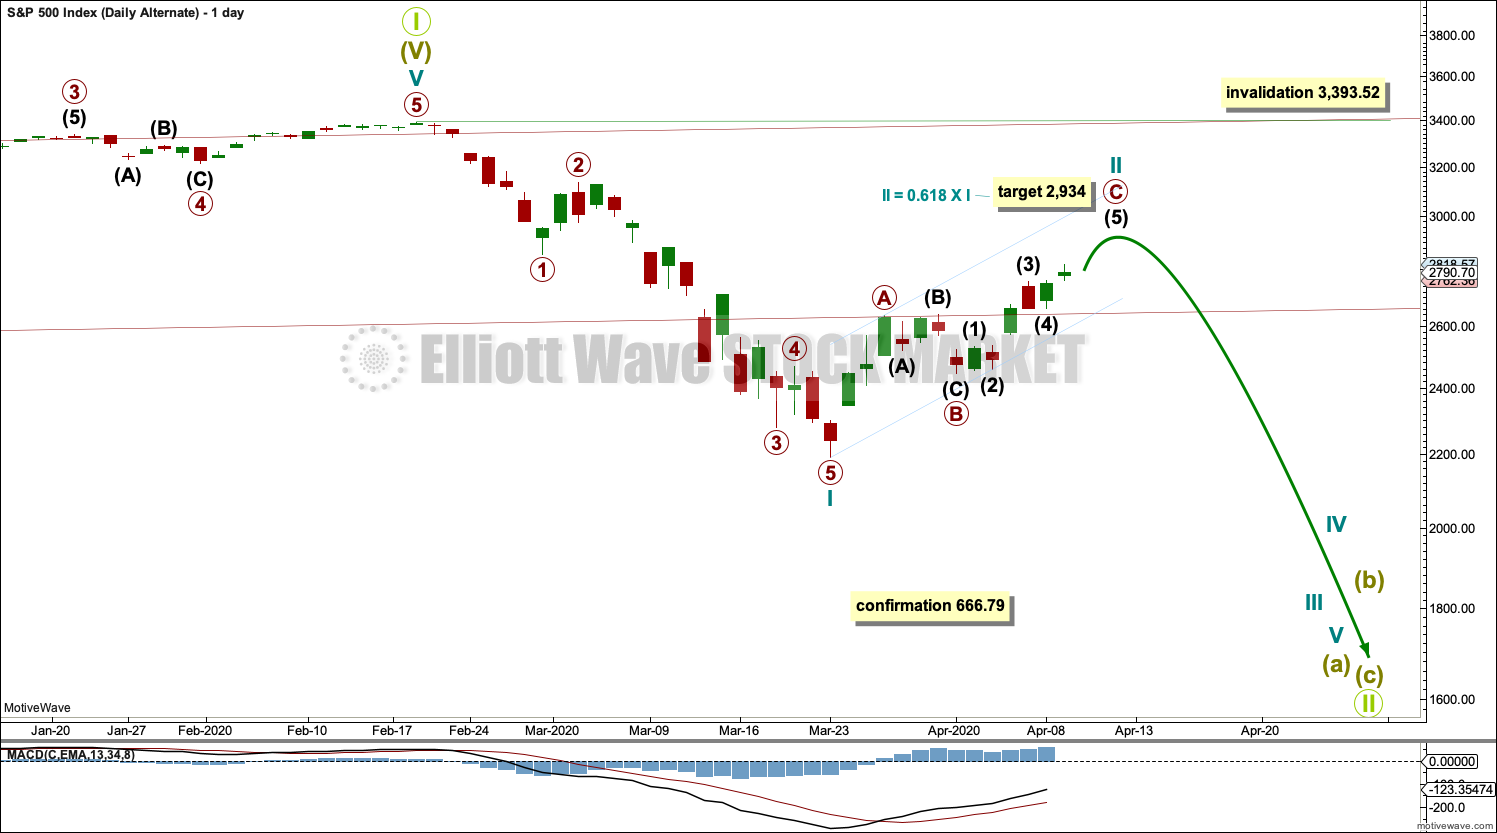
This alternate daily chart follows the Second Alternate Monthly chart published here. Video is here.
By simply moving the degree of labelling in the bull market beginning March 2009 up one degree, it is possible that a Grand Super Cycle trend change occurred on February 19, 2020.
A correction at Grand Super Cycle degree may be expected to last at least a decade, possibly longer. Corrections for this market tend to be much quicker than bullish moves, and so a fair amount of flexibility is required in expectations for duration of the different degrees.
Grand Super Cycle II would most likely subdivide as a zigzag, although it may be any corrective structure except a triangle. It should begin with a five down at the weekly chart time frame, which would be incomplete.
The first wave down on the daily chart is labelled cycle wave I. If this degree of labelling is wrong, it may be too high; it may need to be moved down one degree.
Following cycle wave I, cycle wave II may be continuing higher as a zigzag. Cycle wave II may not move beyond the start of cycle wave I above 3,393.52.
When cycle wave II may again be complete, then a target for cycle wave III may be calculated.
TECHNICAL ANALYSIS
WEEKLY CHART
Click chart to enlarge. Chart courtesy of StockCharts.com.
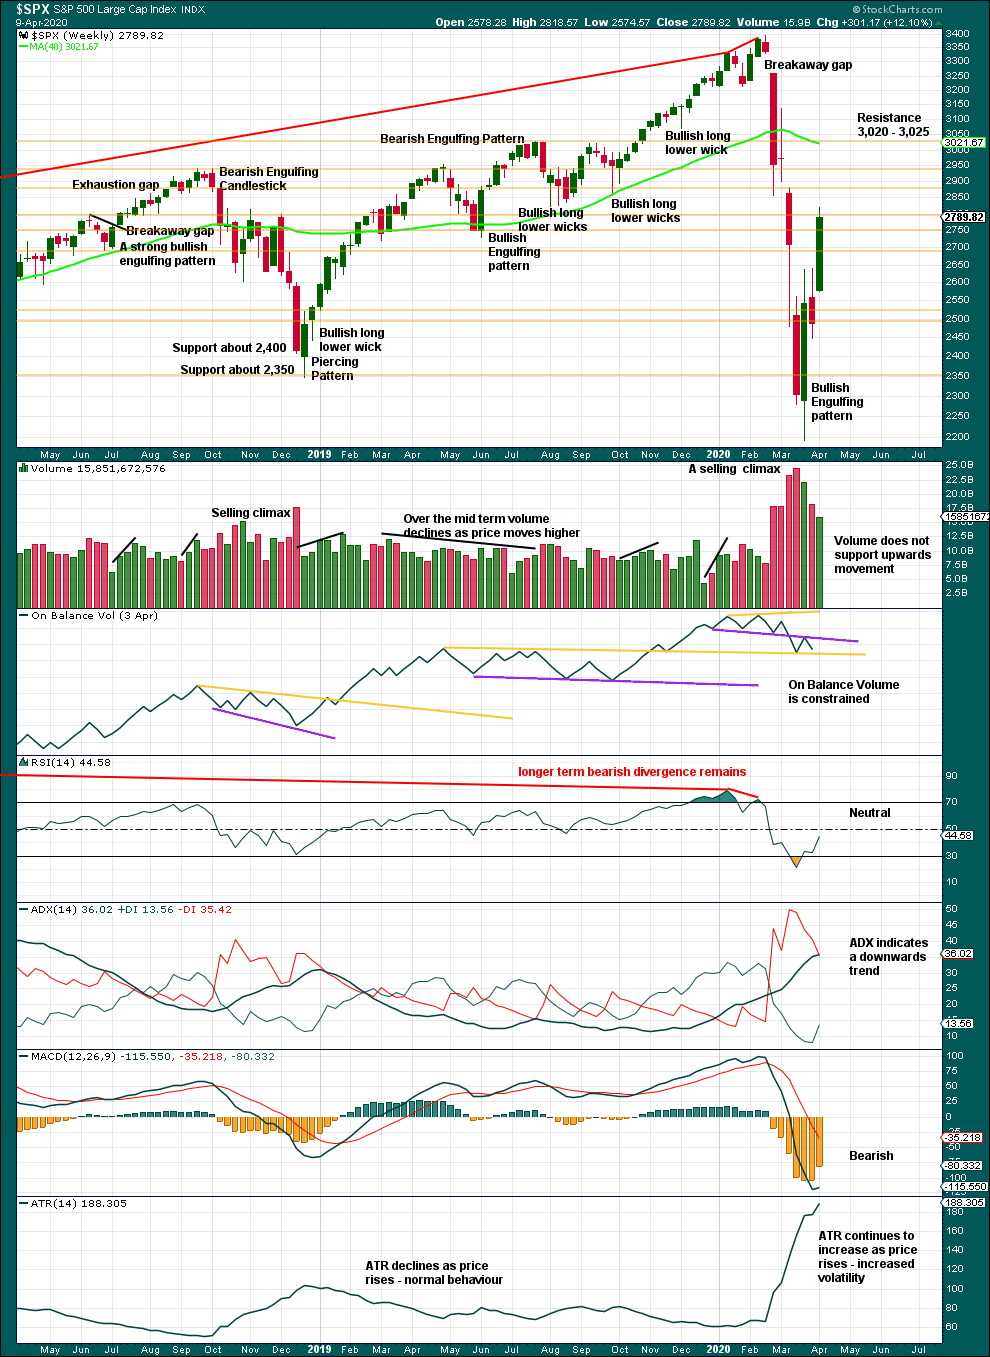
The bounce has further relieved RSI. ADX is still not extreme; there is room for this trend to continue. Watch On Balance Volume carefully for a breakout, which may now happen next week.
DAILY CHART
Click chart to enlarge. Chart courtesy of StockCharts.com.
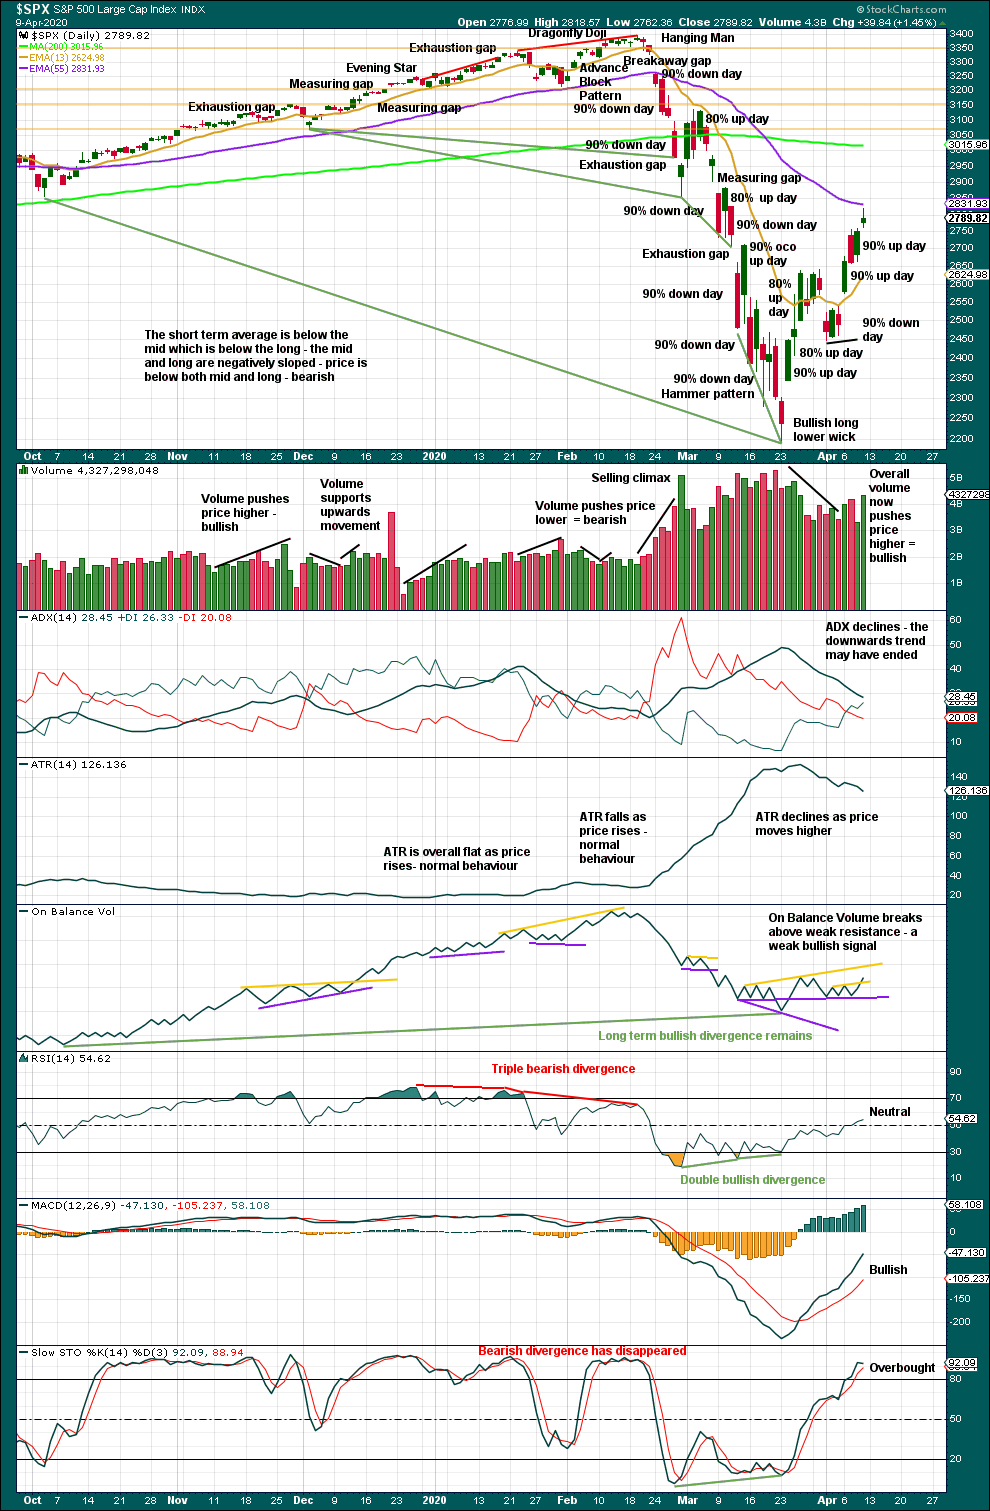
Price has closed above a small consolidation. A target calculated from the width of the consolidation is at 2,839. A gap today gives a new target calculation at 2,948.
Stochastics is now overbought; this bounce may end soon.
In the bear market from October 2000 to March 2009, the first multi-day bounce retraced 0.73 of the first wave down. In the bear market from March 2000 to October 2002, the first multi-day bounce retraced 0.89 of the first wave down. So far this current bounce has retraced 0.52 of the first wave down, so it seems reasonable that it could continue higher.
To see what signals may be looked for to identify a high, the two previous large bear markets were analysed in end of week analysis. The DotCom crash was analysed here with video here. The Global Financial Crisis was also analysed here with video here.
With another 90% up day this week, there is now a great amount of strength off the low of 23rd of March. There are now three 90% up days and two back to back 80% up days. It looks technically possible that the 23rd of March may be a sustainable low and that price could be moving up to new all time highs in a sustainable bull market.
However, as compelling as that technical picture looks at this time, it would mean that the US stock market would be bullish while a pandemic unfolds in the country and the economy suffers greatly as a result. While this analysis is focussed on technical data, it would be rather obtuse to ignore the reality of a global pandemic that has shut borders and locked down economies world wide, and may still be in its early days.
If either price or the AD line make new all time highs, then a bull market would be seriously considered.
BREADTH – AD LINE
WEEKLY CHART
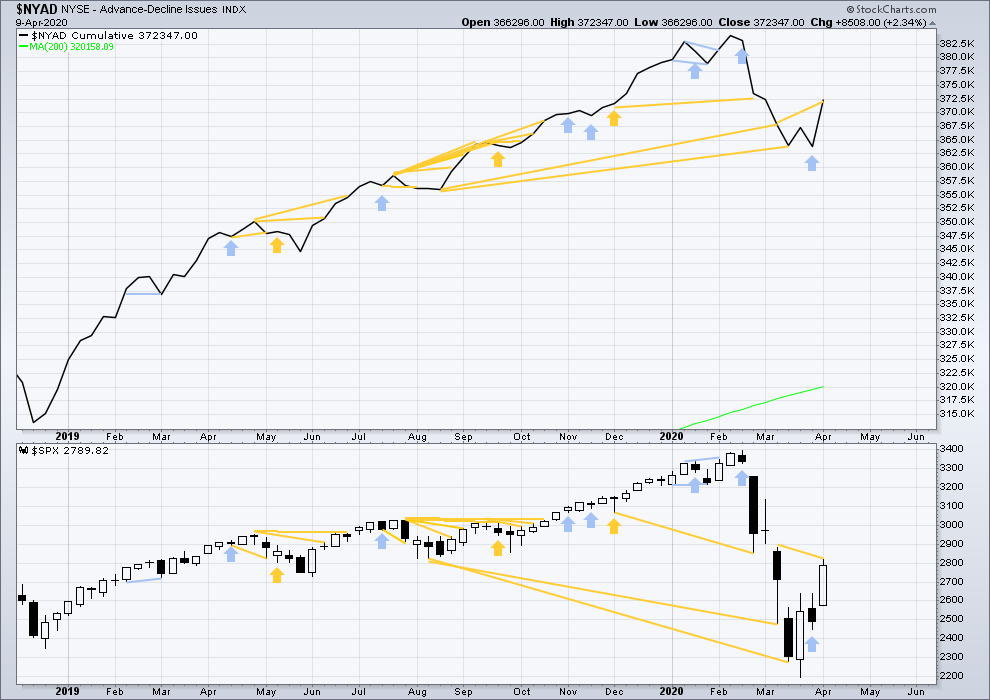
Click chart to enlarge. Chart courtesy of StockCharts.com. So that colour blind members are included, bearish signals will be noted with blue and bullish signals with yellow.
Bear markets from the Great Depression and onwards have been preceded by an average minimum of 4 months divergence between price and the AD line with only two exceptions in 1946 and 1976. With no divergence between the AD line and price at the last all time high, this current bear market now makes a third exception.
In all bear markets in the last 90 years there is some positive correlation (0.6022) between the length of bearish divergence and the depth of the following bear market. No to little divergence is correlated with more shallow bear markets. Longer divergence is correlated with deeper bear markets.
This bear market comes after no bearish divergence. It would more likely be shallow, but this is a statement of probability and not certainty. So far it is slightly more than the 0.382 Fibonacci ratio of the bull market it is correcting (beginning March 2009).
This week both price and the AD line have moved higher. The AD line has made a new high above the prior week beginning 9th of March, but price has not. Breadth is now rising faster than price. This divergence is bullish.
Large caps all time high: 3,393.52 on 19th February 2020.
Mid caps all time high: 2,109.43 on 20th February 2020.
Small caps all time high: 1,100.58 on 27th August 2018.
DAILY CHART
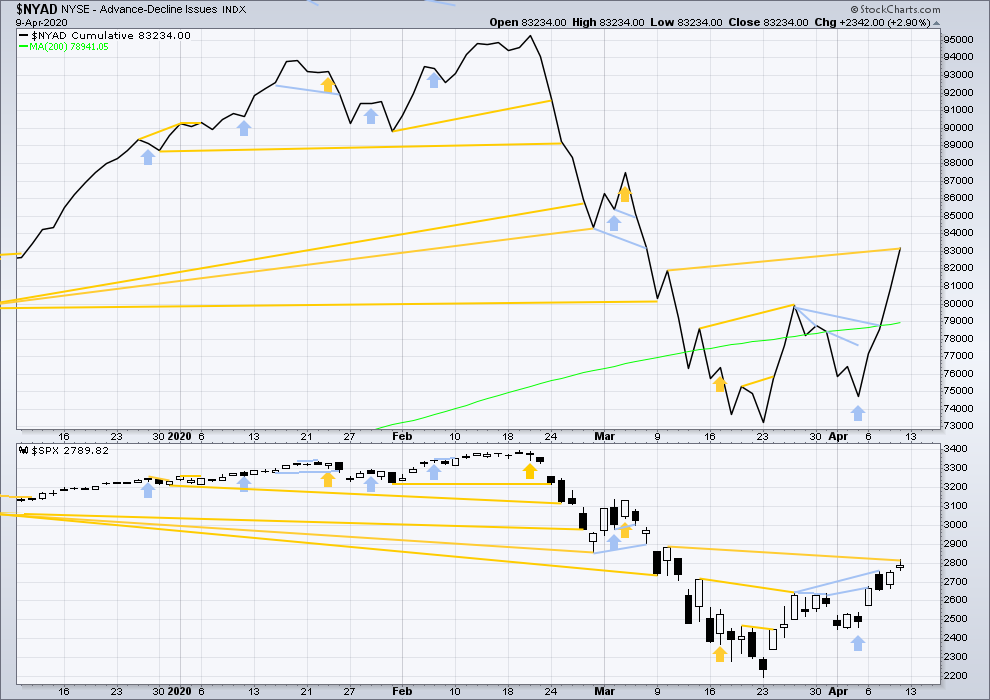
Click chart to enlarge. Chart courtesy of StockCharts.com. So that colour blind members are included, bearish signals will be noted with blue and bullish signals with yellow.
Breadth should be read as a leading indicator.
Today both price and the AD line have moved higher. The AD line has made a new high above the prior high of the 10th of March, but price has not by a small margin. This divergence is bullish for the short term.
VOLATILITY – INVERTED VIX CHART
WEEKLY CHART
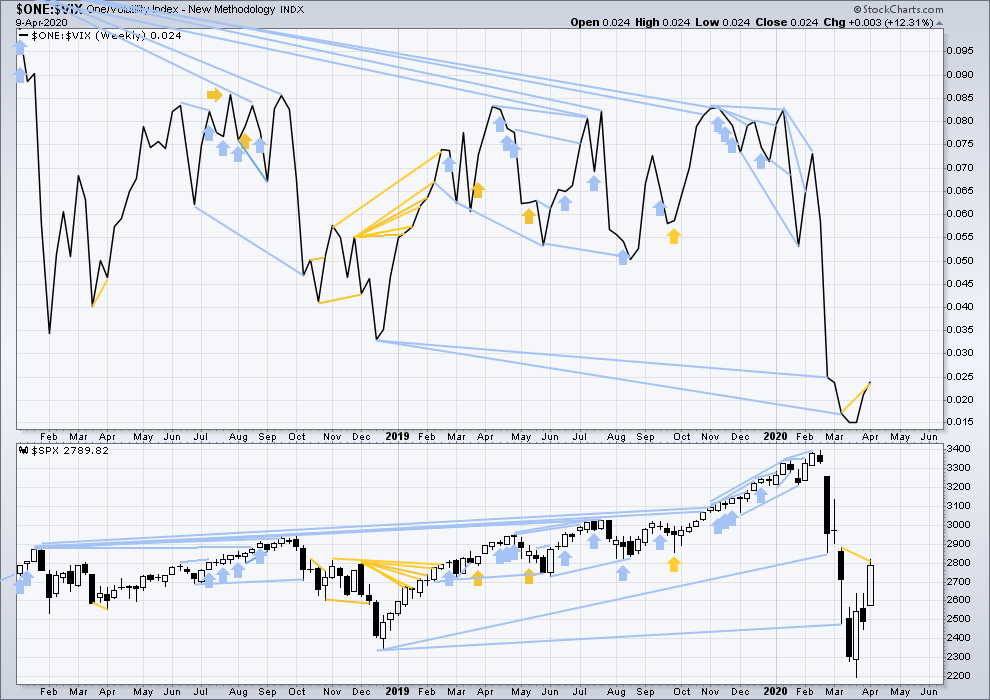
Click chart to enlarge. Chart courtesy of StockCharts.com. So that colour blind members are included, bearish signals will be noted with blue and bullish signals with yellow.
This week both price and inverted VIX have moved higher. Inverted VIX has made a new high above the prior high of the 9th of March, but price has not. This divergence is bullish.
DAILY CHART
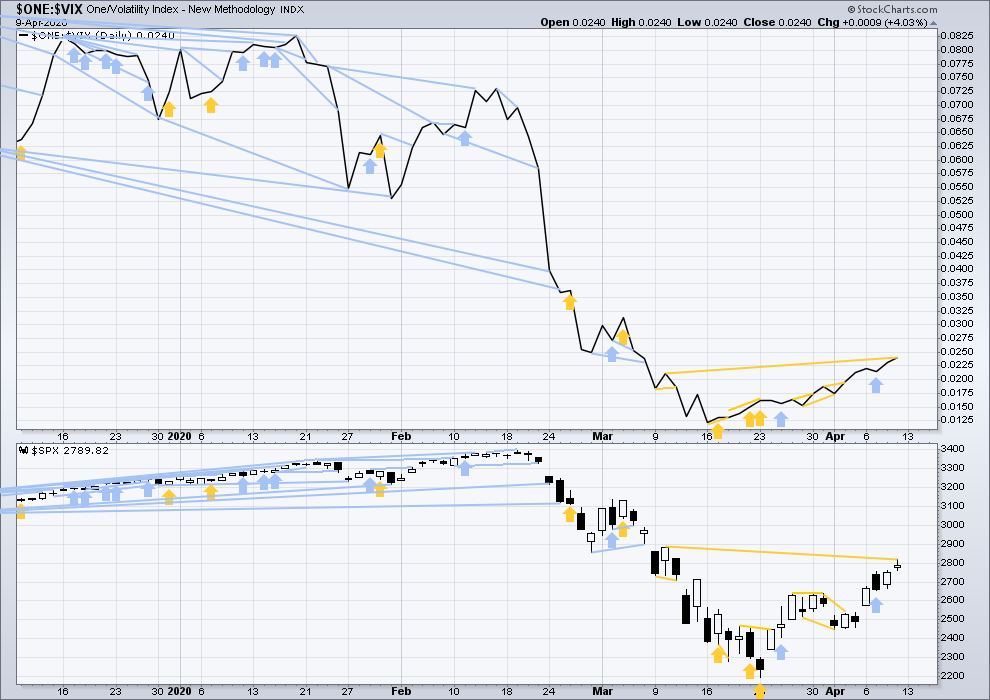
Click chart to enlarge. Chart courtesy of StockCharts.com. So that colour blind members are included, bearish signals will be noted with blue and bullish signals with yellow.
Today inverted VIX has made a new high slightly above the prior high of the 10th of March but price has not. This divergence is bullish for the short term.
DOW THEORY
Dow Theory has confirmed a bear market with the following lows made on a closing basis:
DJIA: 21,712.53 – a close below this point has been made on the March 12, 2020.
DJT: 8,636.79 – a close below this point has been made on March 9, 2020.
Adding in the S&P and Nasdaq for an extended Dow Theory, a bear market has now been confirmed:
S&P500: 2,346.58 – a close below this point has now been made on March 20, 2020.
Nasdaq: 7,292.22 – a close below this point was made on the March 12, 2020.
GOLD
With New York closed for Good Friday, the analysis is unchanged. End of week technical analysis is updated.
Summary: The bounce is expected to be over here or very soon.
If price makes a new high above 1,701.61, then a target for upwards movement to end would be at 1,780 or 1,795.
Grand SuperCycle analysis is here.
Monthly charts were last updated here.
MAIN BEARISH ELLIOTT WAVE COUNT
WEEKLY CHART
Click chart to enlarge.
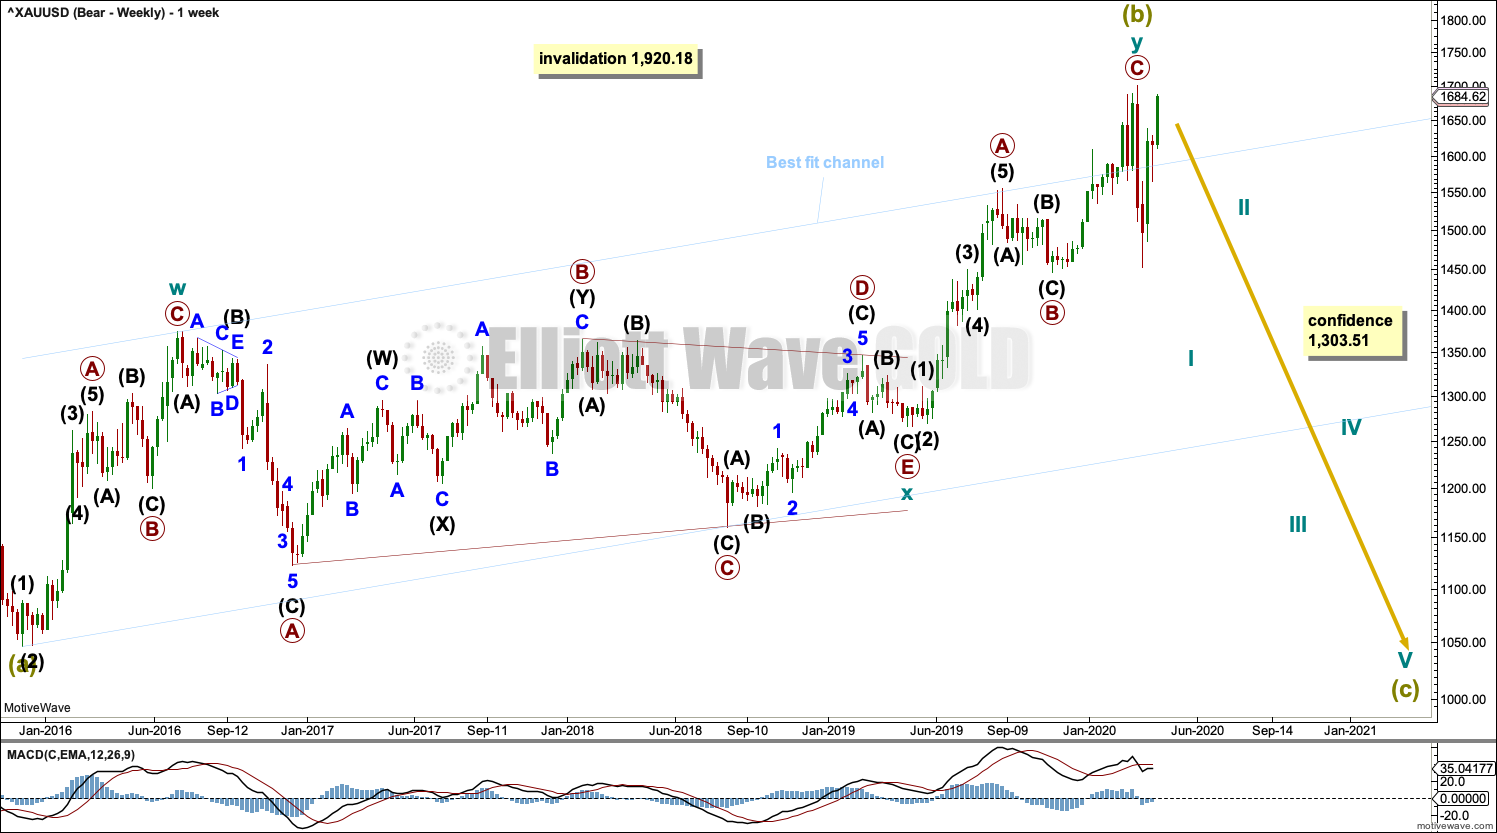
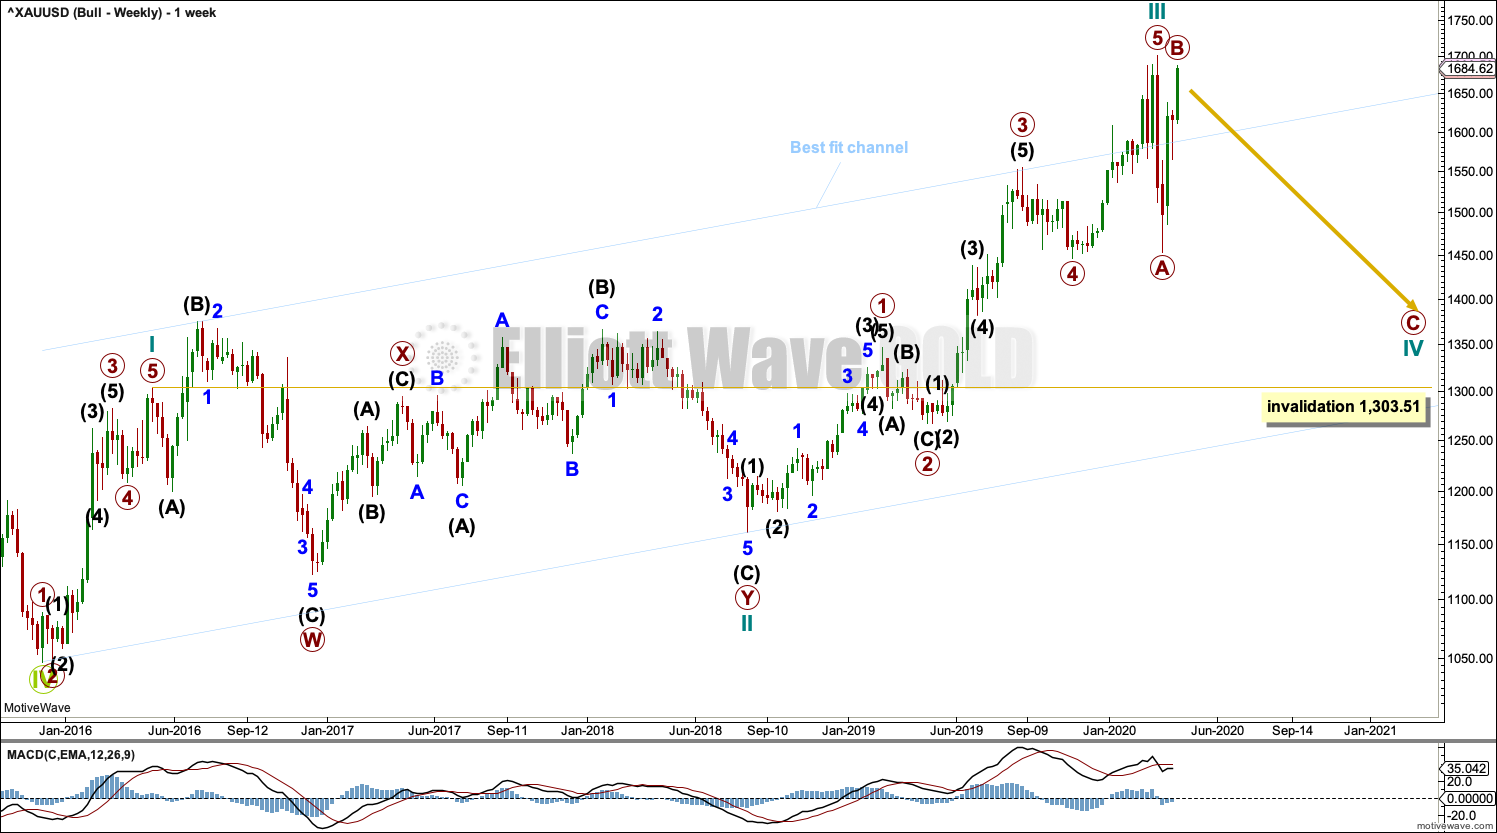
Super Cycle wave (b) may be a complete double zigzag.
The first zigzag in the double is labelled cycle wave w. The double is joined by a three in the opposite direction, a triangle labelled cycle wave x. The second zigzag in the double is labelled cycle wave y.
The purpose of the second zigzag in a double is to deepen the correction. Cycle wave y has achieved this purpose.
A wide best fit channel is added in light blue. Copy this channel over to daily charts.
DAILY CHART
Click chart to enlarge.
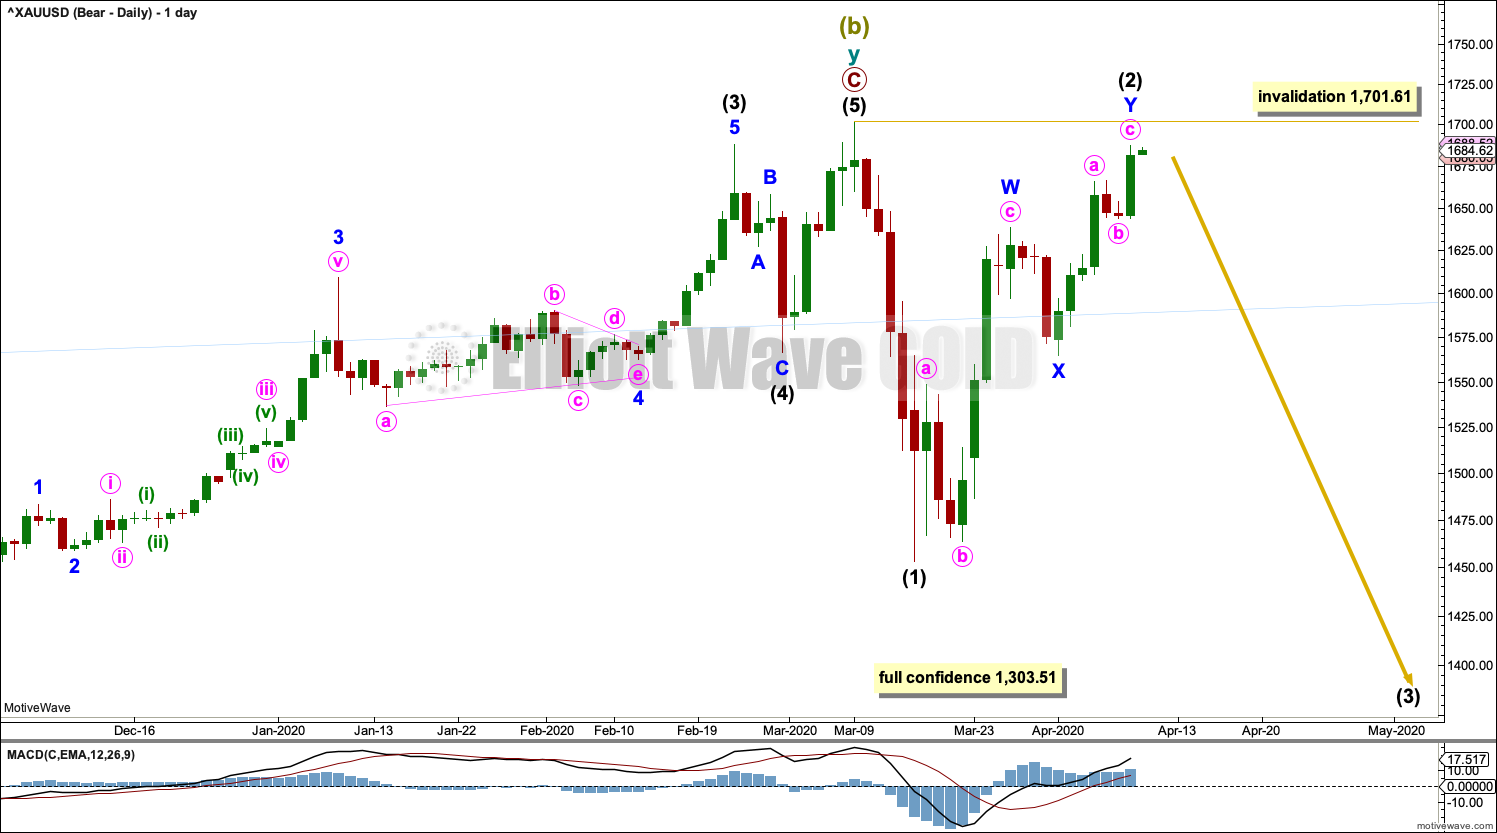
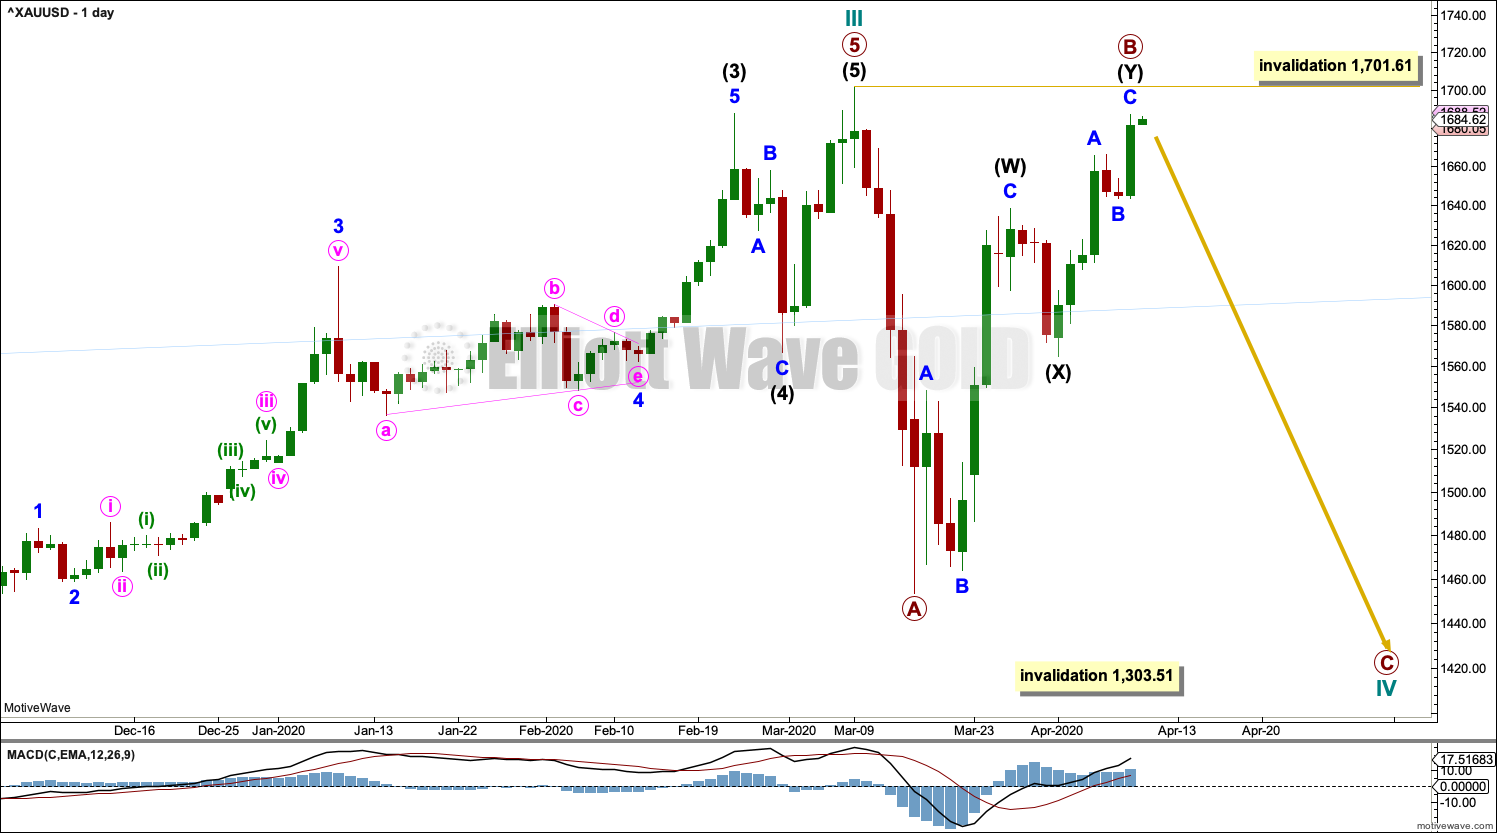
Super Cycle wave (b) may be complete.
The second zigzag in the double, labelled cycle wave y, may be complete. There is no Fibonacci ratio between primary waves A and C.
Within Super Cycle wave (c): intermediate waves (1) and now (2) may be complete. Intermediate wave (2) may have continued higher this week as a double zigzag. If intermediate wave (2) continues higher, then it may not move beyond the start of intermediate wave (1) above 1,701.61.
ALTERNATE DAILY CHART
Click chart to enlarge.
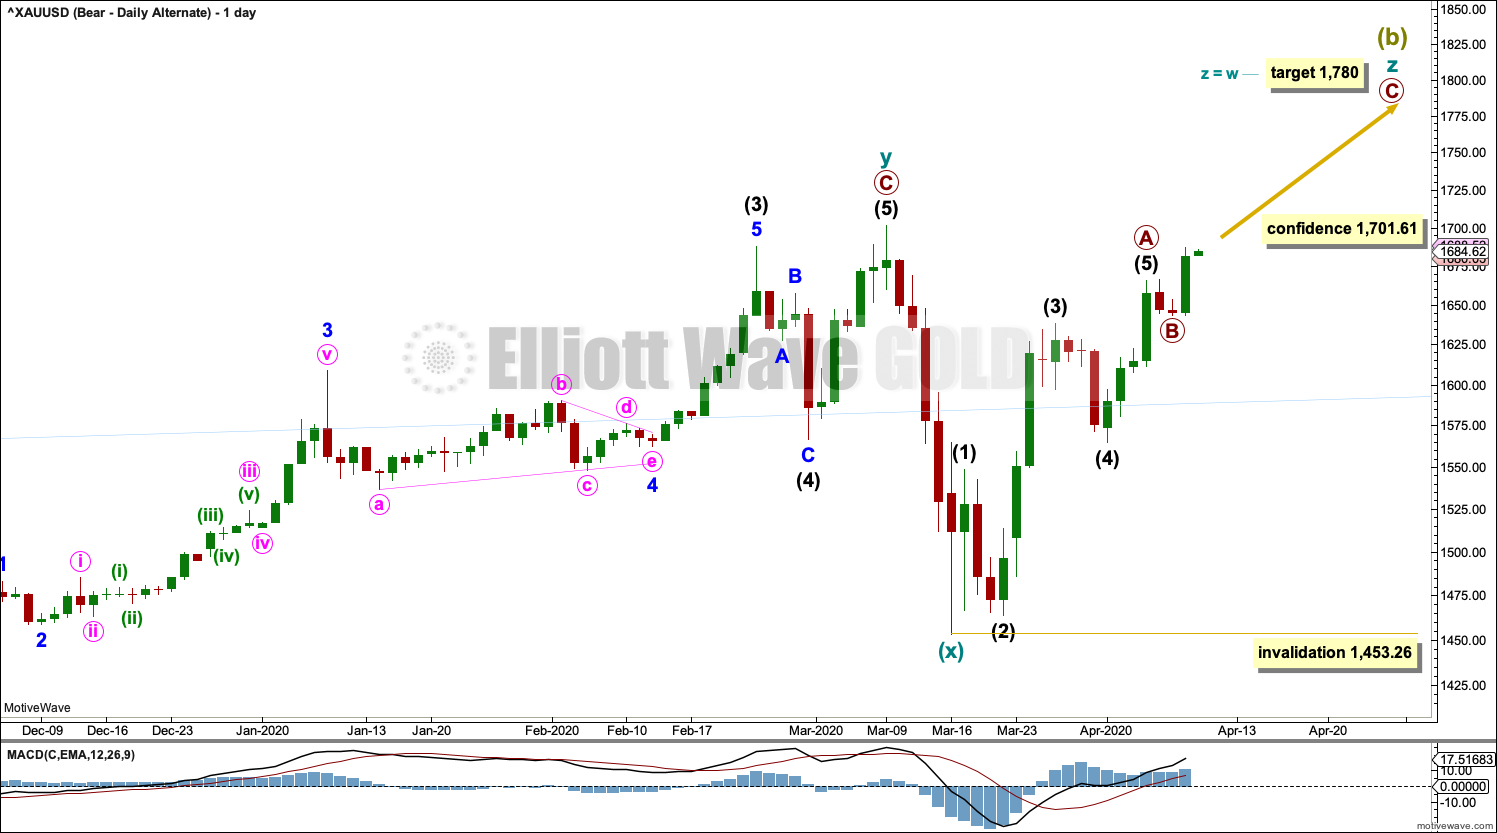
If the main wave count is invalidated by a new high above 1,701.61 on Barchart data, then this alternate may then be used.
It is possible that Super Cycle wave (b) may continue higher as a triple zigzag. However, triple zigzags are reasonably rare structures. The rarity of this structure means that this wave count has a low probability, but low probability does not mean no probability.
Cycle wave z for this wave count must subdivide as a zigzag. Within the zigzag: primary wave A may be a completed five wave impulse and primary wave B may not move beyond the start of primary wave A below 1,453.26.
ALTERNATE BULLISH ELLIOTT WAVE COUNT
WEEKLY CHART
Click chart to enlarge.
This wave count sees the the bear market complete at the last major low for Gold on 3 December 2015.
If Gold is in a new bull market, then it should begin with a five wave structure upwards on the weekly chart.
Cycle wave I fits as a five wave impulse with reasonably proportionate corrections for primary waves 2 and 4. This resolves a previous major problem with the bullish wave count.
Cycle wave II now fits as a double flat. However, a problem arises with the relabelling of this structure. Within the first flat correction labelled primary wave W, this wave count now needs to ignore what looks like an obvious triangle from July to September 2016 (this can be seen labelled as a triangle on the bear wave count above). This movement must now be labelled as a series of overlapping first and second waves.
Within the first flat correction labelled primary wave W of the double flat of cycle wave II, intermediate wave (B) is 1.69 the length of intermediate wave (A). This is longer than the common range of up to 1.38, but within an allowable guideline of up to 2. The length of intermediate wave (B) reduces the probability of this wave count.
Cycle wave III may be complete. Cycle wave IV may not move into cycle wave I price territory below 1,303.51.
DAILY CHART
Click chart to enlarge.
Cycle wave III may be complete. Cycle wave IV may not move into cycle wave I price territory below 1,303.51.
Cycle wave II was relatively deep at 0.55 of cycle wave I. If cycle wave IV exhibits alternation in depth, it may more likely be shallow; the first target at 0.382 of cycle wave III would be preferred.
Cycle wave II was a very long lasting double combination. It lasted 119 weeks. Cycle wave IV may most likely be a zigzag, which tend to be quicker structures, but it would still be expected to last several months.
Within the zigzag of cycle wave IV: primary wave B may not move beyond the start of primary wave A above 1,701.61. A new high above this point would indicate cycle wave IV may not be a zigzag; it may then be relabelled as a flat, combination or triangle.
ALTERNATE DAILY CHART
Click chart to enlarge.
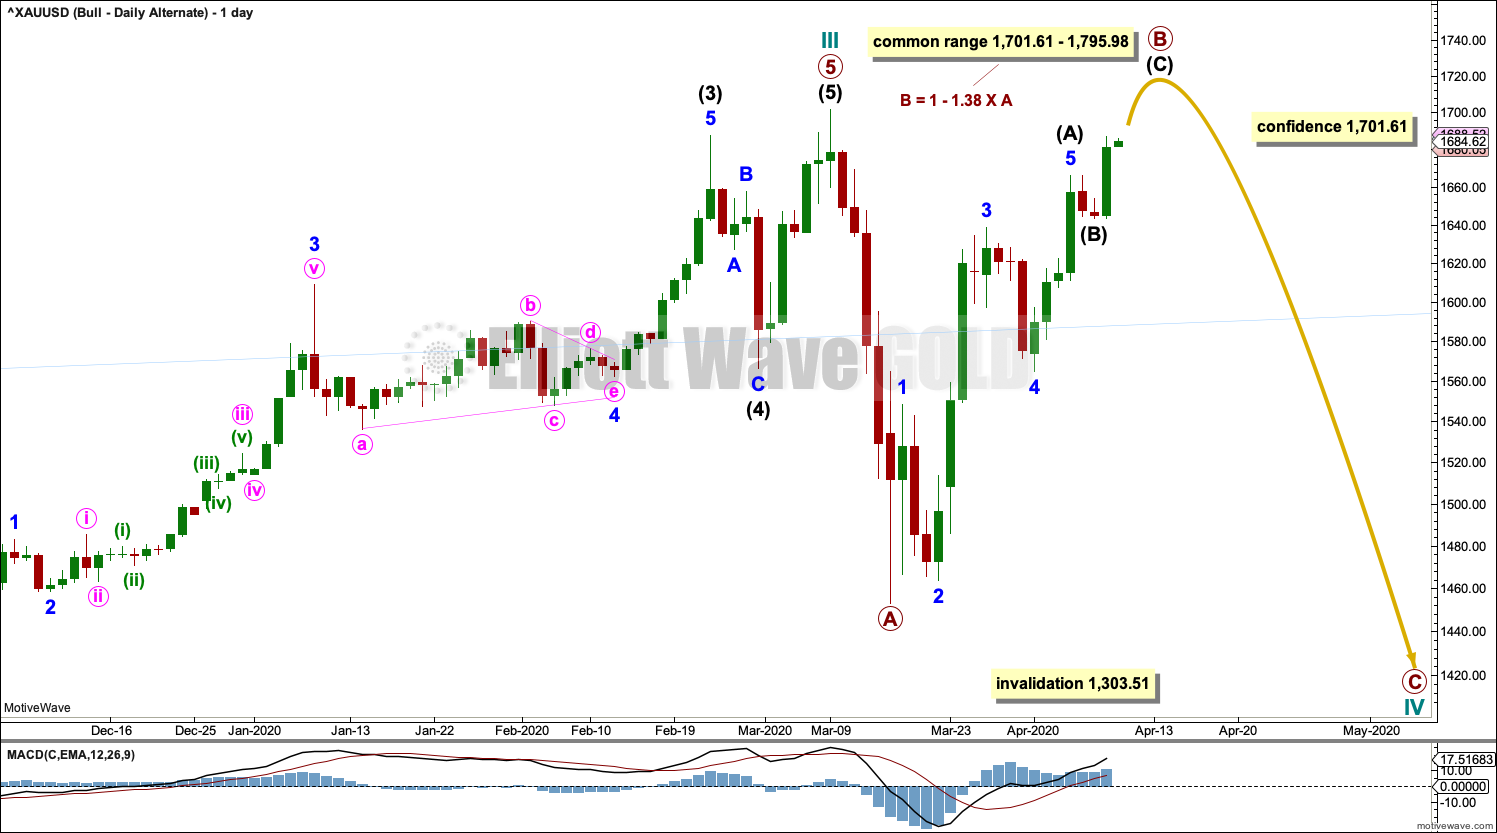
It is also possible that cycle wave IV may subdivide as a flat correction, triangle or combination. Both a flat and triangle would still provide structural alternation with the combination of cycle wave II.
If cycle wave IV subdivides as a flat correction, then within it primary wave B may make a new high above the start of primary wave A at 1,701.61. The common range for primary wave B within a flat would be from 1 to 1.38 times the length of primary wave A.
If cycle wave IV subdivides as a triangle, then within it primary wave B may make a new high above the start of primary wave A as in a running triangle.
There is no upper invalidation point for this wave count.
TECHNICAL ANALYSIS
WEEKLY CHART
Click chart to enlarge. Chart courtesy of StockCharts.com.
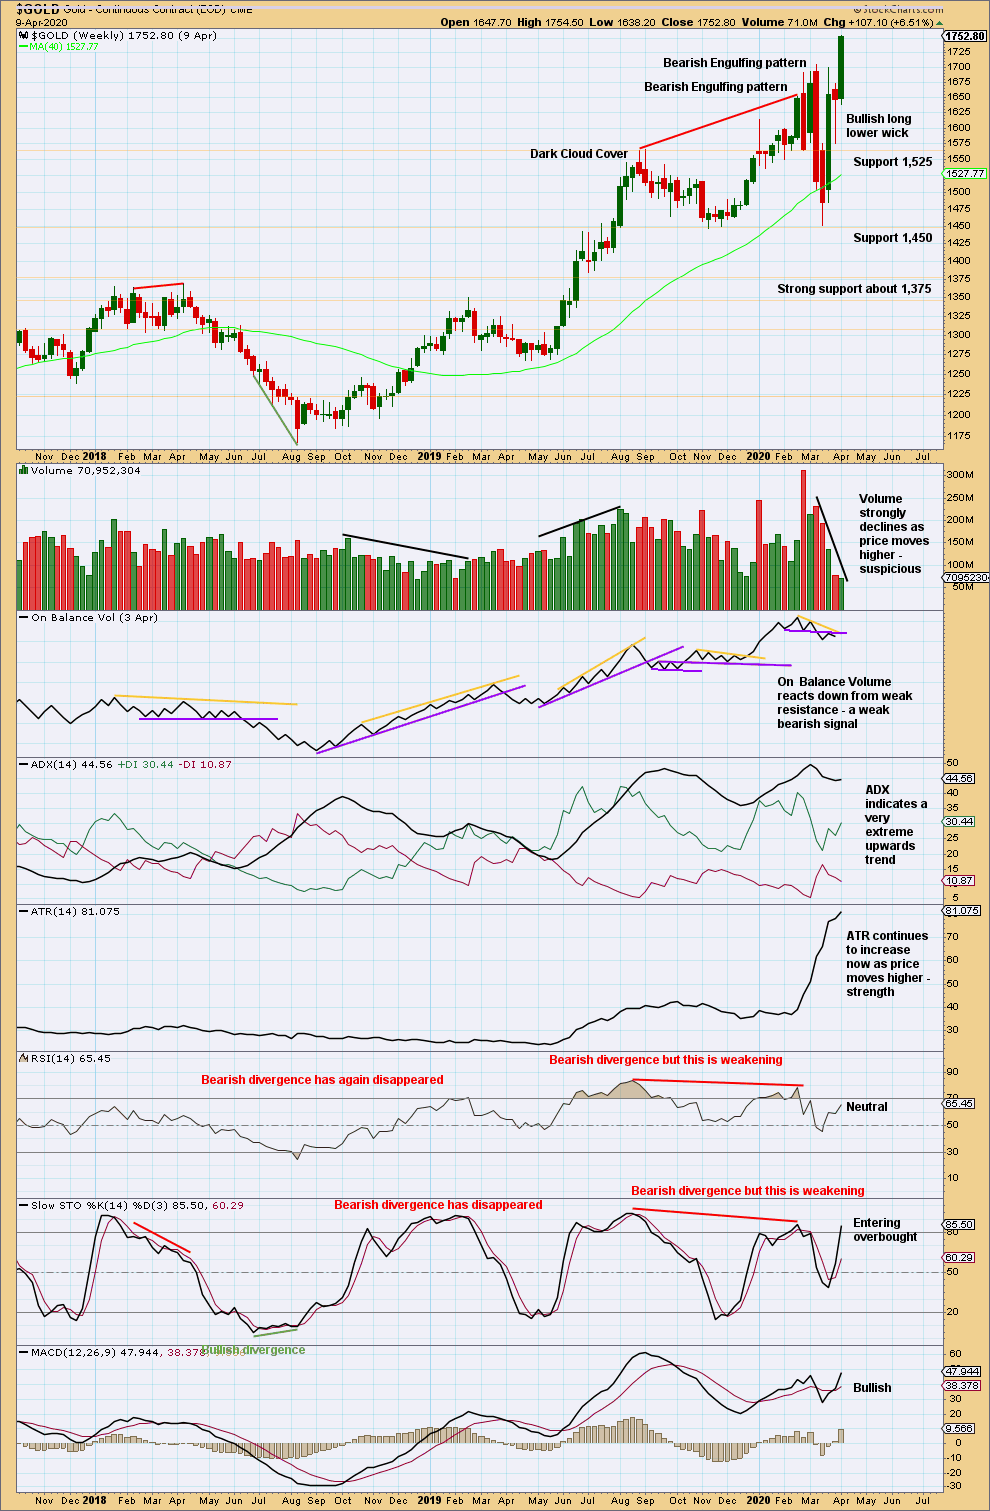
New highs this week come while the upwards trend is again very extreme. Volume this week is very weak. This upwards breakout should be treated with reasonable suspicion.
DAILY CHART
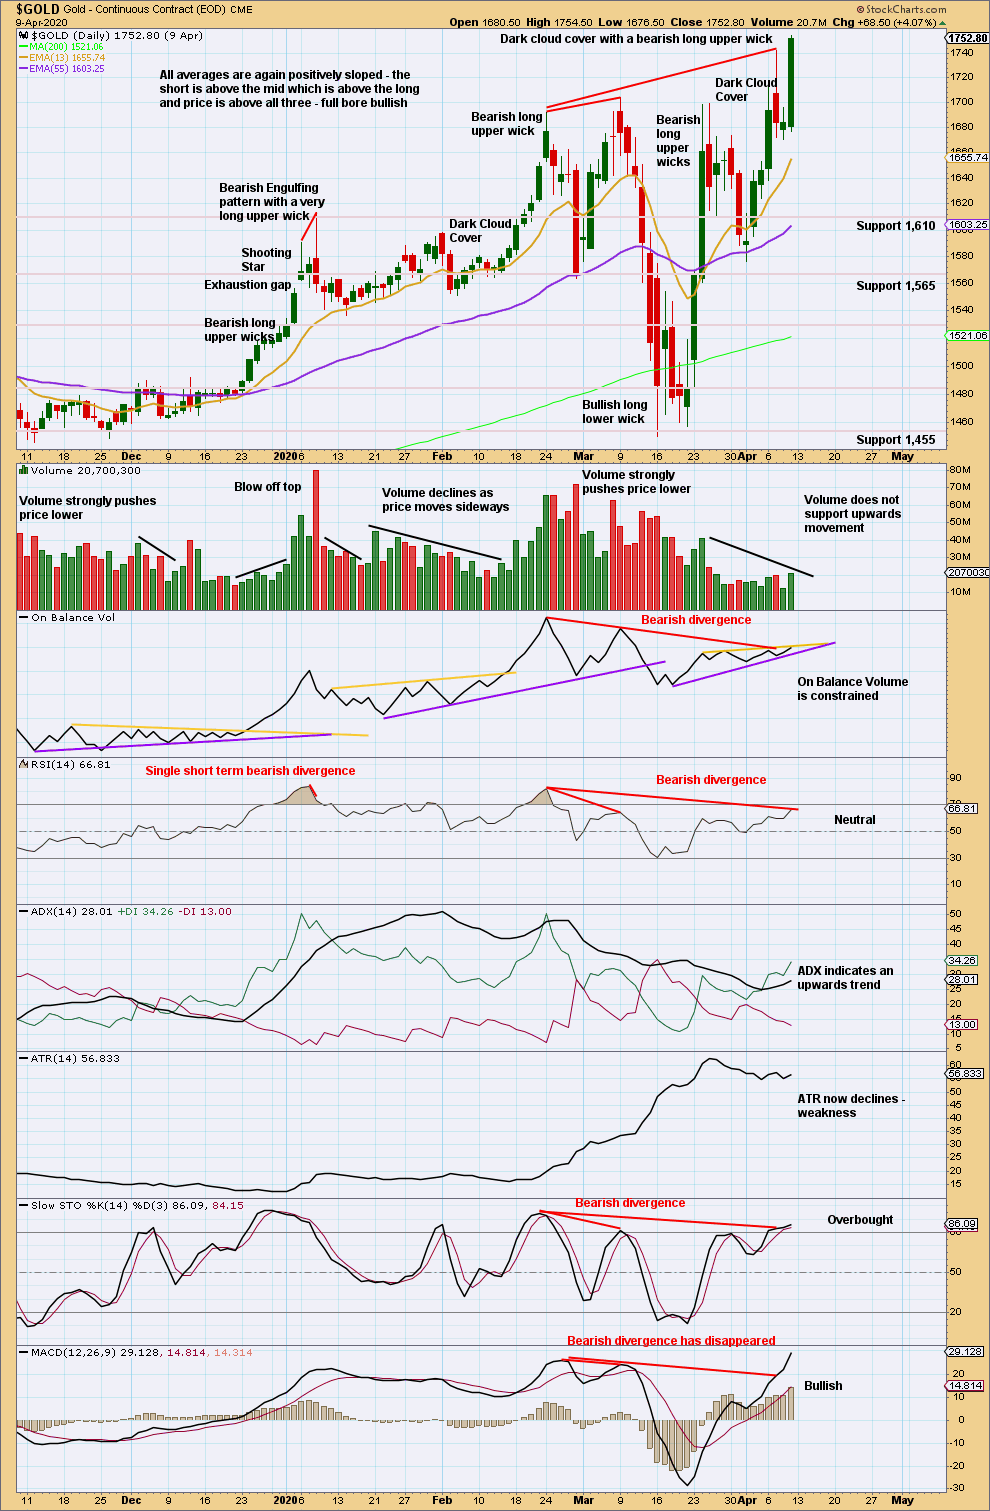
Click chart to enlarge. Chart courtesy of StockCharts.com.
Overall, volume remains very light and does not support this upwards movement. However, volume for Thursday’s upwards breakout and close to new highs does have a little support from volume.
Bearish divergence between price and all of On Balance Volume, RSI, and Stochastics remains. Bearish divergence between price and MACD has now disappeared.
The resistance line on On Balance Volume is adjusted for better technical significance.
From time to time there are differences between StockCharts and Barchart data. Gold is a truly global market; there is no one data feed that incorporates all global data points. Different feeds will have differences because they incorporate different geographic data points. The technical analysis relies upon Stockcharts data, while the Elliott wave analysis relies upon Barchart data. As long as the Elliott wave analysis is consistent in using the same data feed each day and each week, then it will be valid for that data feed.
GDX WEEKLY CHART
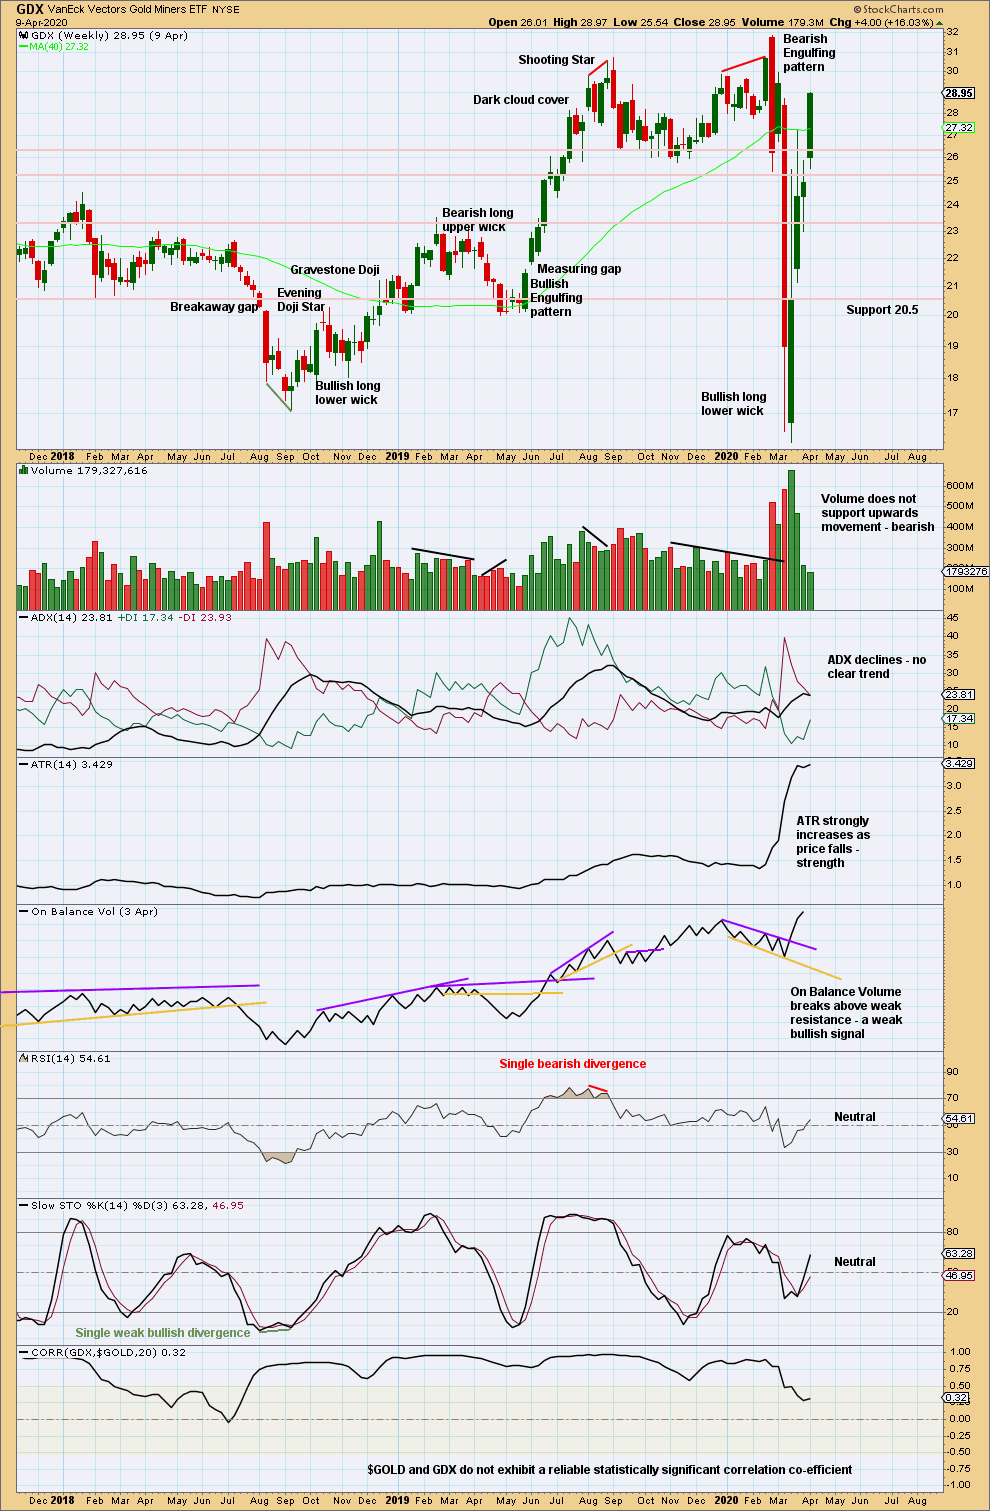
Click chart to enlarge. Chart courtesy of StockCharts.com.
Another wide ranging upwards week does not have support from volume. This upwards movement is suspicious.
GDX DAILY CHART
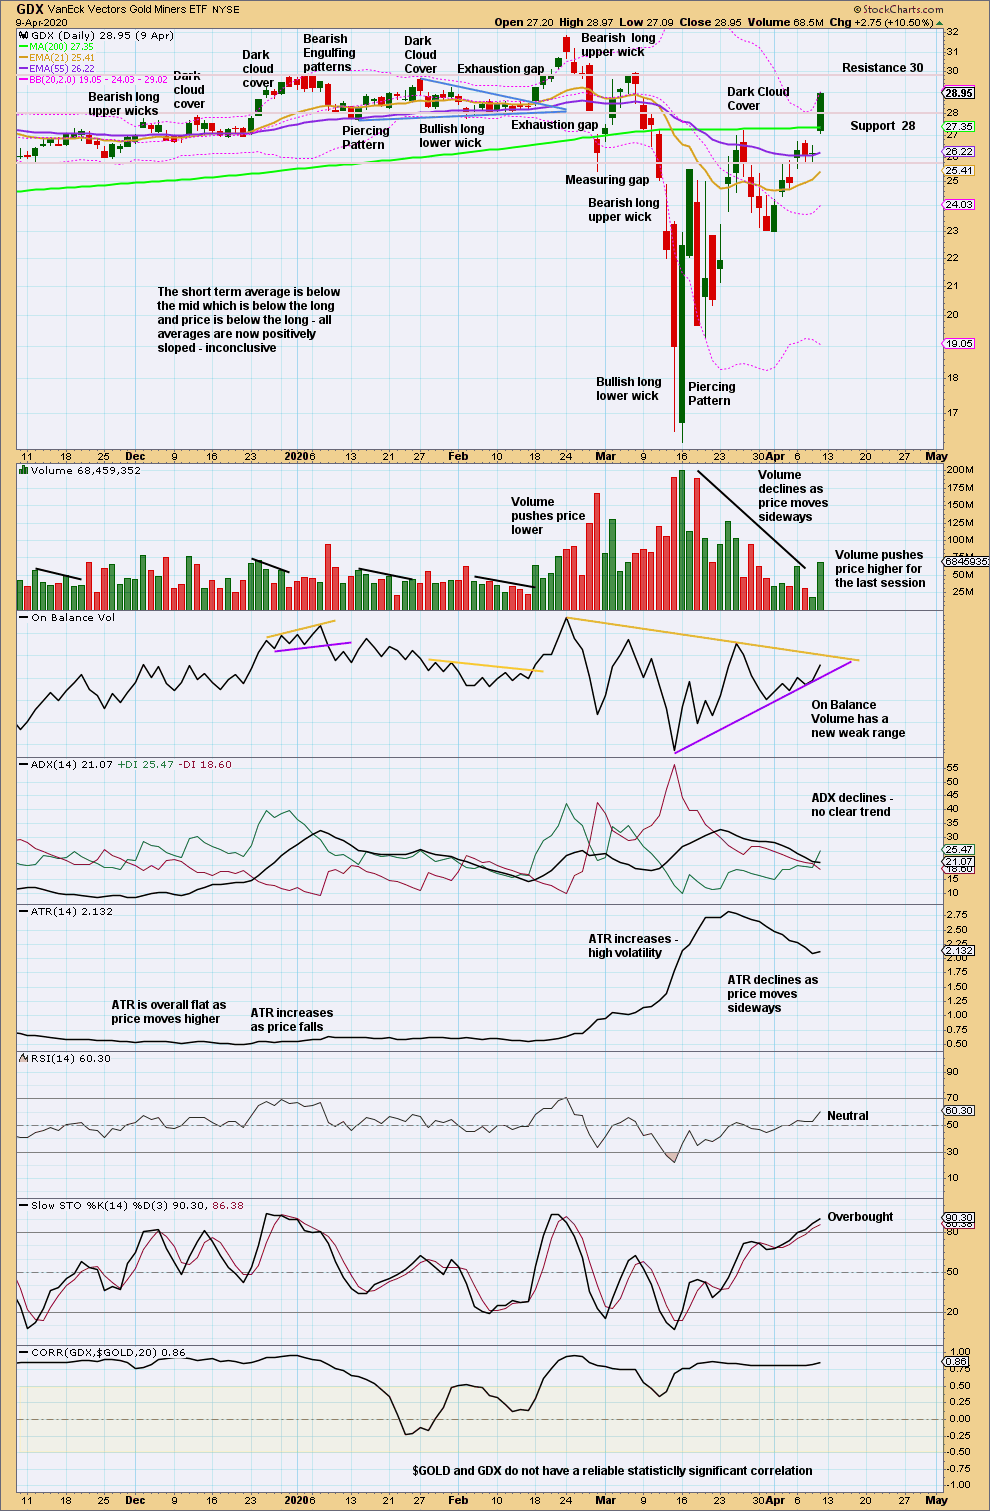
Click chart to enlarge. Chart courtesy of StockCharts.com.
An upwards breakout from a small consolidation was effected today with support from volume. A target calculated from the width of the consolidation zone is at 31.21.
US OIL
Price remained within the channel on the daily chart and continued lower this week exactly as expected.
Summary: Assume the downwards trend remains while price remains within the channel on the daily chart. There are now two final targets. The first is at 12.82. If price reaches this first target and the structure is incomplete, or if price keeps falling through this first target, then the second target is at 9.77.
A new high now above the upper edge of the black channel the daily charts would suggest it could be possible a sustainable low may be in place. This view would require a new high above 49.32 for confidence.
MAIN ELLIOTT WAVE COUNT – BEARISH
MONTHLY CHART
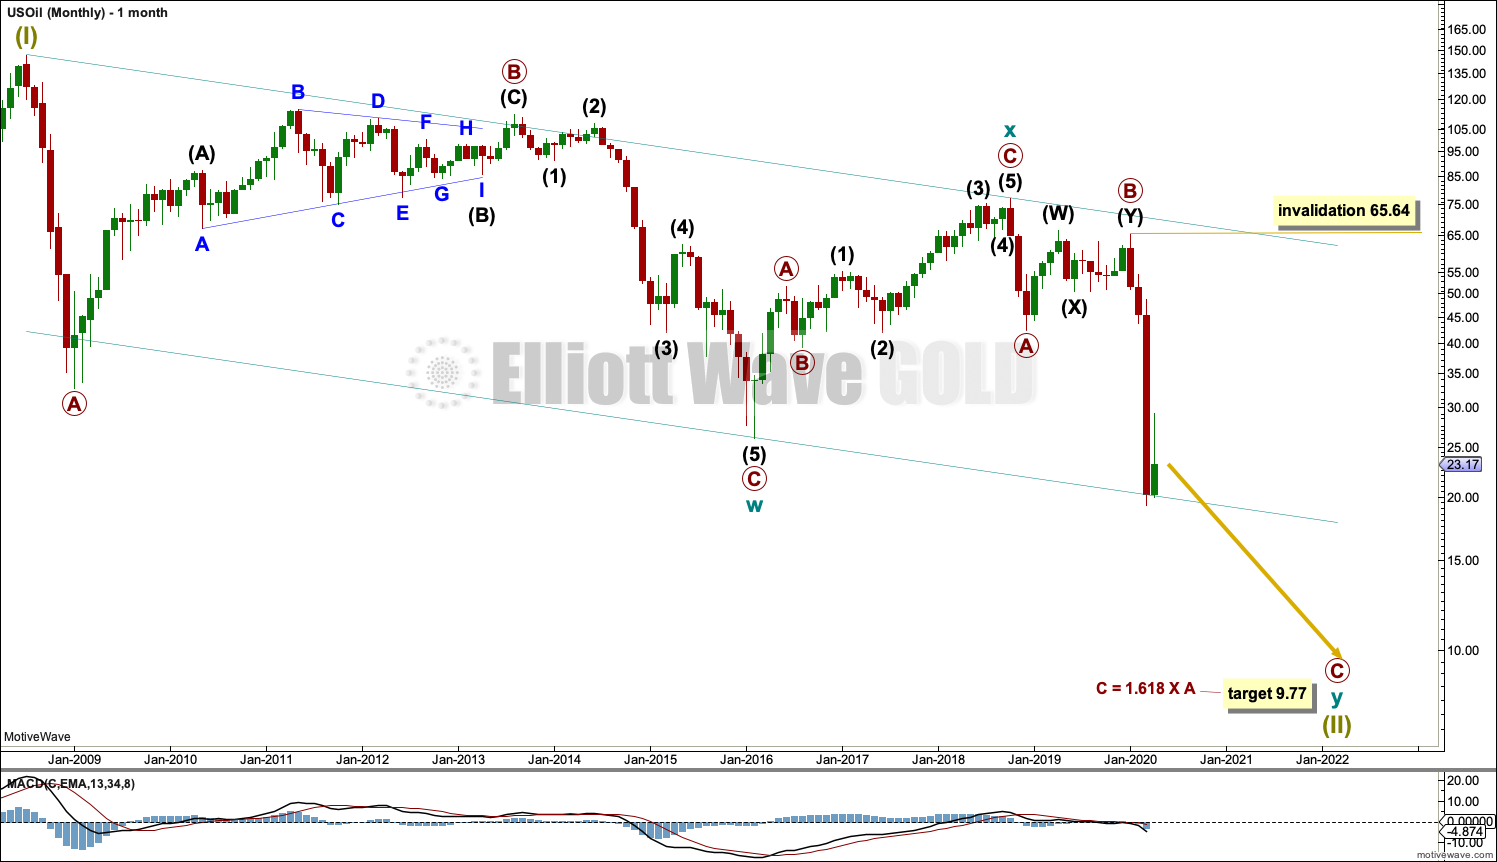
Click chart to enlarge.
The basic Elliott wave structure is five steps forward and three steps back. This Elliott wave count expects that US Oil is still within a three steps back pattern, which began in July 2008. The Elliott wave count expects that the bear market for US Oil continues.
This Elliott wave corrective structure is a double zigzag, which is a fairly common structure. The correction is labelled Super Cycle wave (II).
The first zigzag in the double is complete and labelled cycle wave w. The double is joined by a three in the opposite direction labelled cycle wave x, which subdivides as a zigzag. The second zigzag in the double is almost complete, labelled cycle wave y.
The purpose of a second zigzag in a double zigzag is to deepen the correction when the first zigzag does not move price deep enough. To achieve this purpose cycle wave y may be expected to move reasonably below the end of cycle wave w at 26.06. This purpose has now been achieved. The next thing to look for is a complete structure within primary wave C.
Primary wave C has passed equality in length with primary wave A at 31.11. The next Fibonacci ratio of 1.618 is used to calculate a target for primary wave C and cycle wave y to end.
Cycle wave y is expected to subdivide as a zigzag, which subdivides 5-3-5.
Cycle wave w lasted 7.6 years and cycle wave x lasted 2.7 years. Cycle wave y now looks like it may be over within a few more weeks.
Within primary wave C, no second wave correction may move beyond the start of its first wave above 65.64.
A channel is drawn about Super Cycle wave (II): draw the first trend line from the start of cycle wave w to the end of cycle wave x, then place a parallel copy on the end of cycle wave w. Price has bounced up off the channel. The target expects this trend line to be breached.
WEEKLY CHART
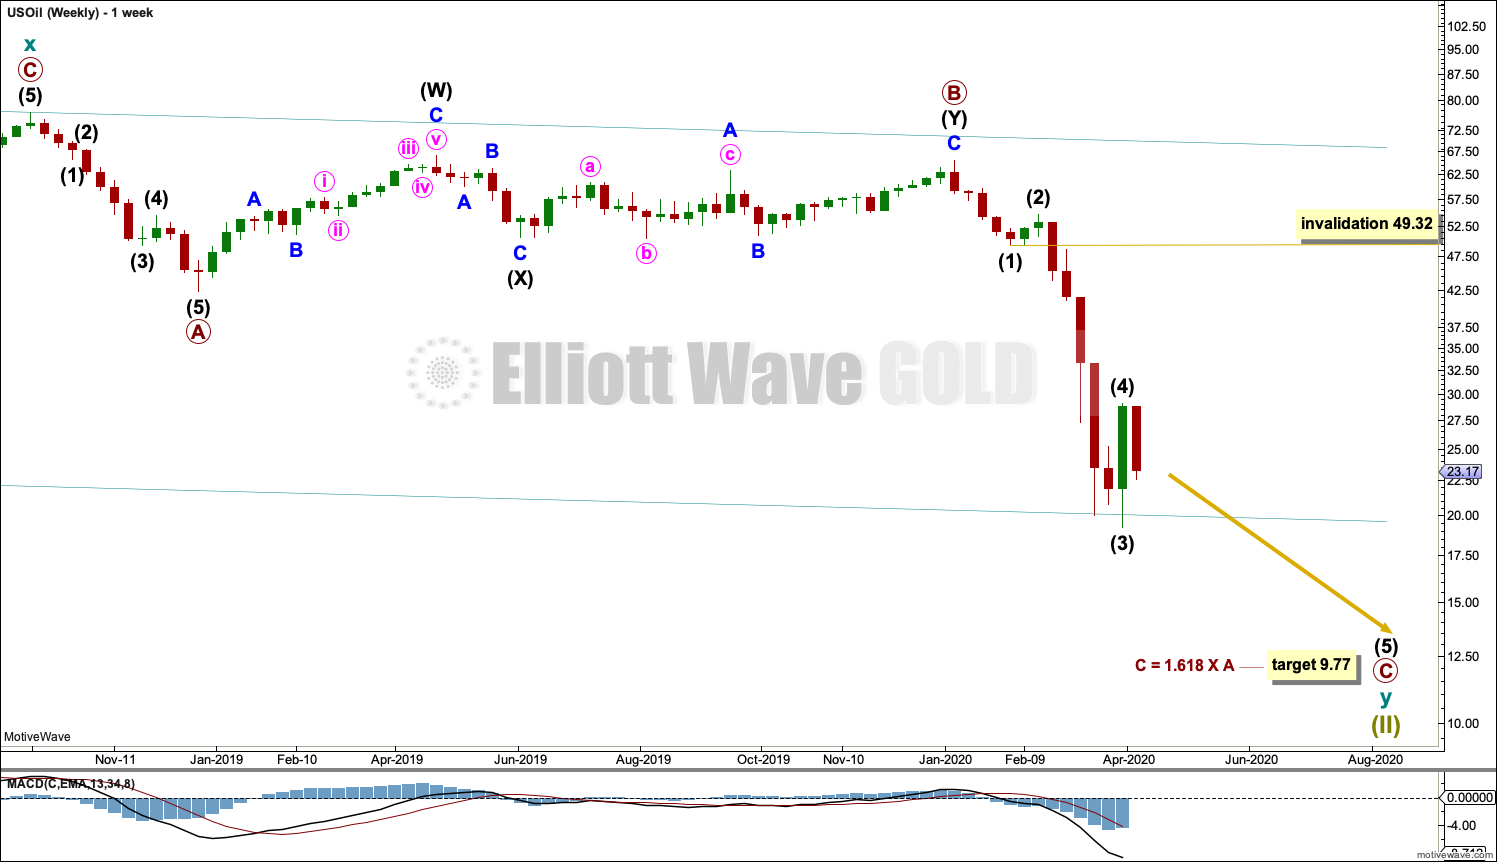
Click chart to enlarge.
This weekly chart shows all of cycle wave y so far.
Cycle wave y is expected to subdivide as a zigzag. A zigzag subdivides 5-3-5.
Primary wave C must subdivide as a five wave motive structure, most likely an impulse. Within primary wave C, intermediate waves (1) through to (4) may now all be complete. Intermediate wave (5) may have begun.
If it continues any higher, then intermediate wave (4) may not move into intermediate wave (1) price territory above 49.32.
DAILY CHART
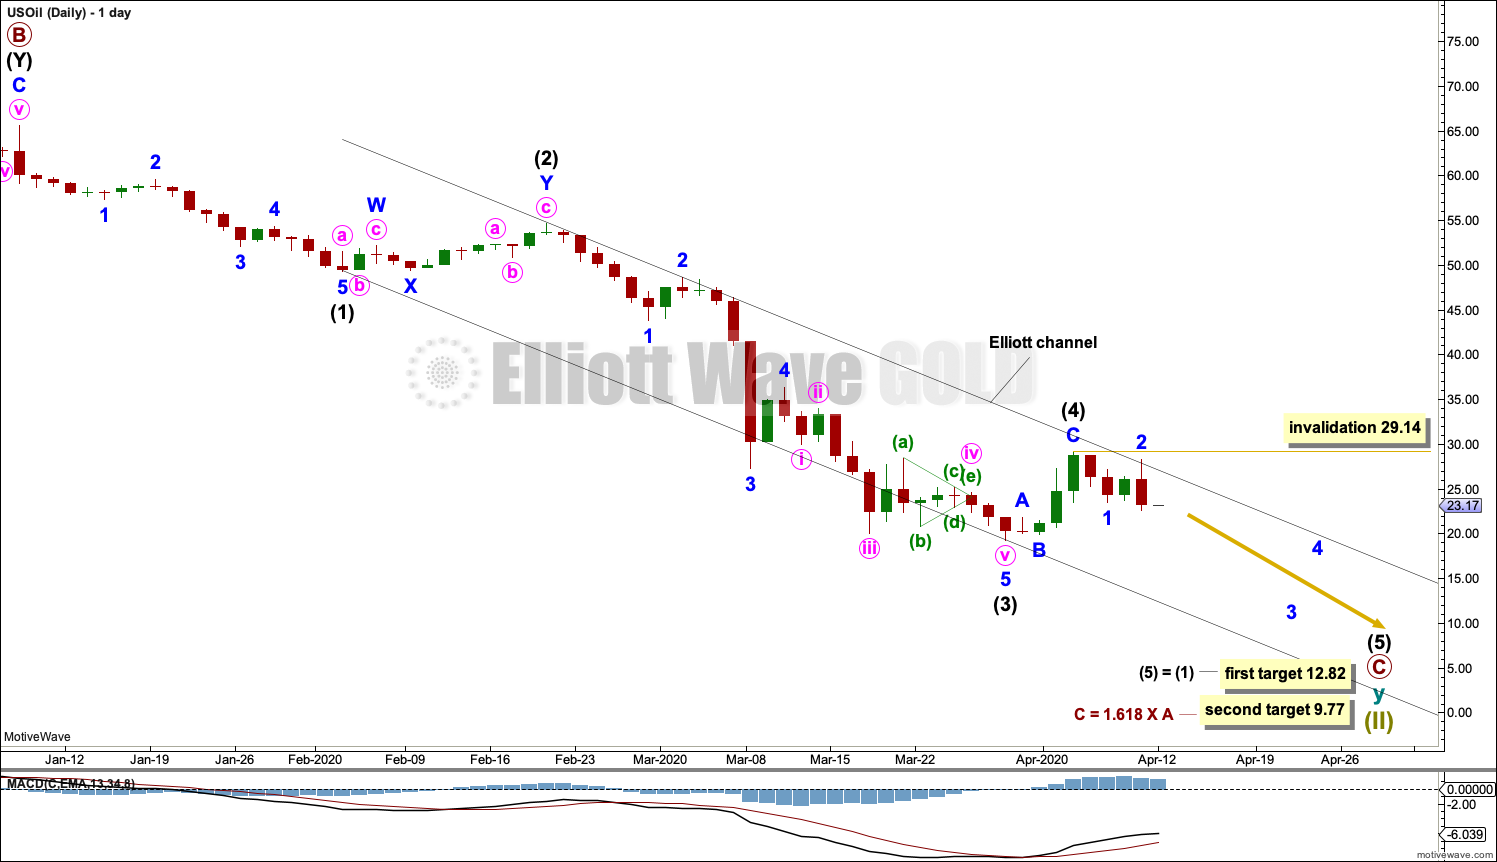
Click chart to enlarge.
Primary wave C must subdivide as a five wave motive structure, most likely an impulse. Within primary wave C, intermediate waves (1) through to (4) may now be complete.
Draw an Elliott channel about primary wave C: draw the first trend line from the end of intermediate wave (1) to the end of intermediate wave (3), then place a parallel copy on the end of intermediate wave (2). Intermediate wave (4) has found resistance at the upper edge of the channel.
A new target is calculated at intermediate degree. If price reaches the first target and either the structure is incomplete or price keeps falling, then the second target would be used.
If the Elliott channel is breached by upwards (not sideways) movement, then the alternate wave count below would increase in probability.
ALTERNATE DAILY CHART
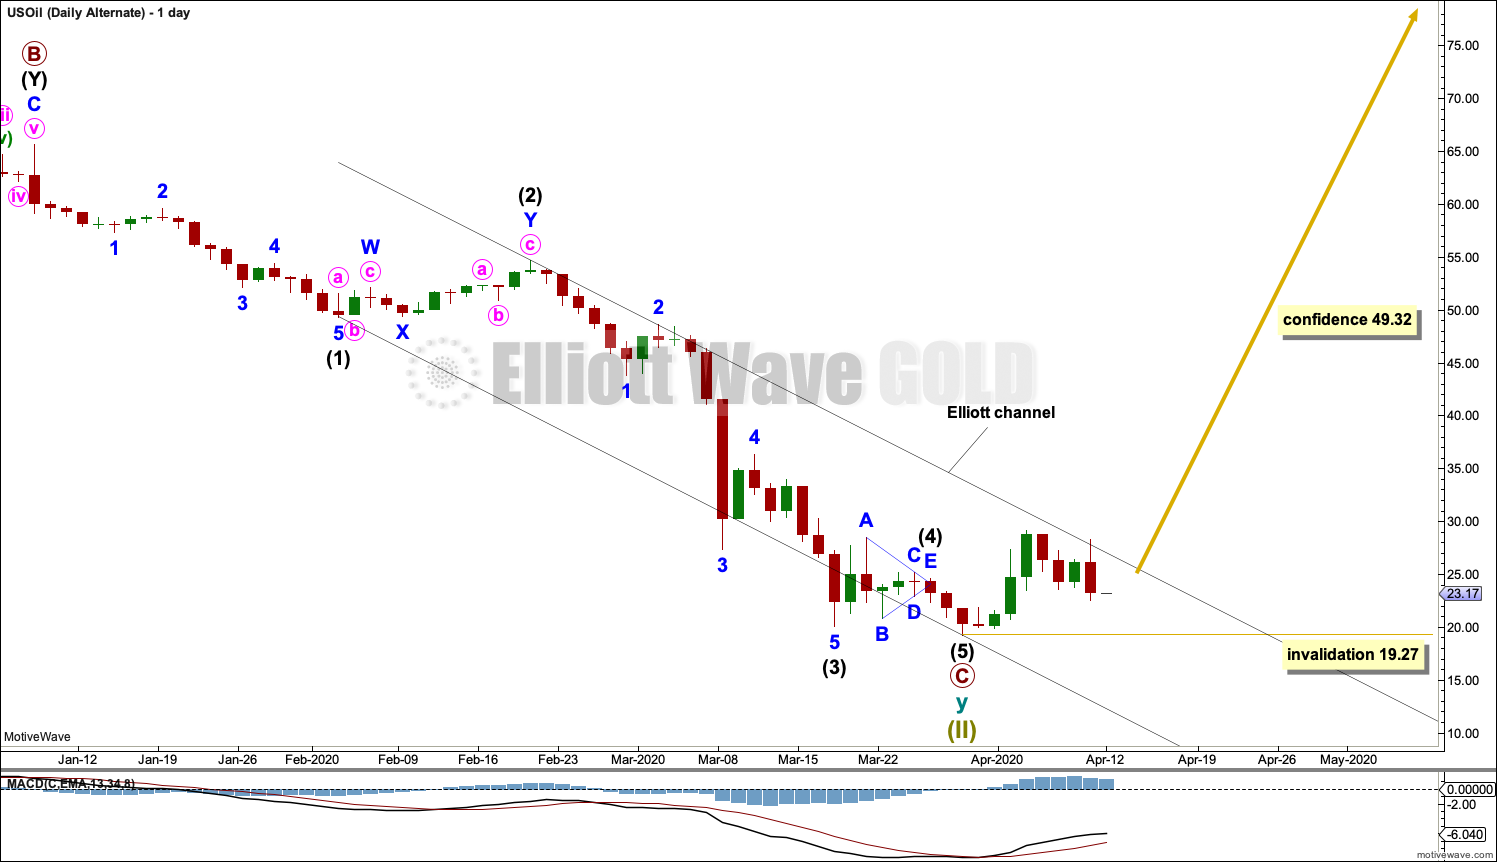
Click chart to enlarge.
It is possible that the bear market may now be complete for Oil. Grand Super Cycle wave (II) may be complete at all degrees.
This wave count requires a new high above 49.32 for confidence.
TECHNICAL ANALYSIS
MONTHLY CHART
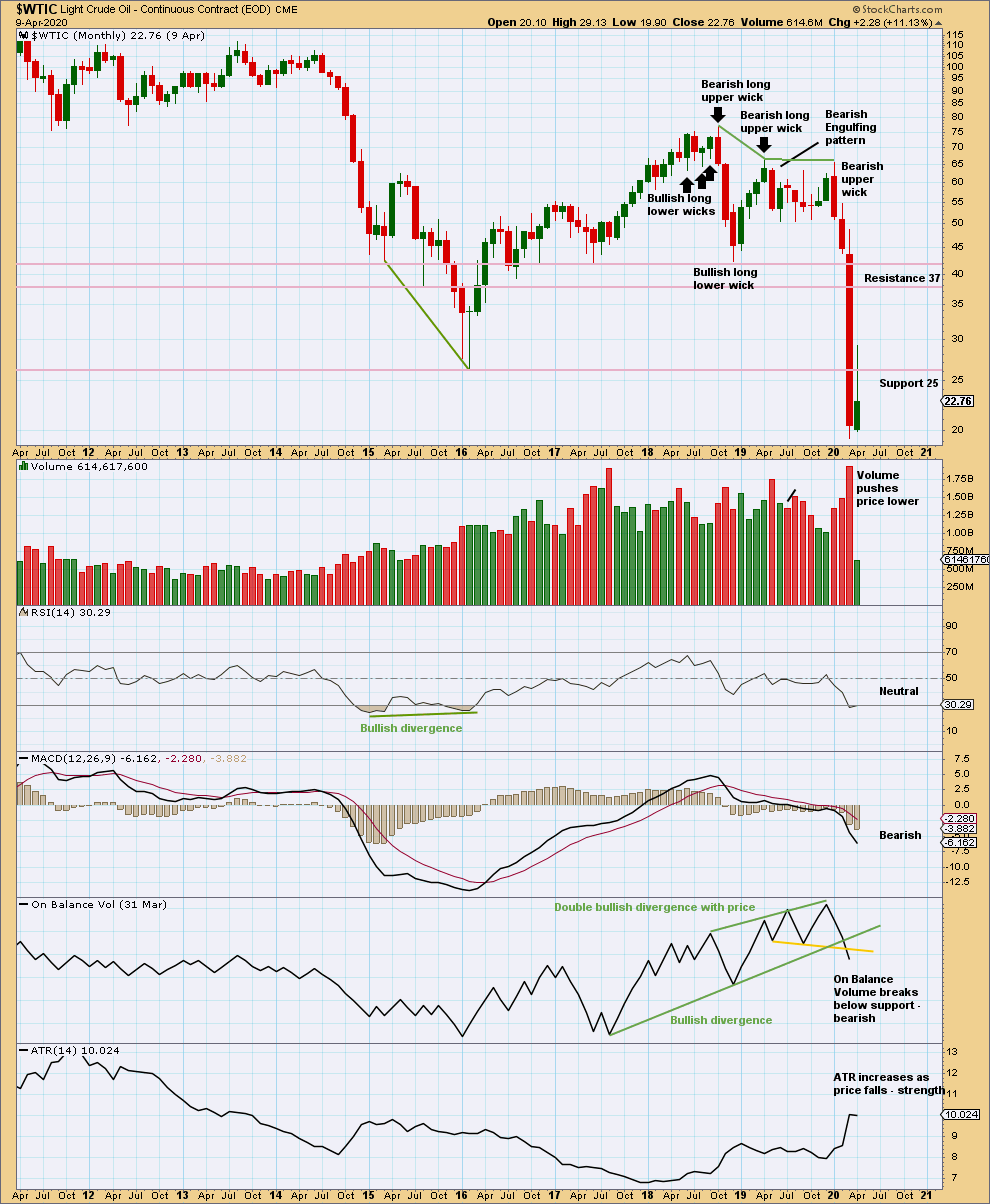
Click chart to enlarge. Chart courtesy of StockCharts.com.
When this market trends strongly down, it can reach extreme and yet price can continue for a reasonable distance.
A sustainable low may not yet be in place. Look for RSI to reach more deeply oversold and then to exhibit bullish divergence with price at swing lows.
WEEKLY CHART
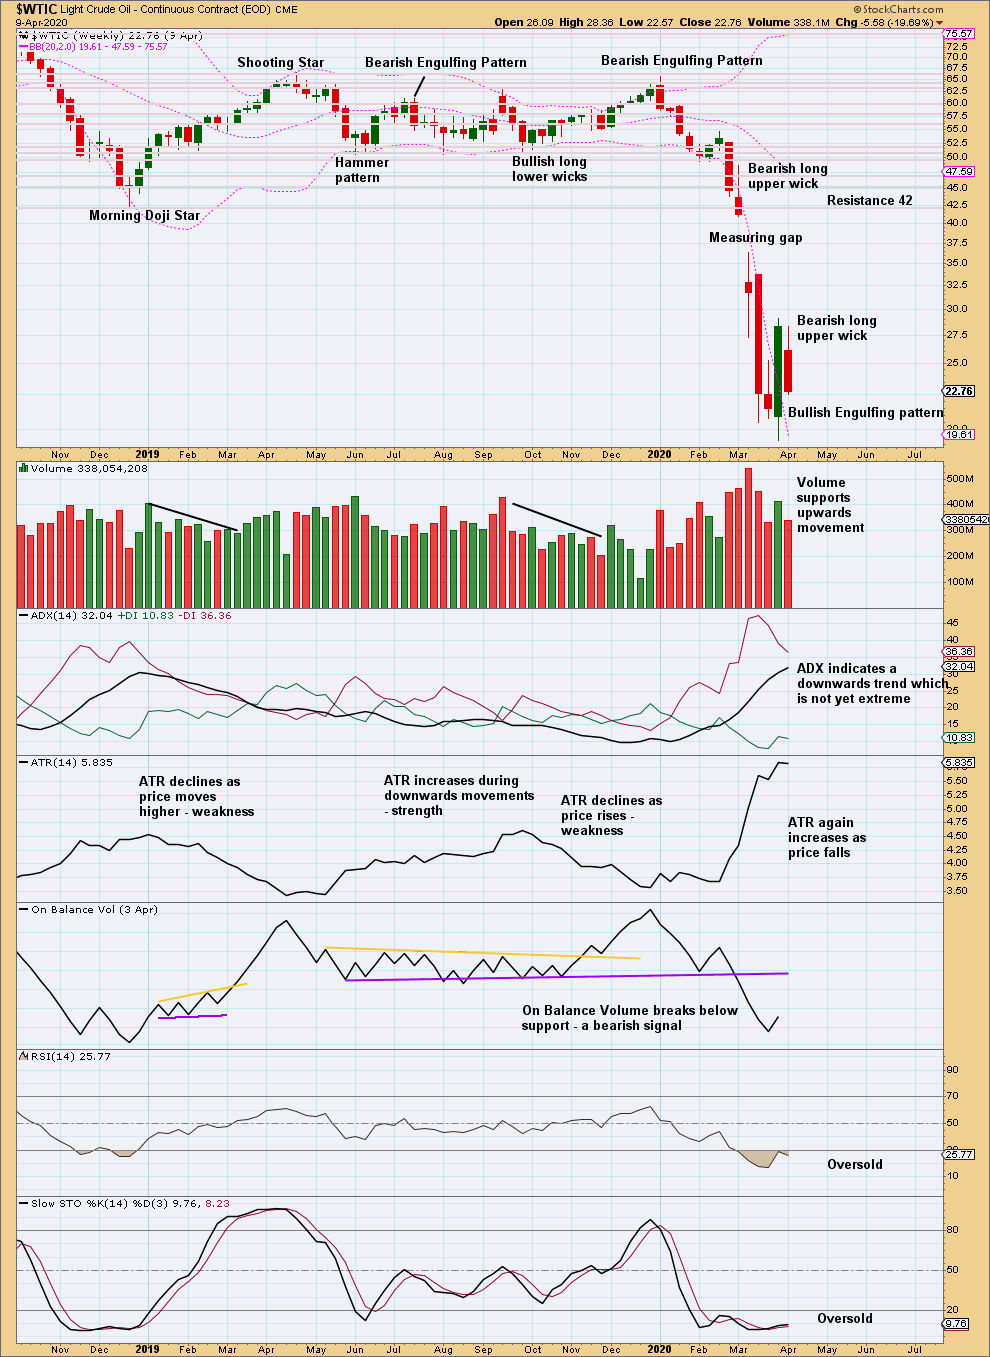
Click chart to enlarge. Chart courtesy of StockCharts.com.
Overall, expect the downwards trend to continue (but keep in mind price does not move in straight lines).
A strong Bullish Engulfing pattern with support from volume suggests a possible trend change. If the measuring gap is closed with a new high above 41.05, then that would indicate a trend change. An inside week this week does not change that view.
DAILY CHART
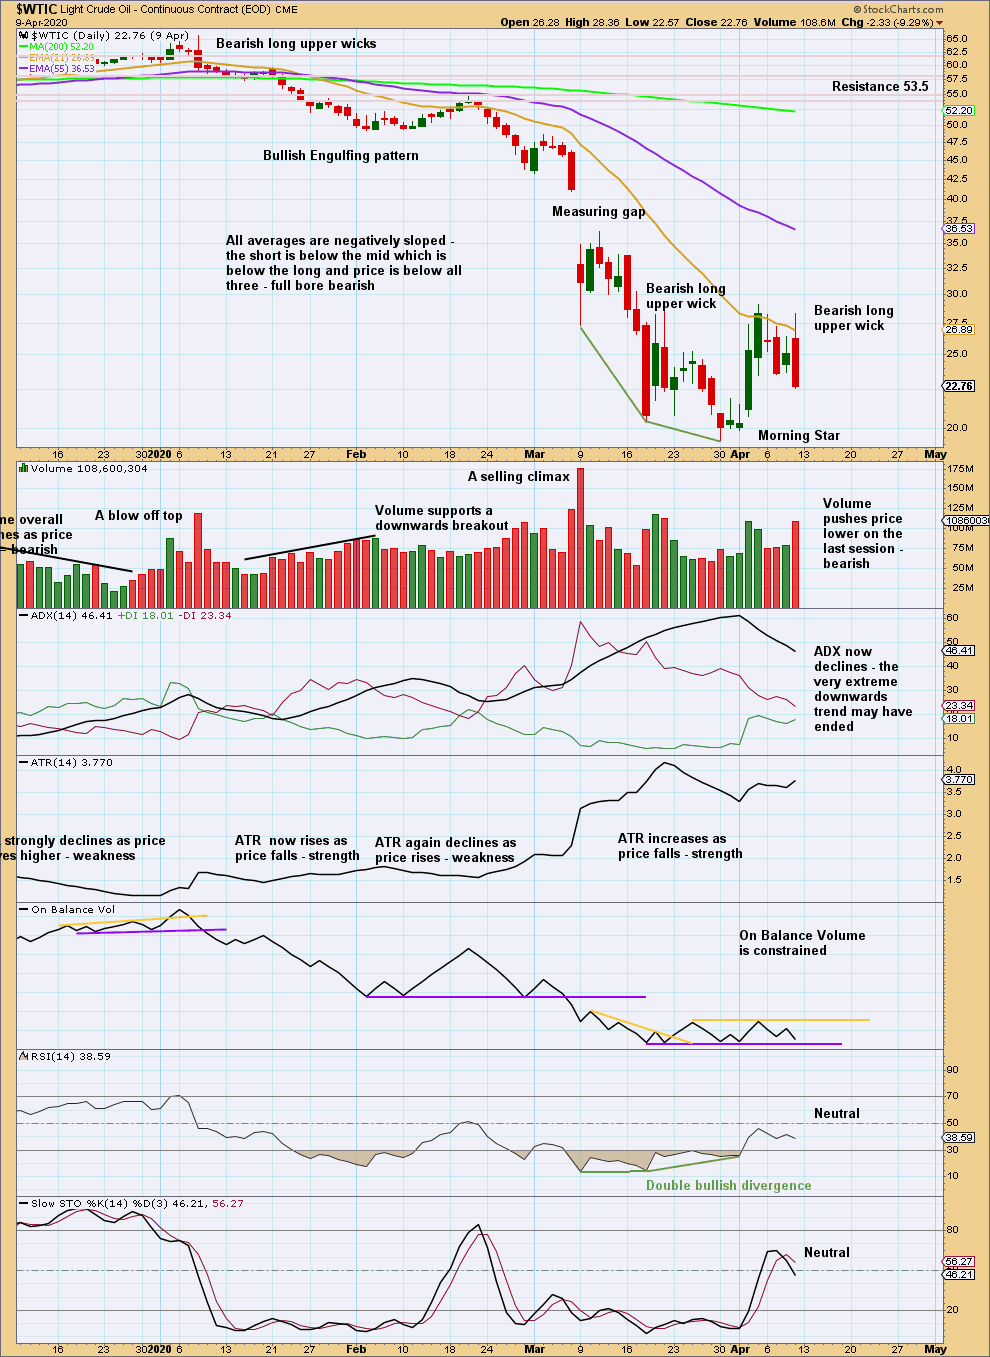
Click chart to enlarge. Chart courtesy of StockCharts.com.
For the short term, push from volume and a bearish long upper wick suggest more downwards movement immediately ahead.
—
Always practice good risk management as the most important aspect of trading. Always trade with stops and invest only 1-5% of equity on any one trade. Failure to manage risk is the most common mistake new traders make.