
Lara’s Weekly: Elliott Wave and Technical Analysis of S&P500 and Gold and US Oil | Charts – January 10, 2020

S&P 500
All week this analysis has expected more upwards movement as most likely, which is what has happened. The target remains the same.
Summary: The next target is at 3,289.
It is possible that minor wave 3 could be over. Some confidence in this view may be had with a new low below 3,258.14. There is now some weakness developing. The risk of a larger pullback or consolidation beginning here or very soon is now high.
Three large pullbacks or consolidations (fourth waves) during the next 1-2 years are expected: for minor wave 4 (coming soon, possibly just begun), then intermediate (4), and then primary 4.
The biggest picture, Grand Super Cycle analysis, is here.
Monthly charts were last published here. There are two further alternate monthly charts here.
ELLIOTT WAVE COUNTS
The two weekly Elliott wave counts below will be labelled First and Second. They may be about of even probability. When the fifth wave currently unfolding on weekly charts may be complete, then these two wave counts will diverge on the severity of the expected following bear market. To see an illustration of this future divergence monthly charts should be viewed.
FIRST WAVE COUNT
WEEKLY CHART
Click chart to enlarge.
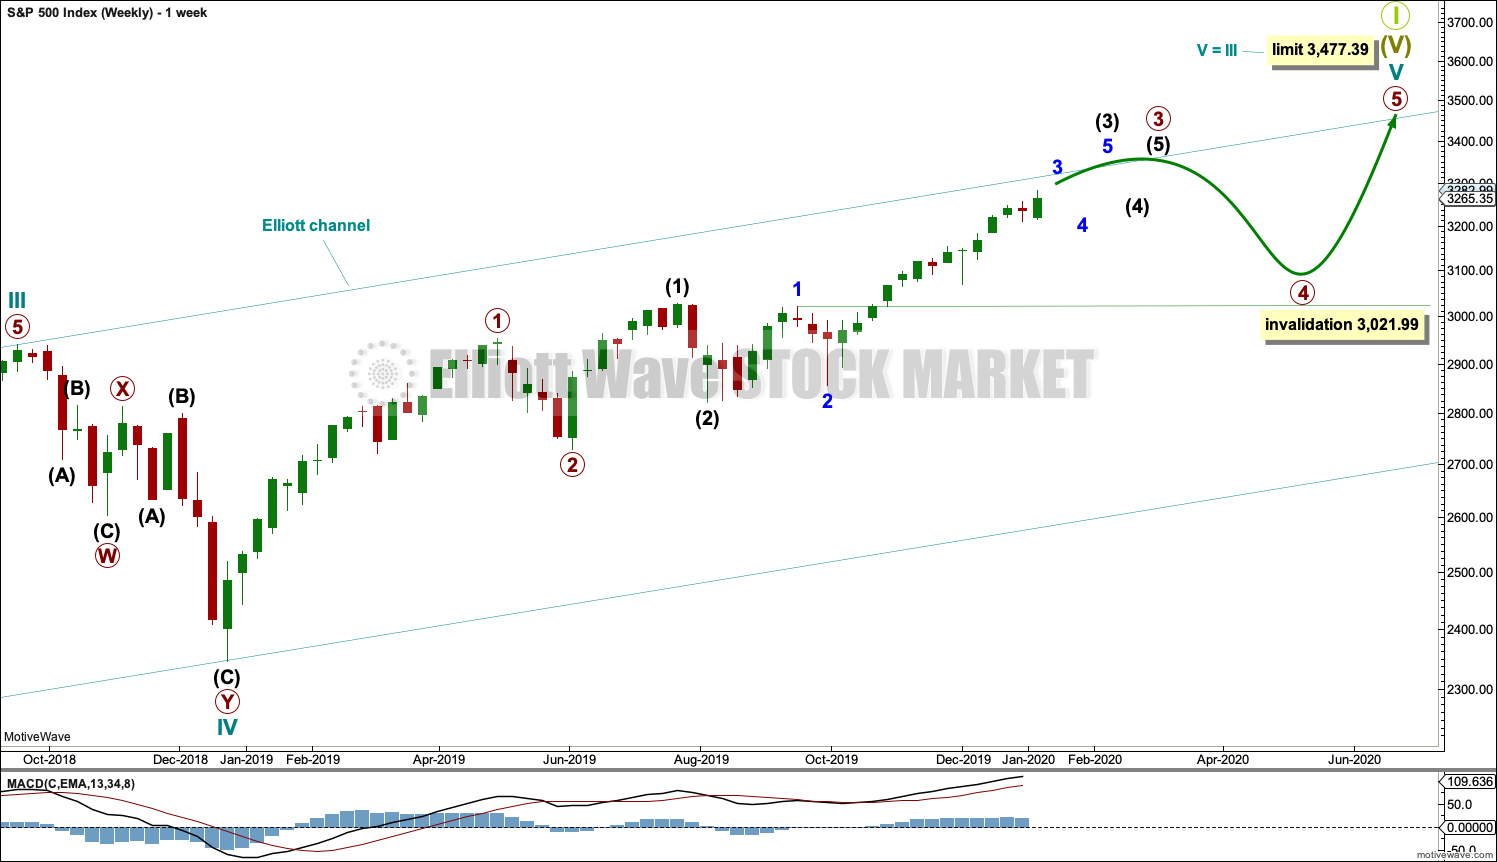
The basic Elliott wave structure consists of a five wave structure up followed by a three wave structure down (for a bull market). This wave count sees the bull market beginning in March 2009 as an incomplete five wave impulse and now within the last fifth wave, which is labelled cycle wave V. This impulse is best viewed on monthly charts. The weekly chart focusses on the end of it.
Elliott wave is fractal. This fifth wave labelled cycle wave V may end a larger fifth wave labelled Super Cycle wave (V), which may end a larger first wave labelled Grand Super Cycle wave I.
The teal Elliott channel is drawn using Elliott’s first technique about the impulse of Super Cycle wave (V). Draw the first trend line from the end of cycle wave I (off to the left of the chart, the weekly candlestick beginning 30th November 2014) to the end of cycle wave III, then place a parallel copy on the end of cycle wave II (off to the left of the chart, the weekly candlestick beginning 14th February 2016). This channel perfectly shows where cycle wave IV ended at support. The strongest portion of cycle wave III, the end of primary wave 3, overshoots the upper edge of the channel. This is a typical look for a third wave and suggests the channel is drawn correctly and the way the impulse is counted is correct.
Within Super Cycle wave (V), cycle wave III is shorter than cycle wave I. A core Elliott wave rule states that a third wave may never be the shortest. For this rule to be met in this instance, cycle wave V may not be longer in length than cycle wave III. This limit is at 3,477.39.
Cycle wave V may subdivide either as an impulse or an ending diagonal. Impulses are much more common, and it is clear at this stage that cycle wave V is an impulse and not a diagonal.
At this stage, cycle wave V may take another one to two or so years to complete.
The daily chart below will focus on movement from the end of intermediate wave (2) within primary wave 3.
In historic analysis, two further monthly charts have been published that do not have a limit to upwards movement and are more bullish than this wave count. Members are encouraged to consider those possibilities (links below summary) alongside the wave counts presented on a daily and weekly basis. It is my judgement that the two weekly wave counts published in this analysis have the highest probability, so they shall be the only wave counts published on a daily basis.
Within cycle wave V, primary waves 1 and 2 may be complete. Within primary wave 3, intermediate waves (1) and (2) may be complete. Within the middle of intermediate wave (3), minor wave 4 may not move into minor wave 1 price territory below 3,021.99.
DAILY CHART
Click chart to enlarge.
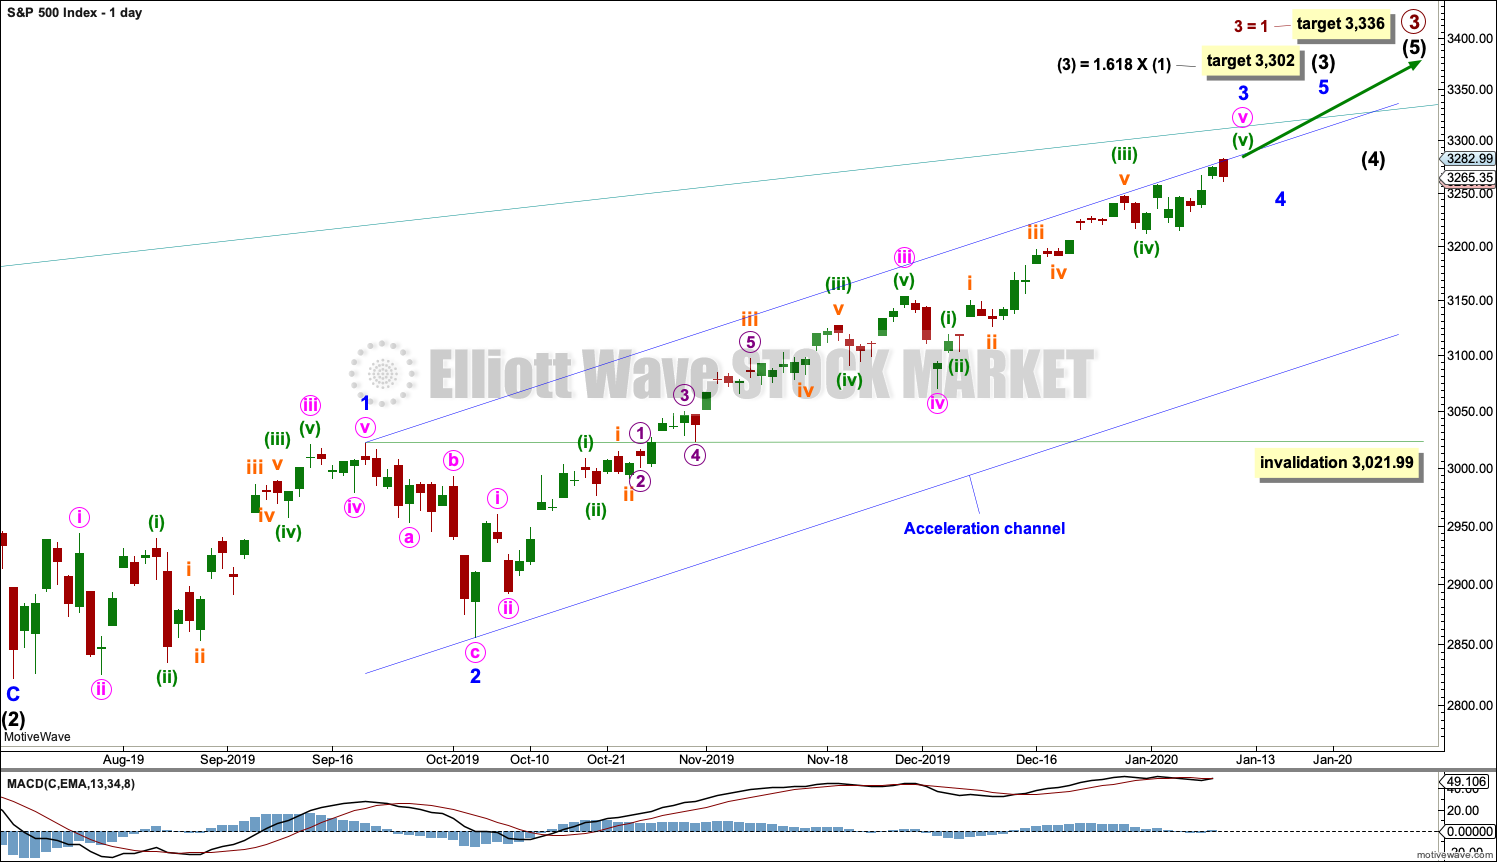
All of primary wave 3, intermediate wave (3) and minor wave 3 may only subdivide as impulses.
Minor wave 3 has passed 1.618 the length of minor wave 1, and within it minute wave v has passed equality in length with minute wave i. The next target may be now about 3,289 where minuette wave (v) within minute wave v would reach 1.618 the length of minuette wave (i).
Minor wave 2 was a sharp deep pullback, so minor wave 4 may be expected to be a very shallow sideways consolidation to exhibit alternation. Minor wave 2 lasted 2 weeks. Minor wave 4 may be about the same duration, or it may be a longer lasting consolidation. Minor wave 4 may end within the price territory of the fourth wave of one lesser degree; minute wave iv has its range from 3,154.26 to 3,070.49.
Minor wave 4 may not move into minor wave 1 price territory below 3,021.99.
Intermediate wave (3) has now moved far enough above the end of intermediate wave (1) to allow intermediate wave (4) to unfold and remain above intermediate wave (1) price territory.
Draw an acceleration channel now about intermediate wave (3): draw the first trend line from the end of minor wave 1 to the last high, then place a parallel copy on the end of minor wave 2. Keep redrawing the channel as price makes new highs. Minor wave 4 may find support at the lower edge of this channel if it is long lasting or deep enough.
Price is approaching the upper edge of the wide teal channel copied over from monthly and weekly charts. If price gets up to this trend line, then a reaction downwards there would be highly likely.
SECOND WAVE COUNT
WEEKLY CHART
Click chart to enlarge.
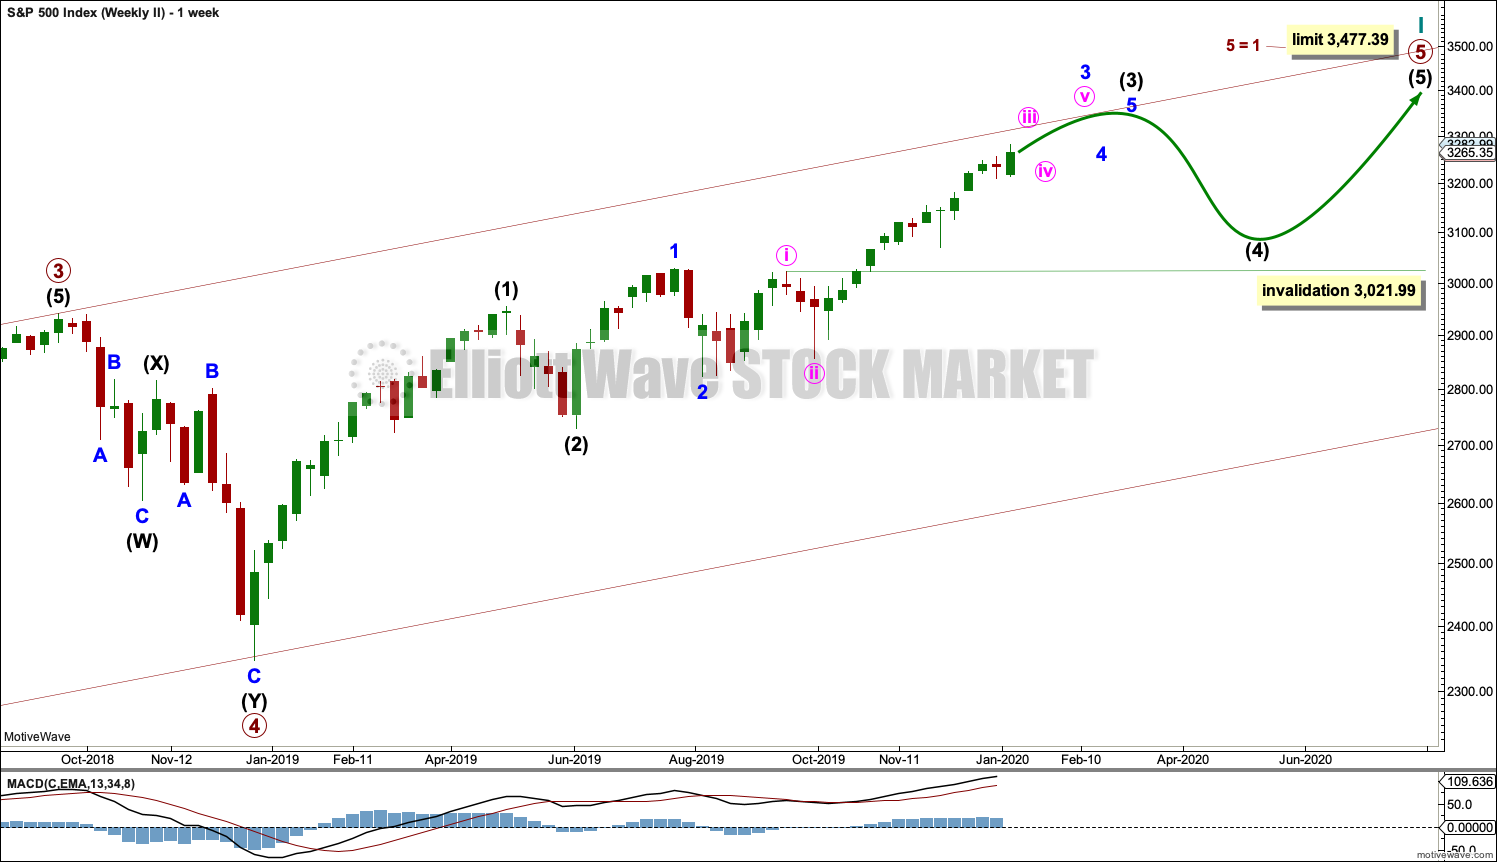
This weekly chart is almost identical to the first weekly chart, with the sole exception being the degree of labelling.
This weekly chart moves the degree of labelling for the impulse beginning in March 2009 all down one degree. This difference is best viewed on monthly charts.
The impulse is still viewed as nearing an end; a fifth wave is still seen as needing to complete higher. This wave count labels it primary wave 5. Primary wave 5 may still need another year to two or so to complete, depending upon how time consuming the corrections within it may be.
Primary wave 5 may be subdividing as an impulse, in the same way that cycle wave V is seen for the first weekly chart.
TECHNICAL ANALYSIS
WEEKLY CHART
Click chart to enlarge. Chart courtesy of StockCharts.com.
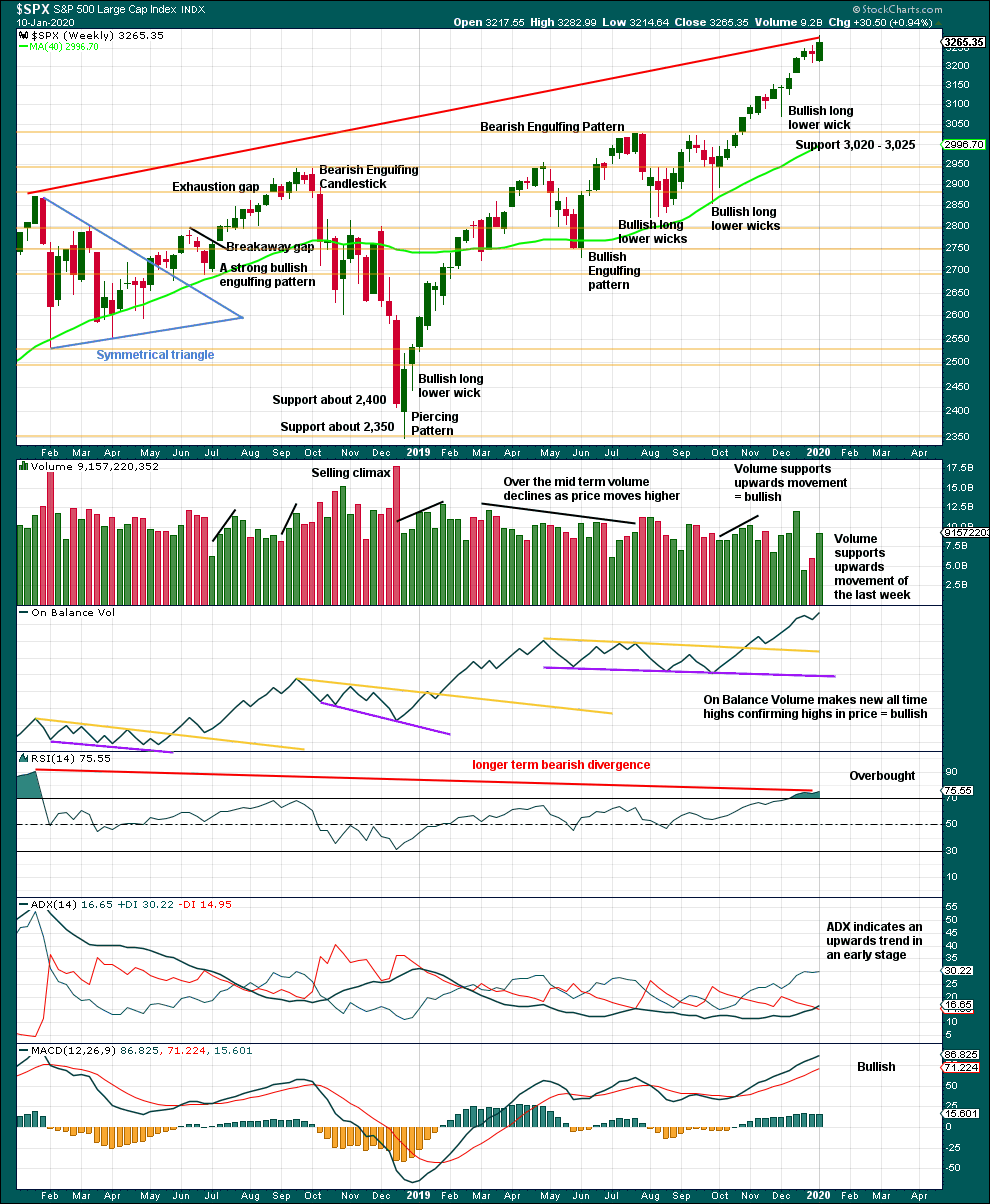
It is very clear that the S&P is in an upwards trend and the bull market is continuing. Price does not move in straight lines; there will be pullbacks and consolidations along the way.
This chart is overall bullish. There are no signs of short-term weakness in upwards movement.
RSI is now overbought. That does not mean upwards movement must end here, because it can continue for several weeks while RSI reaches more extreme. RSI reaching overbought is a warning that conditions are now becoming extreme. A pullback or consolidation will follow and the longer conditions are extreme the closer this will be. However, assume the trend remains the same until proven otherwise. This warning should be heeded by careful attention to risk management.
This week completes a strong bullish candlestick with some support from volume. The trend remains upwards, for now.
DAILY CHART
Click chart to enlarge. Chart courtesy of StockCharts.com.
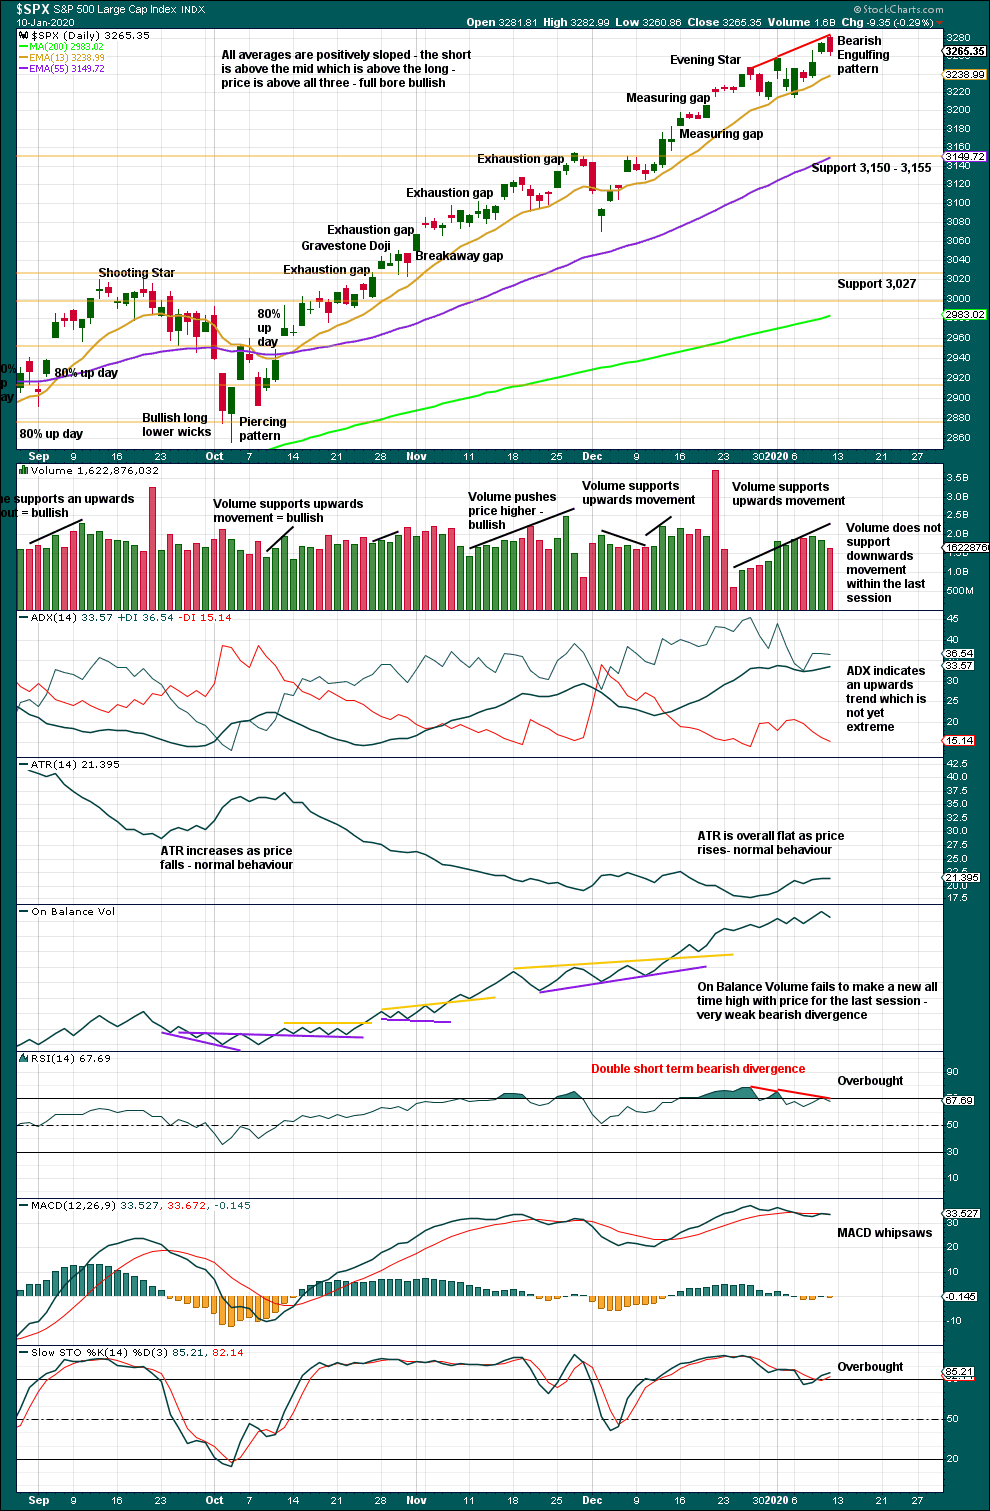
There is an upwards trend in place. There will be corrections along the way.
Like the weekly chart, this chart is bullish.
RSI now exhibits double bearish divergence while overbought. This is often (not always) a warning of a pullback or consolidation to develop. The warning is slightly weakened but still evident.
Lowry’s data shows evidence of weakness in a rise of Selling Pressure by 4 points over the last few sessions. The risk here of a larger pullback or consolidation is increasing.
Corrections for this market can sometimes arrive with very little warning. Extreme conditions warrant more careful attention to risk management. Upwards movement could continue yet for a reasonable distance and time, but the risk of a consolidation or pullback is increasing.
BREADTH – AD LINE
WEEKLY CHART
Click chart to enlarge. Chart courtesy of StockCharts.com. So that colour blind members are included, bearish signals will be noted with blue and bullish signals with yellow.
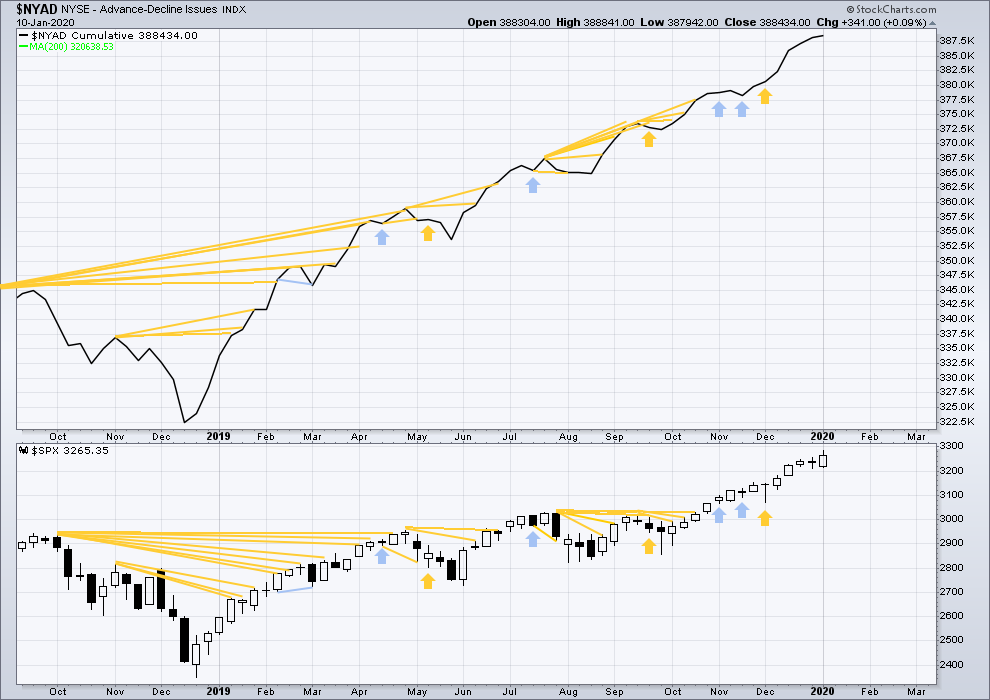
Bear markets from the Great Depression and onwards have been preceded by an average minimum of 4 months divergence between price and the AD line with only two exceptions in 1946 and 1976. With the AD line making new all time highs this week, the end of this bull market and the start of a new bear market is very likely a minimum of 4 months away, which is mid May 2020.
In all bear markets in the last 90 years there is some positive correlation (0.6022) between the length of bearish divergence and the depth of the following bear market. No to little divergence is correlated with more shallow bear markets. Longer divergence is correlated with deeper bear markets.
If a bear market does develop here, it comes after no bearish divergence. It would therefore more likely be shallow.
Again both price and the AD line have made new all time highs. There is no divergence. Upwards movement has support from rising market breadth.
Large caps all time high: 3,282.99 on 10th January 2020.
Mid caps all time high: 2,073.72 on 2nd January 2020.
Small caps all time high: 1,100.58 on 27th August 2018.
Current upwards movement is driven by large caps, which is a feature of an aged bull market.
DAILY CHART
Click chart to enlarge. Chart courtesy of StockCharts.com. So that colour blind members are included, bearish signals will be noted with blue and bullish signals with yellow.
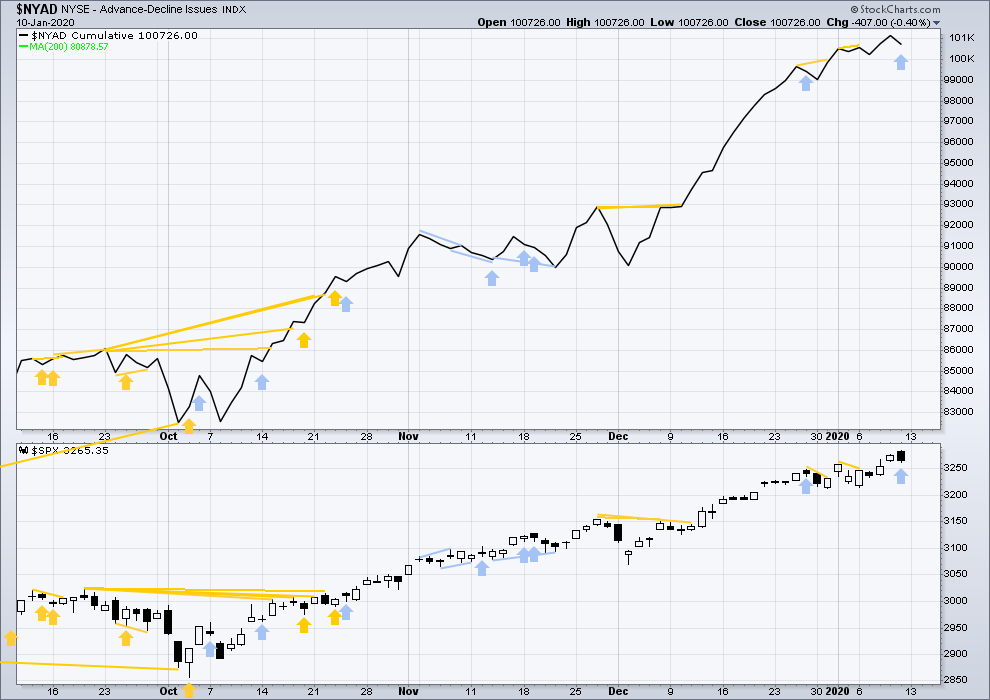
Breadth should be read as a leading indicator.
On Friday price has made a new all time high, but the AD line has not. This divergence is bearish but short term and weak.
Large caps have for the short term made new highs, but mid and small caps have not made new swing highs above prior highs of the 2nd of January. There is now short-term weakness developing.
VOLATILITY – INVERTED VIX CHART
WEEKLY CHART
Click chart to enlarge. Chart courtesy of StockCharts.com. So that colour blind members are included, bearish signals will be noted with blue and bullish signals with yellow.
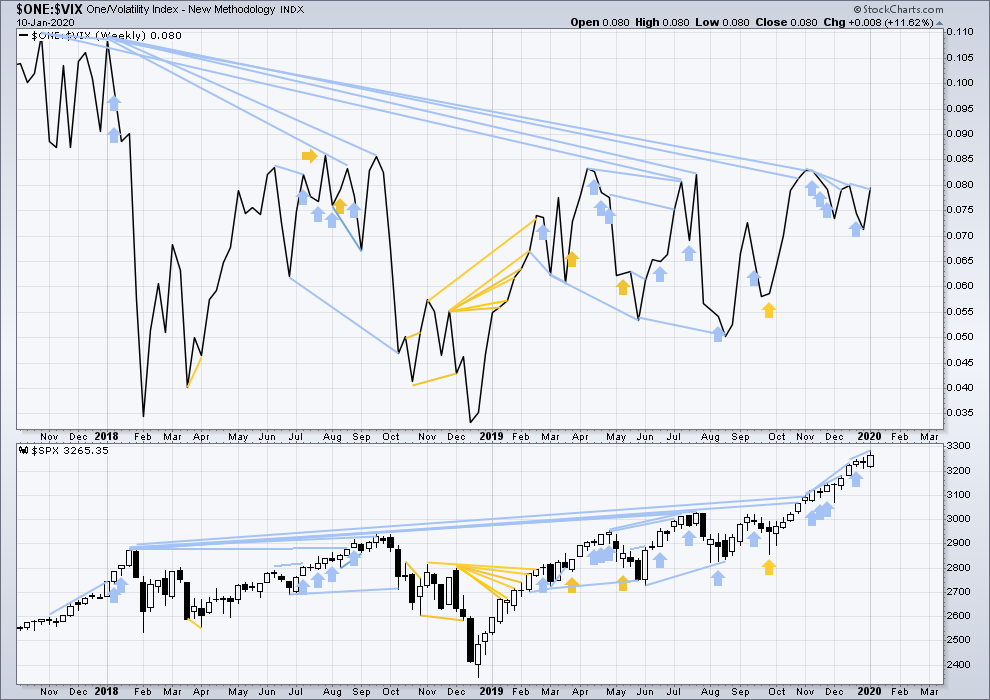
The all time high for inverted VIX was on 30th October 2017. There is now over two years of bearish divergence between price and inverted VIX.
The rise in price is not coming with a normal corresponding decline in VIX; VIX remains elevated. This long-term divergence is bearish and may yet develop further as the bull market matures.
This divergence may be an early warning, a part of the process of a top developing that may take years. It may is clearly not useful in timing a trend change from bull to a fully fledged bear market.
This week price and inverted VIX have both moved higher. Price is making new highs, but there remains all of short, mid and long-term bearish divergence with inverted VIX.
DAILY CHART
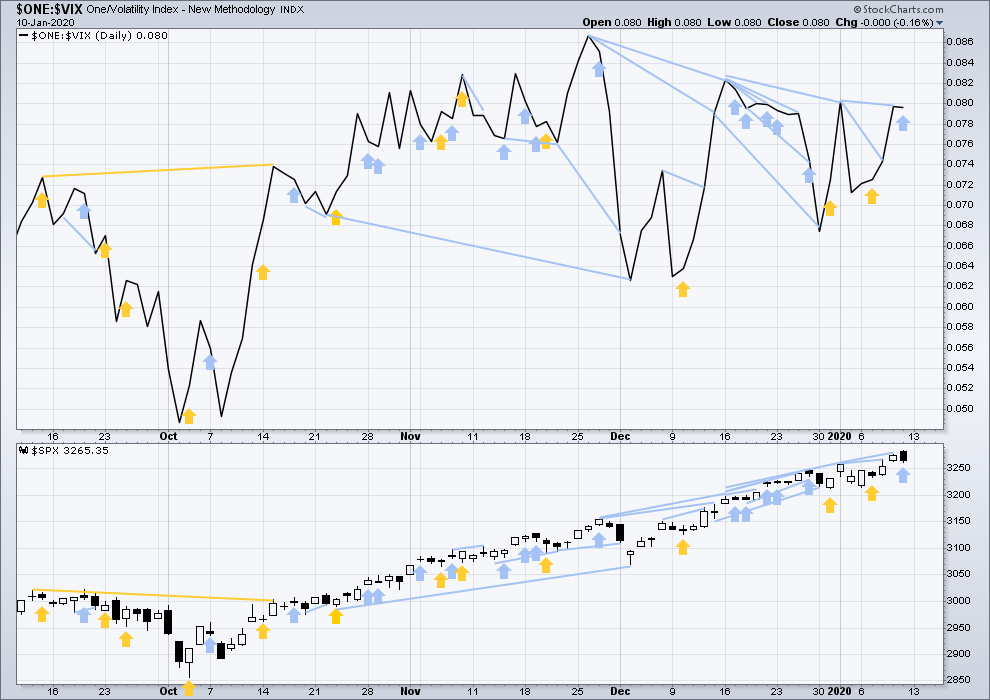
Click chart to enlarge. Chart courtesy of StockCharts.com. So that colour blind members are included, bearish signals will be noted with blue and bullish signals with yellow.
On Friday price has made a new high, but inverted VIX has moved lower. This divergence is bearish, but it is short term and weak.
DOW THEORY
Dow Theory confirmed a bear market in December 2018. This does not necessarily mean a bear market at Grand Super Cycle degree though; Dow Theory makes no comment on Elliott wave counts. On the 25th of August 2015 Dow Theory also confirmed a bear market. The Elliott wave count sees that as part of cycle wave II. After Dow Theory confirmation of a bear market in August 2015, price went on to make new all time highs and the bull market continued.
DJIA: 23,344.52 – a close on the 19th of December at 23,284.97 confirms a bear market.
DJT: 9,806.79 – price has closed below this point on the 13th of December.
S&P500: 2,532.69 – a close on the 19th of December at 2,506.96 provides support to a bear market conclusion.
Nasdaq: 6,630.67 – a close on the 19th of December at 6,618.86 provides support to a bear market conclusion.
With all the indices having moved higher following a Dow Theory bear market confirmation, Dow Theory would confirm a bull market if the following highs are made:
DJIA: 26,951.81 – a close above this point has been made on the 3rd of July 2019.
DJT: 11,623.58 – to date DJT has failed to confirm an ongoing bull market.
S&P500: 2,940.91 – a close above this point was made on the 29th of April 2019.
Nasdaq: 8,133.30 – a close above this point was made on the 26th of April 2019.
GOLD
Two of the three Elliott wave counts, including the preferred wave count, expected a consolidation had begun. An inside day fits this expectation.
Summary: A consolidation to last either a Fibonacci 5 or 8 sessions and find support about the lower edge of the adjusted Elliott channel on daily charts is expected to have begun. Thereafter, more upwards movement may be a final thrust before a bear market resumes.
A bullish wave count expects a third wave is ending here or very soon. The target is 1,635 or 1,693.
An alternate bearish wave count looks at the possibility that Gold has just seen a Super Cycle degree trend change. Confidence in this idea may be had with a new low below 1,473.36. Full and final confidence would be had if price makes a new low below 1,374.91.
Grand SuperCycle analysis is here.
Monthly charts were last updated here.
BEARISH ELLIOTT WAVE COUNT
WEEKLY CHART
Click chart to enlarge.
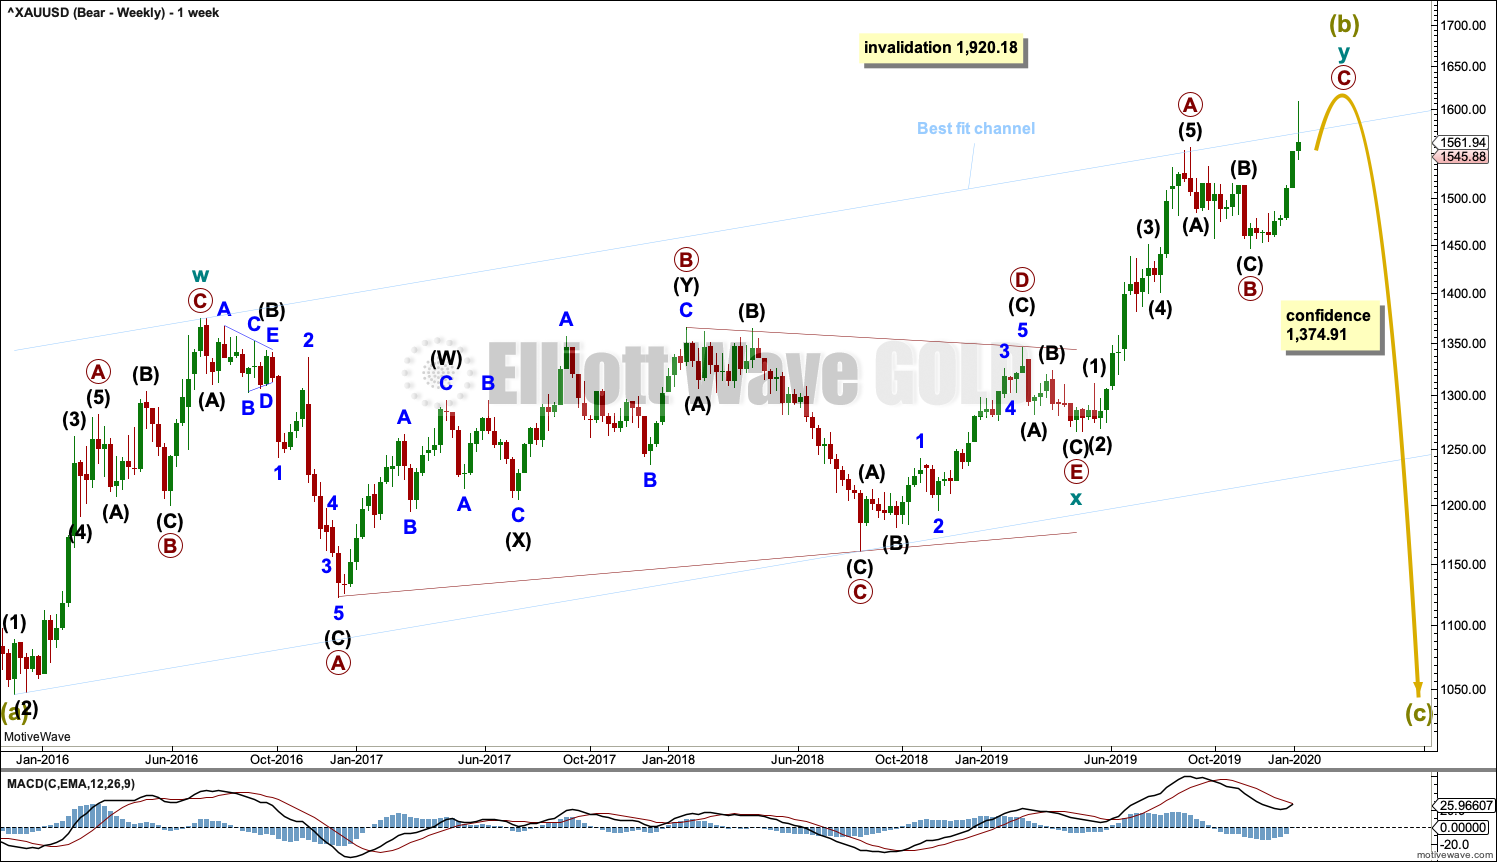
Super Cycle wave (b) may still be an incomplete double zigzag, requiring one more high.
The first zigzag in the double is labelled cycle wave w. The double is joined by a three in the opposite direction, a triangle labelled cycle wave x. The second zigzag in the double is labelled cycle wave y.
The purpose of the second zigzag in a double is to deepen the correction. Cycle wave y has achieved this purpose.
After the structure of cycle wave y may be complete, then a new low below 1,374.91 would add strong confidence to this wave count. At that stage, the bullish Elliott wave count would be invalidated. At that stage, targets for Super Cycle wave (c) would be calculated.
A wide best fit channel is added in light blue. Copy this channel over to daily charts. The upper edge of this channel was breached, but now price has returned strongly to within the channel.
DAILY CHART
Click chart to enlarge.
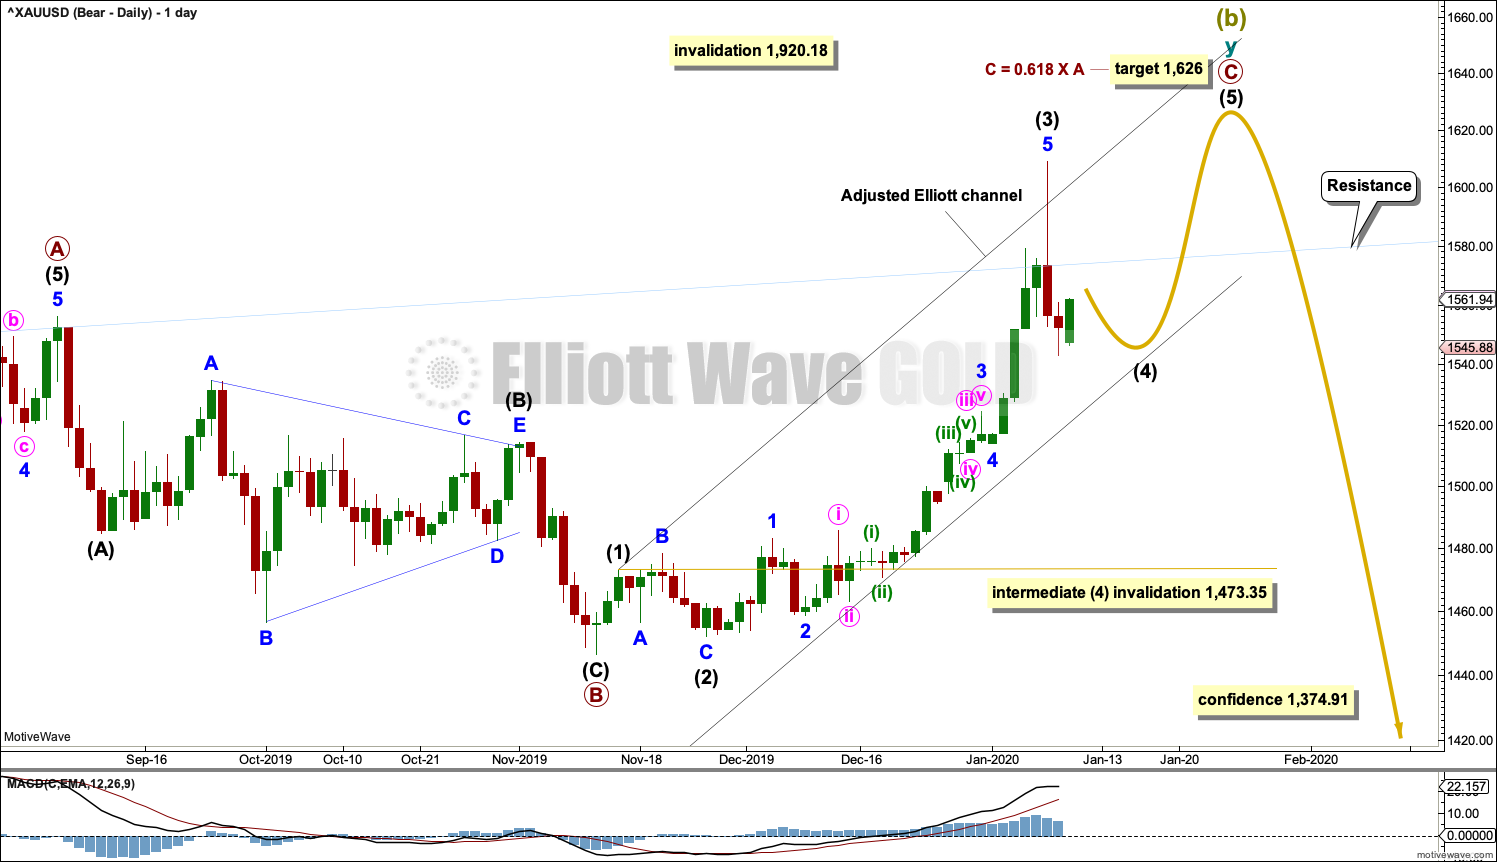
The double zigzag for Super Cycle wave (b) may be still incomplete.
Within cycle wave y, primary waves A and B are complete. Primary wave C must complete as a five wave structure. It is unfolding as an impulse. Within the impulse, intermediate waves (1) to (3) may now be complete.
Intermediate wave (2) was a deep 0.79 zigzag, which lasted 8 sessions. Given the guideline of alternation, intermediate wave (4) would least likely unfold as a zigzag and most likely unfold as either a flat, combination or triangle. Intermediate wave (4) would most likely be shallow. It may last about a Fibonacci 5 or 8 sessions. So far it would have lasted 2 sessions.
Intermediate wave (4) may not move into intermediate wave (1) price territory below 1,473.35.
Drawn an Elliott channel about primary wave C and then pull the lower edge down to contain all of primary wave C. The lower edge may provide support to intermediate wave (4).
ALTERNATE DAILY CHART
Click chart to enlarge.
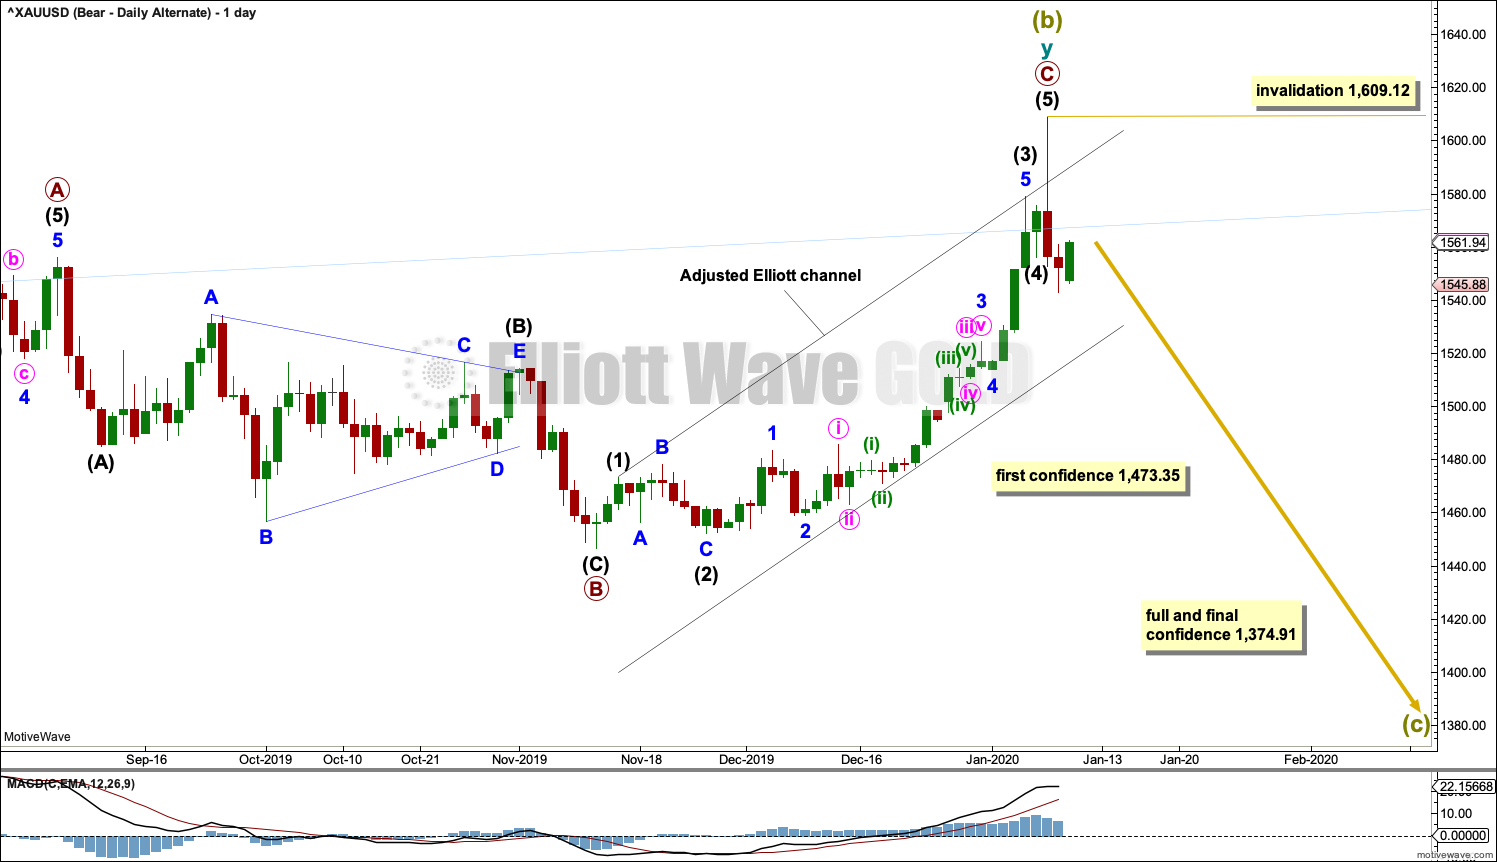
Alternatively, it is possible again that Super Cycle wave (b) may be complete and the bear market for Gold may have resumed.
A new low below 1,473.35 would invalidate the main bearish wave count and add some confidence in this alternate. Thereafter, a new low by any amount at any time frame below 1,374.91 would invalidate the bullish wave count below and add full and final confidence in this wave count. Targets for Super Cycle wave (c) would be calculated at that stage.
If Super Cycle wave (c) has begun, then it should develop a five wave structure downwards at the daily and weekly time frames. Within the first five down, no second wave correction may move beyond the start of its first wave above 1,609.12.
BULLISH ELLIOTT WAVE COUNT
WEEKLY CHART
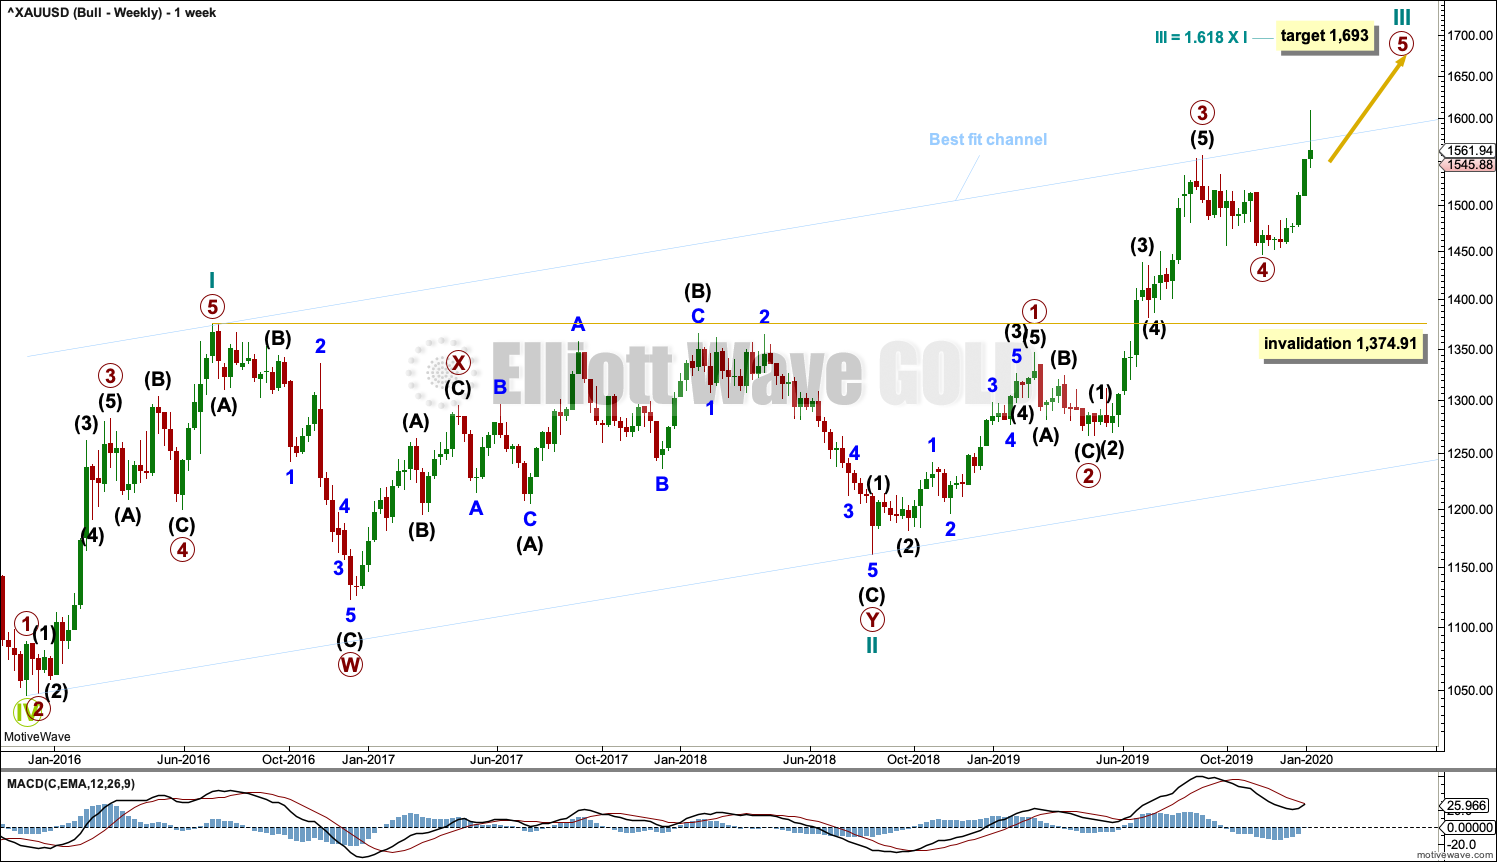
Click chart to enlarge.
This wave count sees the the bear market complete at the last major low for Gold in November 2015.
If Gold is in a new bull market, then it should begin with a five wave structure upwards on the weekly chart. However, the biggest problem with this wave count is the structure labelled cycle wave I because this wave count must see it as a five wave structure, but it looks more like a three wave structure.
Commodities often exhibit swift strong fifth waves that force the fourth wave corrections coming just prior and just after to be more brief and shallow than their counterpart second waves. It is unusual for a commodity to exhibit a quick second wave and a more time consuming fourth wave, and this is how cycle wave I is labelled. This wave count still suffers from this very substantial problem, which is one reason why the bearish wave count is preferred because it has a better fit in terms of Elliott wave structure.
Cycle wave II subdivides well as a double combination: zigzag – X – expanded flat.
Cycle wave III may have begun. Within cycle wave III, primary waves 1 through to 4 may now be complete. Primary wave 5 may be complete at any stage now; this would complete the whole structure of cycle wave III. Cycle wave IV may not move into cycle wave I price territory below 1,374.91.
Add the wide best fit channel to weekly and daily charts.
DAILY CHART
Click chart to enlarge.
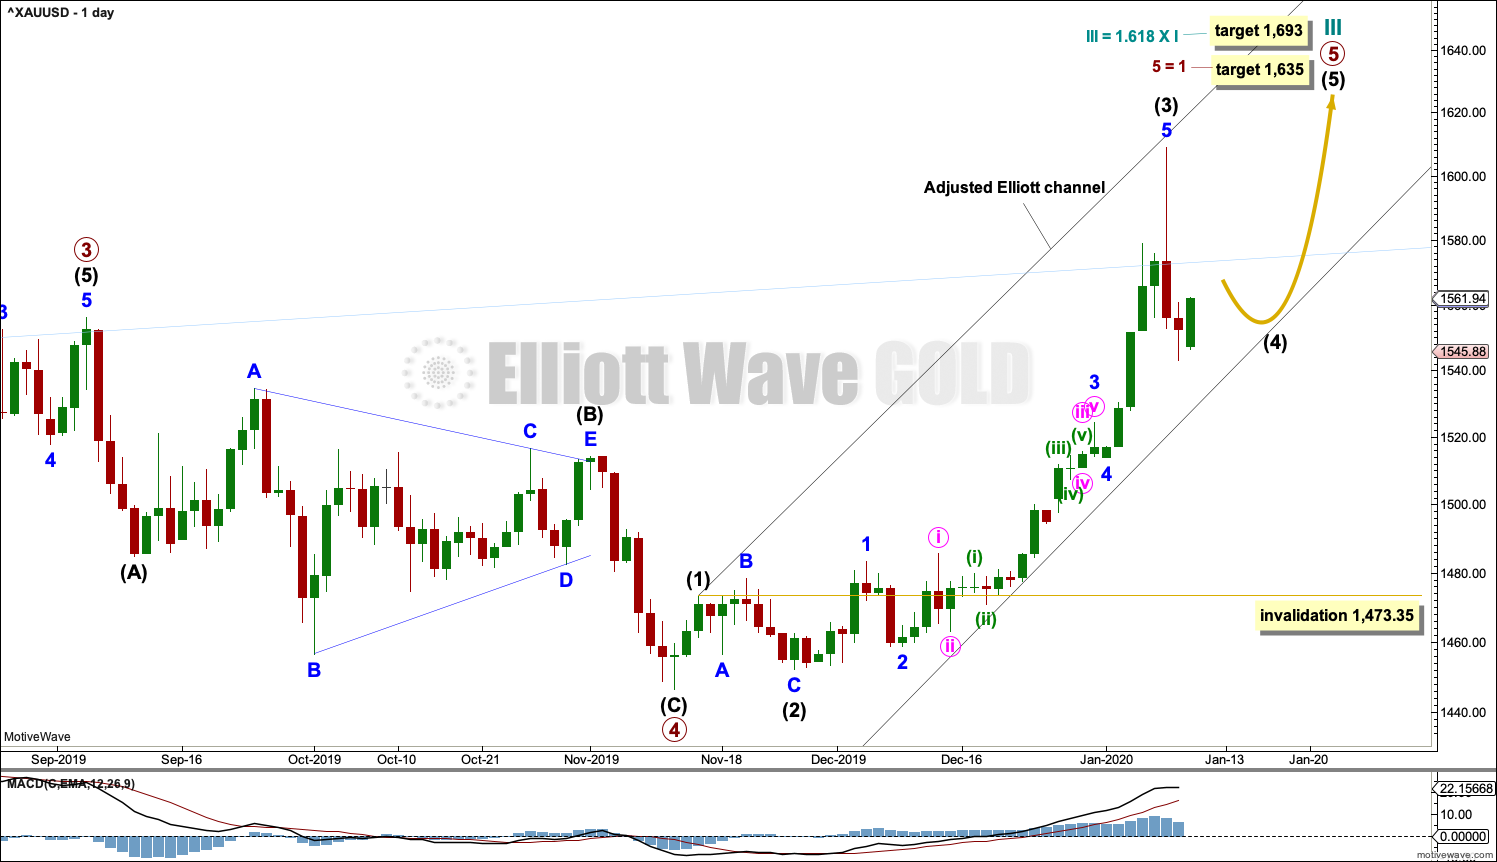
A target for cycle wave III is calculated also now at primary degree. If price reaches the first target and keeps rising, then the second higher target may be used.
Primary wave 5 may only subdivide as a five wave structure, most likely an impulse. Within primary wave 5, intermediate waves (1) through to (3) may now be complete. Intermediate wave (4) may not move into intermediate wave (1) price territory below 1,473.35.
Draw an adjusted Elliott channel about primary wave 5. Intermediate wave (4) may find support at the lower edge.
This wave count for the next few weeks remains essentially the same as the main bearish wave count. Both wave counts are seeing a fourth wave unfold, to then be followed by a final fifth wave up.
TECHNICAL ANALYSIS
WEEKLY CHART
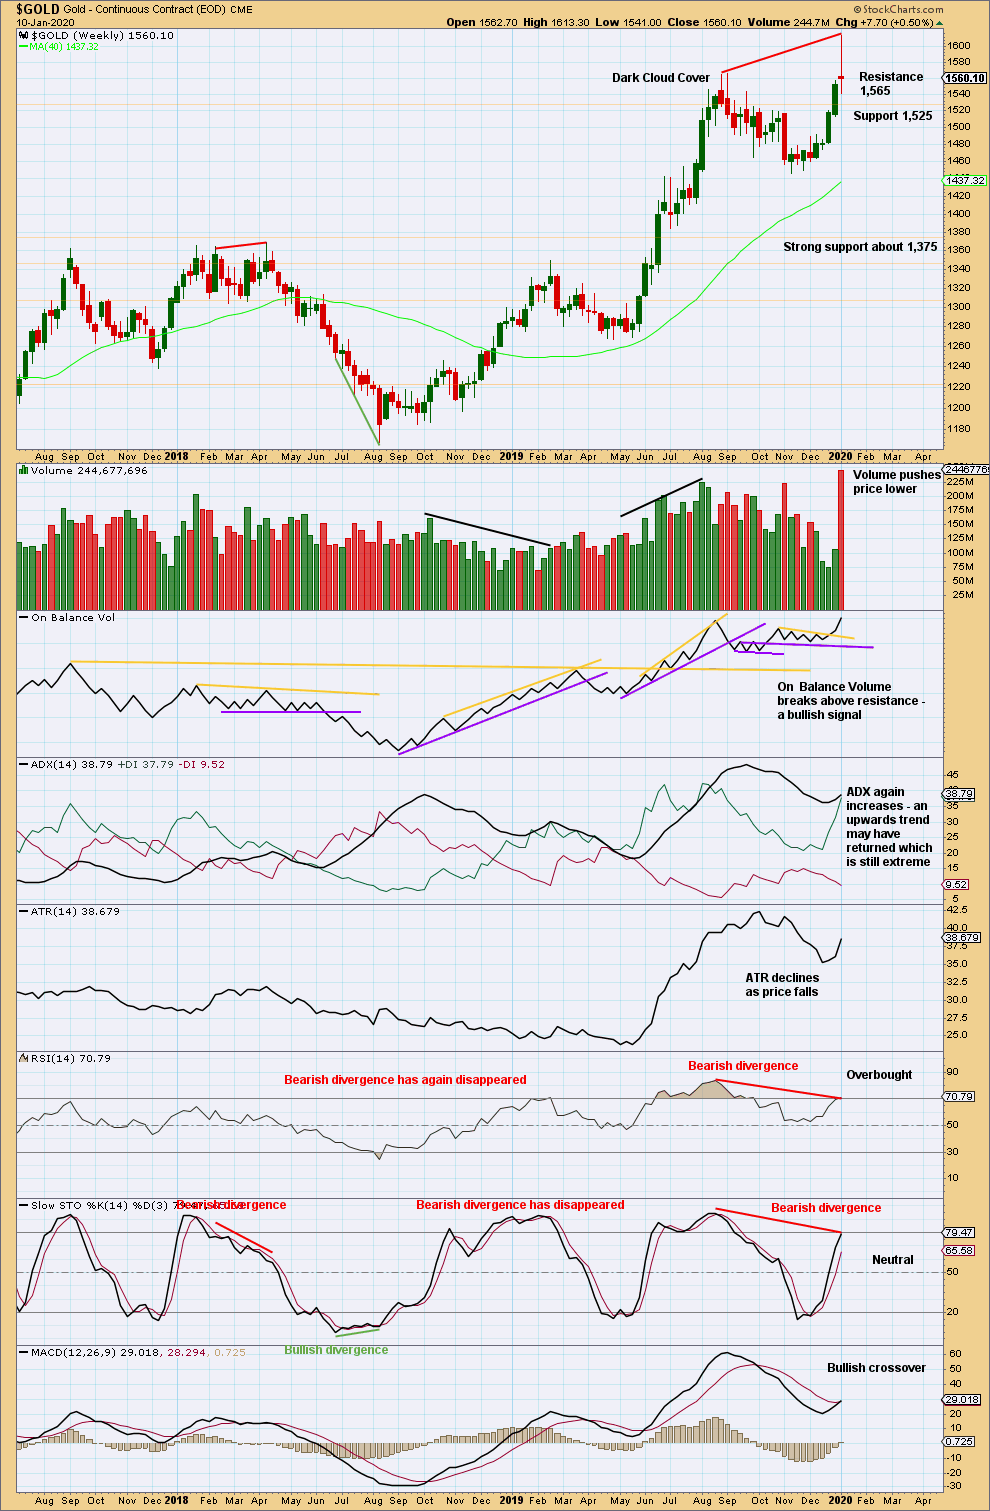
Click chart to enlarge. Chart courtesy of StockCharts.com.
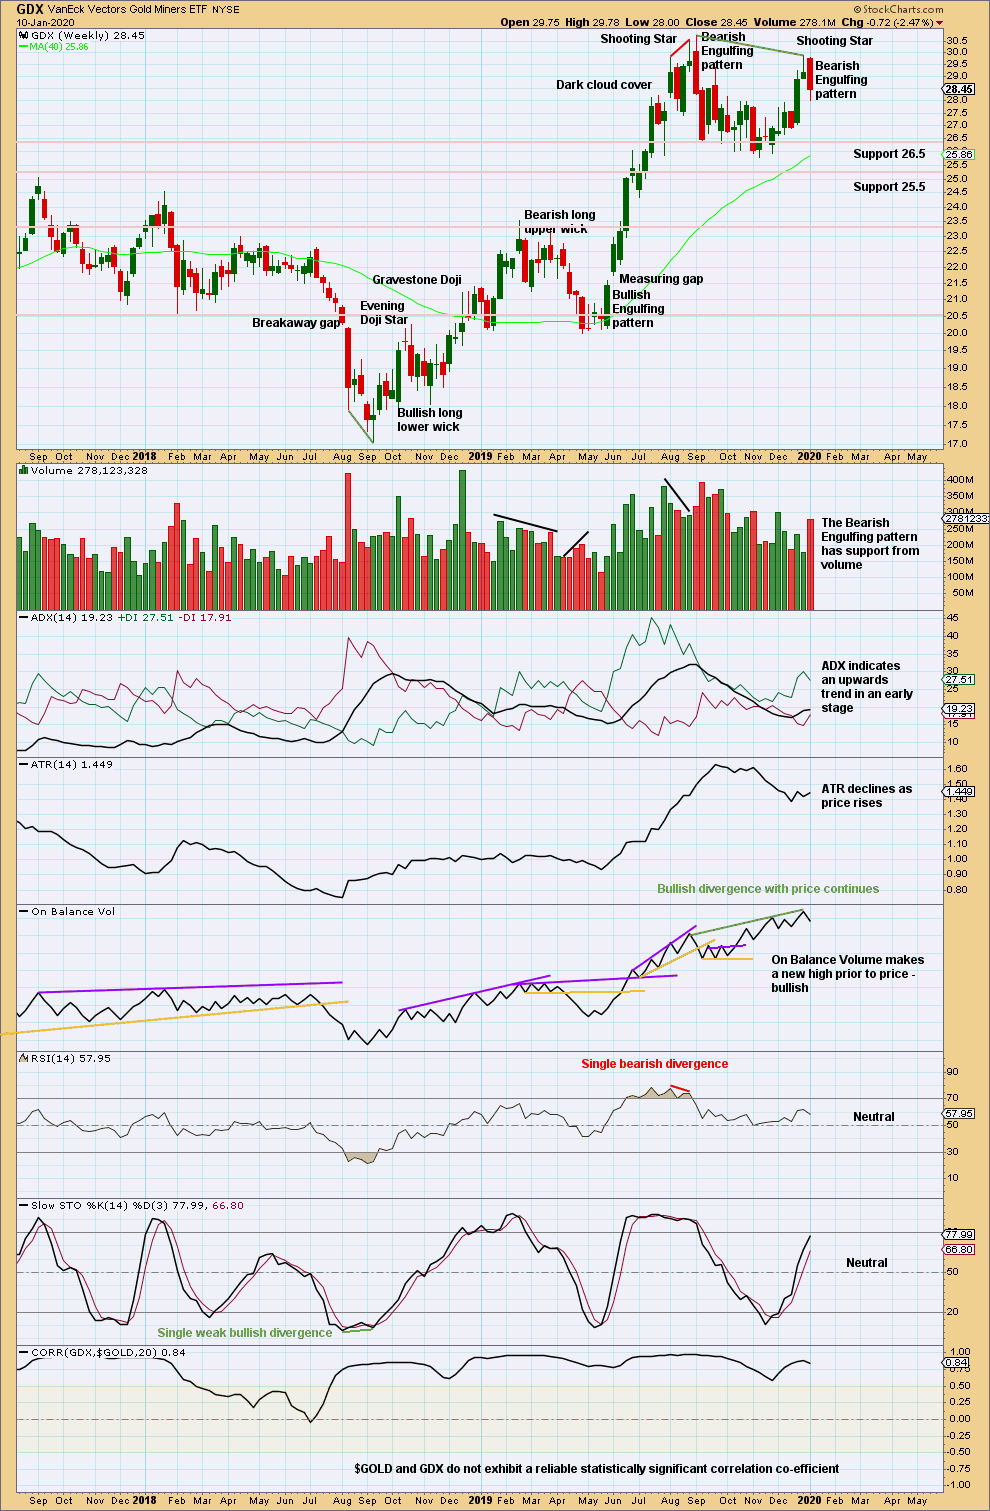
This last completed weekly candlestick is bearish. With the upwards trend now extreme, a trend change may have occurred this week or will occur very soon.
To judge the volume profile this week daily volume bars are best analysed.
DAILY CHART
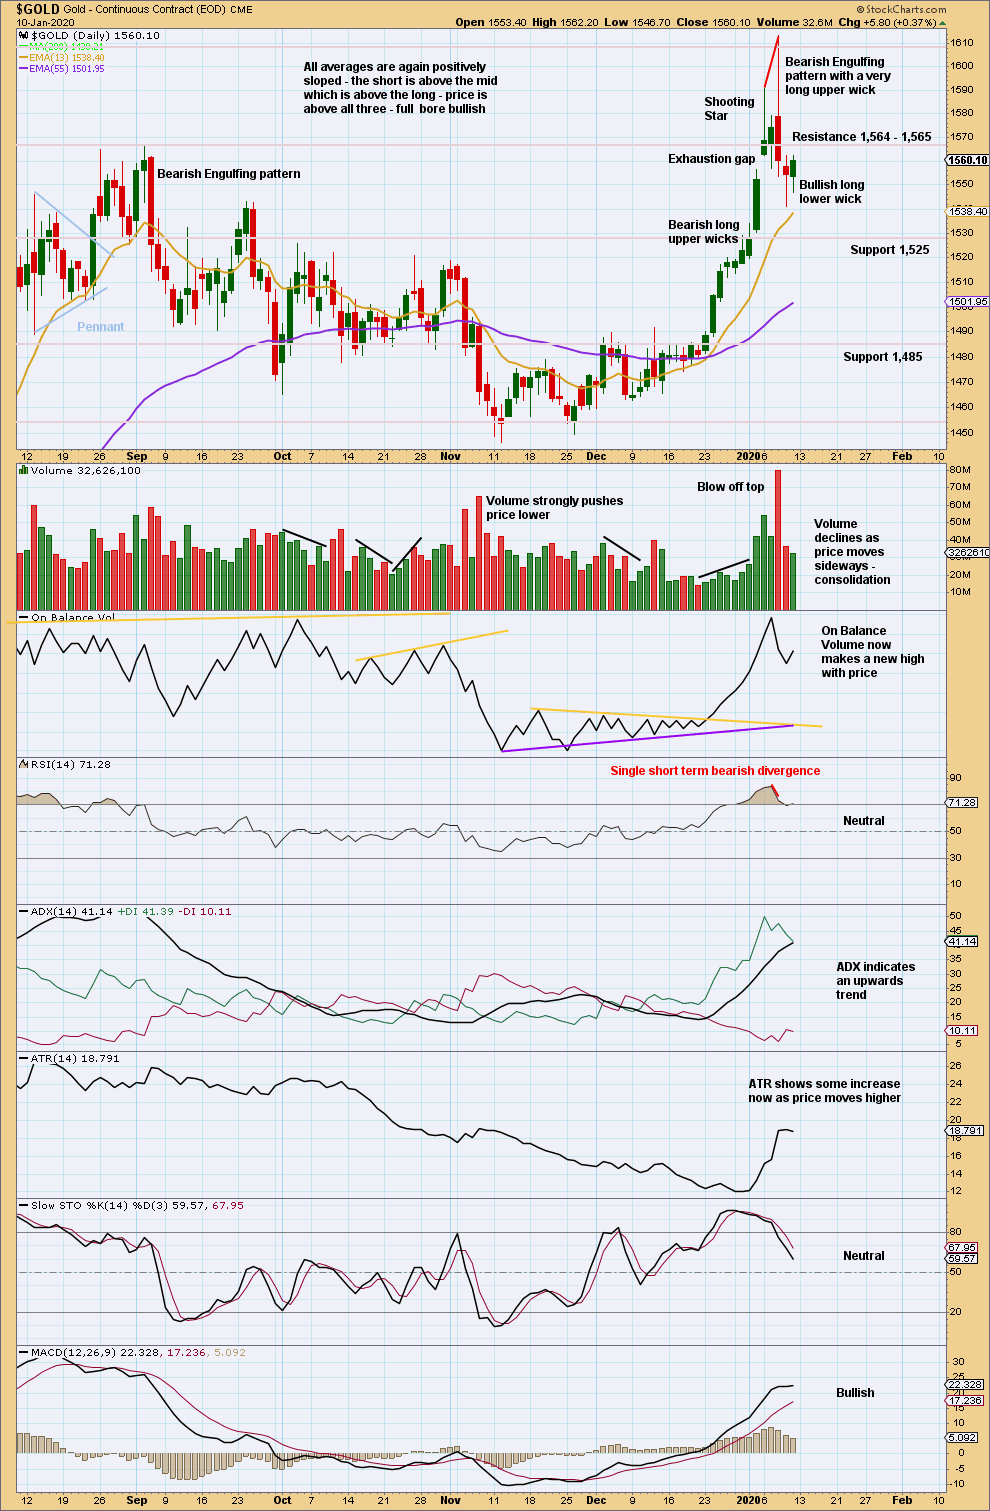
Click chart to enlarge. Chart courtesy of StockCharts.com.
The last Bearish Engulfing pattern has strong support from volume, which increases the bearish implications. Expect a trend change to either down or sideways.
GDX WEEKLY CHART
Click chart to enlarge. Chart courtesy of StockCharts.com.
Now two bearish candlestick patterns in a row, the second with support from volume, strongly suggest a trend change here to either down or sideways.
GDX DAILY CHART
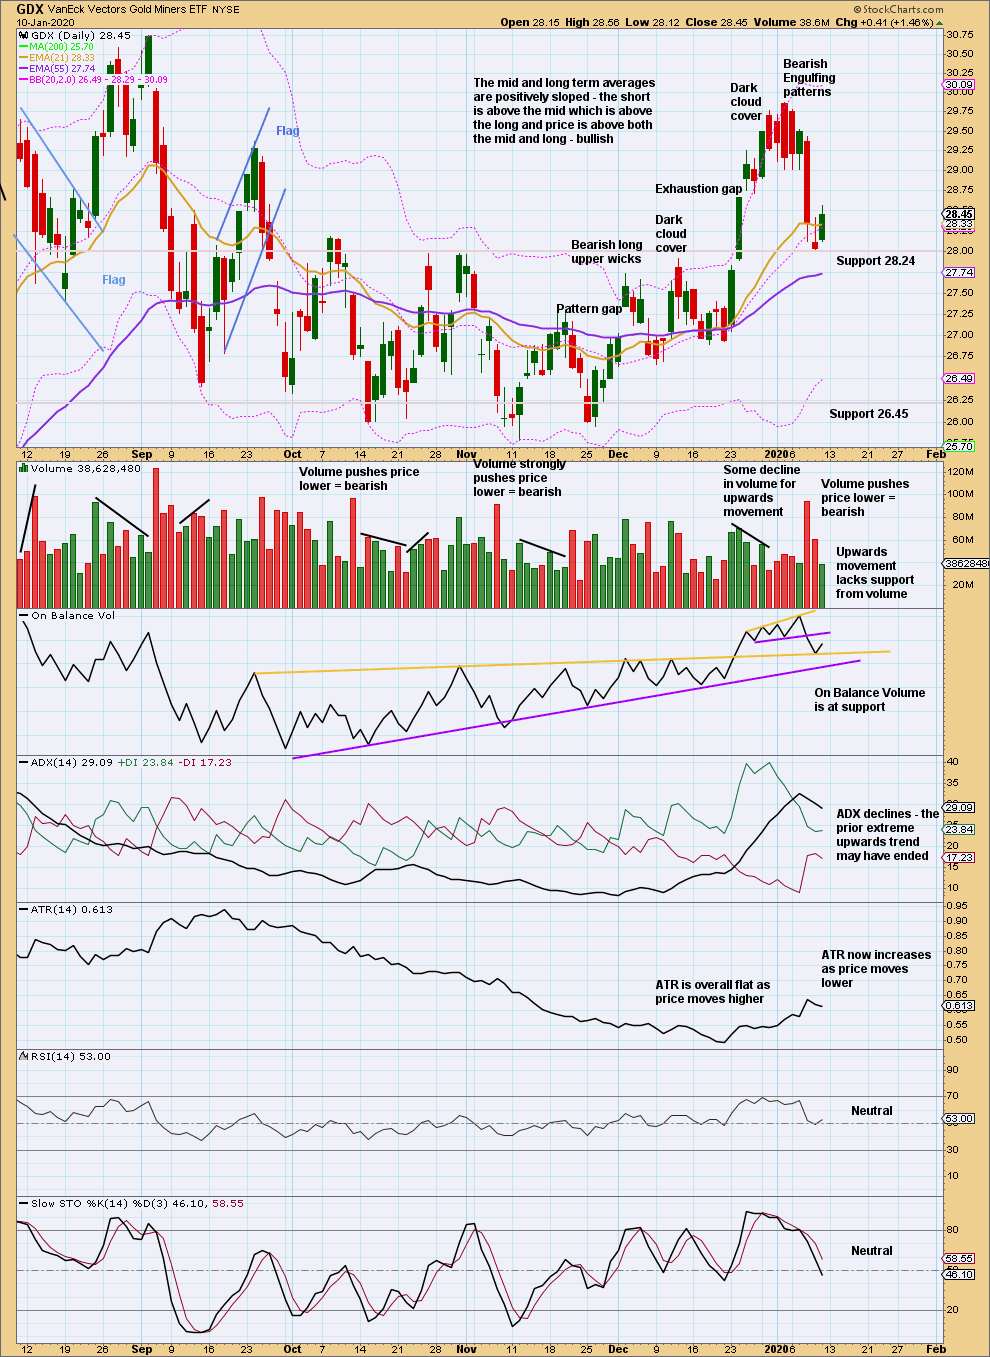
Click chart to enlarge. Chart courtesy of StockCharts.com.
A very strong bearish candlestick after an extreme upwards trend, along with closure of the last gap (now renamed an exhaustion gap) and now two bearish signals from On Balance Volume and volume supporting downwards movement and not upwards, strongly suggest GDX has found a high.
US OIL
Last week both Elliott wave counts expected downwards movement for Oil. An outside week has closed strongly lower, overall meeting expectations.
Summary: Both the bullish and bearish Elliott wave counts now expect downwards movement. Targets are either 48.81 or 44.61.
MAIN ELLIOTT WAVE COUNT – BEARISH
MONTHLY CHART
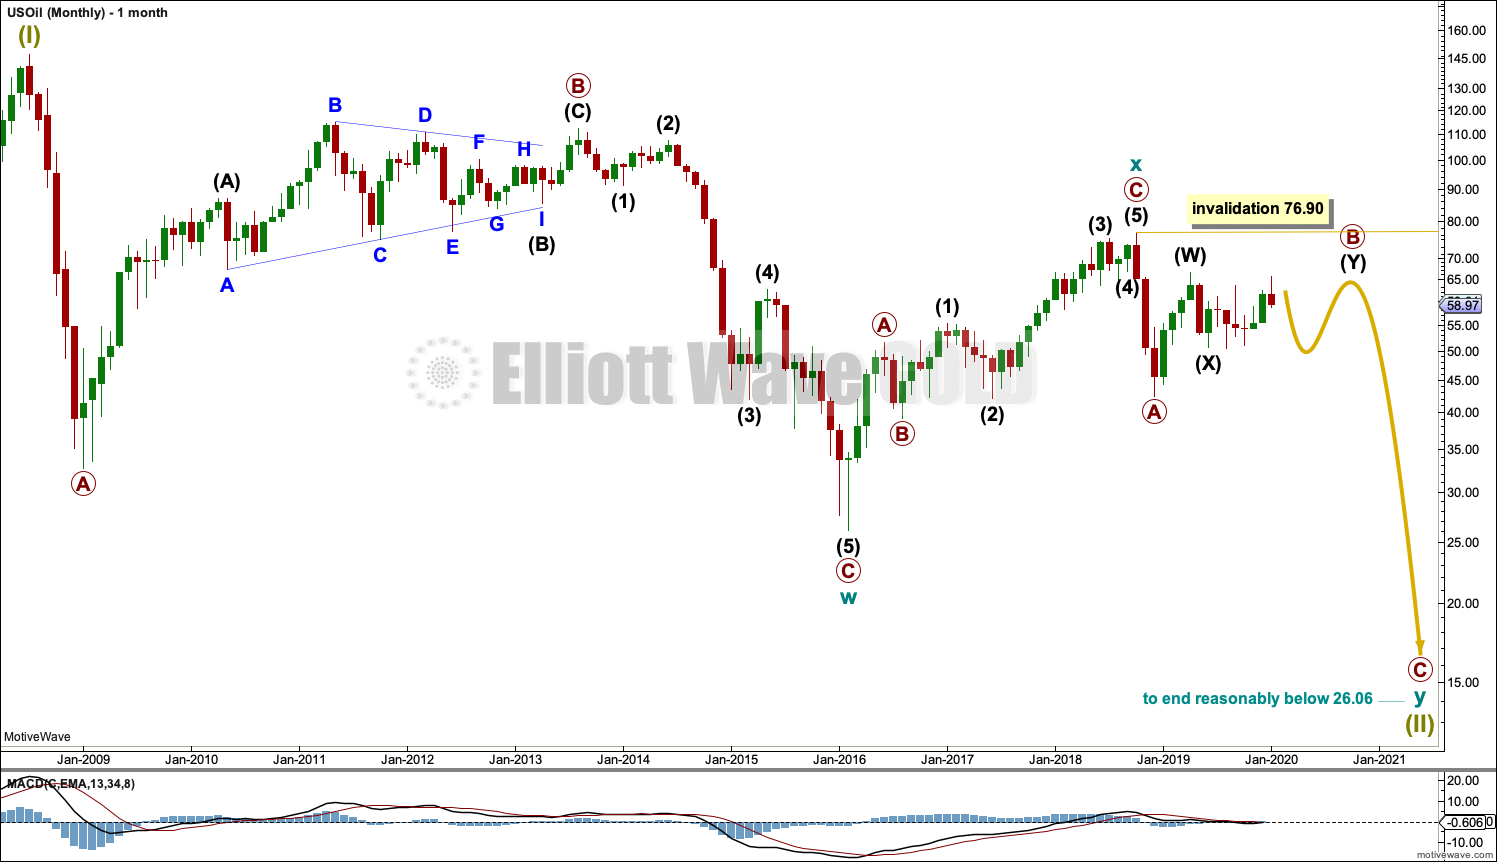
Click chart to enlarge.
The basic Elliott wave structure is five steps forward and three steps back. This Elliott wave count expects that US Oil is still within a three steps back pattern, which began in July 2008. The Elliott wave count expects that the bear market for US Oil continues.
This Elliott wave corrective structure is a double zigzag, which is a fairly common structure. The correction is labelled Super Cycle wave (II).
The first zigzag in the double is complete and labelled cycle wave w. The double is joined by a three in the opposite direction labelled cycle wave x, which subdivides as a zigzag. The second zigzag in the double may now have begun, labelled cycle wave y.
The purpose of a second zigzag in a double zigzag is to deepen the correction when the first zigzag does not move price deep enough. To achieve this purpose cycle wave y may be expected to move reasonably below the end of cycle wave w at 26.06. When primary wave B may be complete then the start of primary wave C may be known and a target may be calculated.
Cycle wave y is expected to subdivide as a zigzag, which subdivides 5-3-5.
Cycle wave w lasted 7.6 years and cycle wave x lasted 2.7 years. Cycle wave y may be expected to last possibly about a Fibonacci 5 or 8 years.
Primary wave B may not move beyond the start of primary wave A above 76.90.
WEEKLY CHART
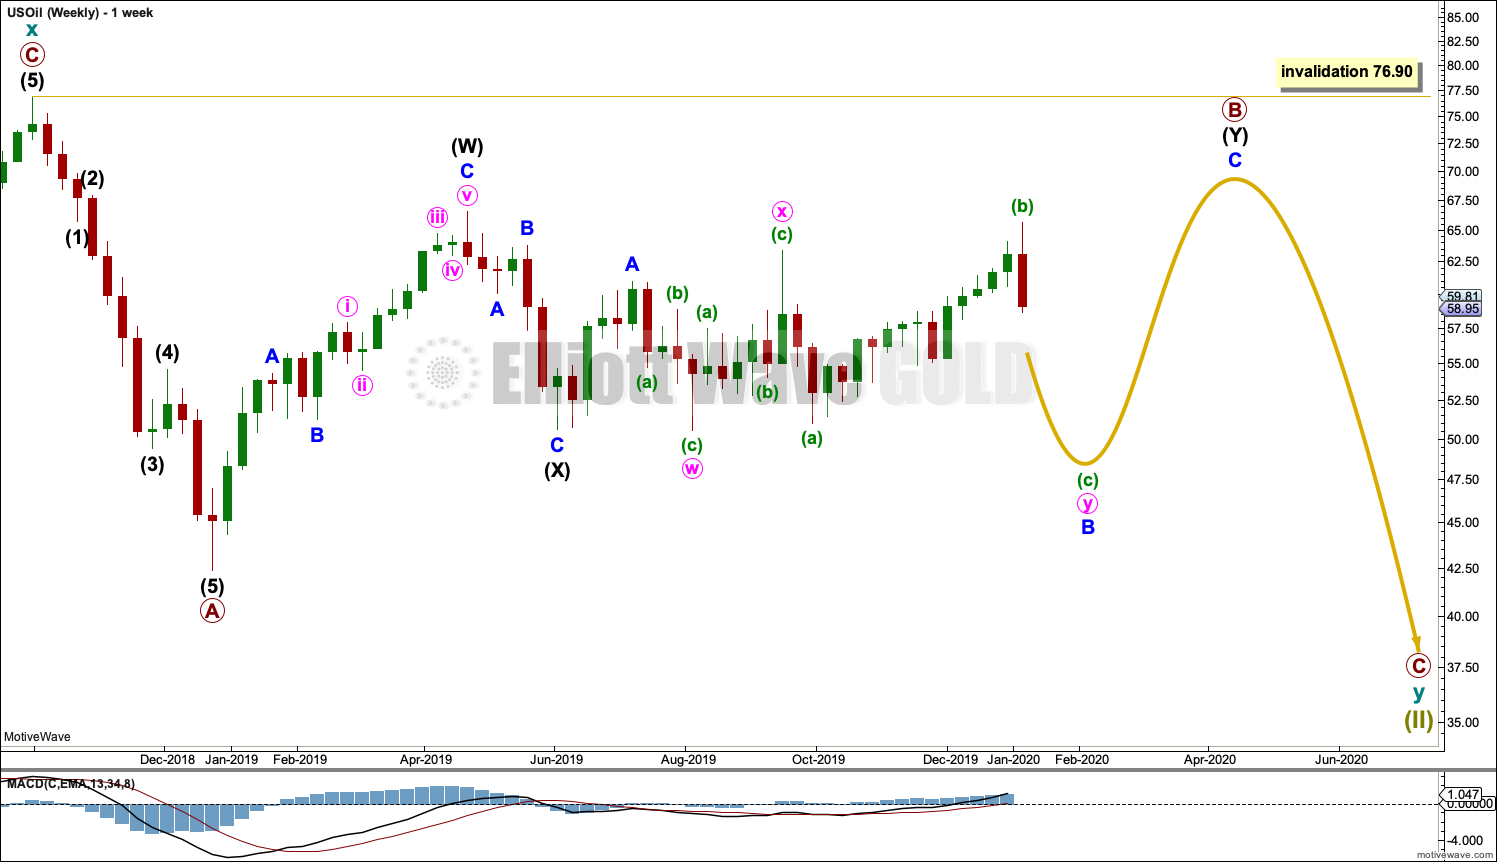
Click chart to enlarge.
This weekly chart shows all of cycle wave y so far.
Cycle wave y is expected to subdivide as a zigzag. A zigzag subdivides 5-3-5. Primary wave A must subdivide as a five wave structure if this wave count is correct.
Primary wave A may be a complete five wave impulse at the last low.
Primary wave B may be a double combination: zigzag – X – flat. Intermediate wave (W) fits as a zigzag. Intermediate wave (Y) may be unfolding as a flat correction.
Within intermediate wave (Y), minor wave A may be complete. Minor wave B may be an incomplete double combination.
When primary wave B may be complete, then a downwards breakout would be expected for primary wave C.
Primary wave B may not move beyond the start of primary wave A above 76.90.
DAILY CHART
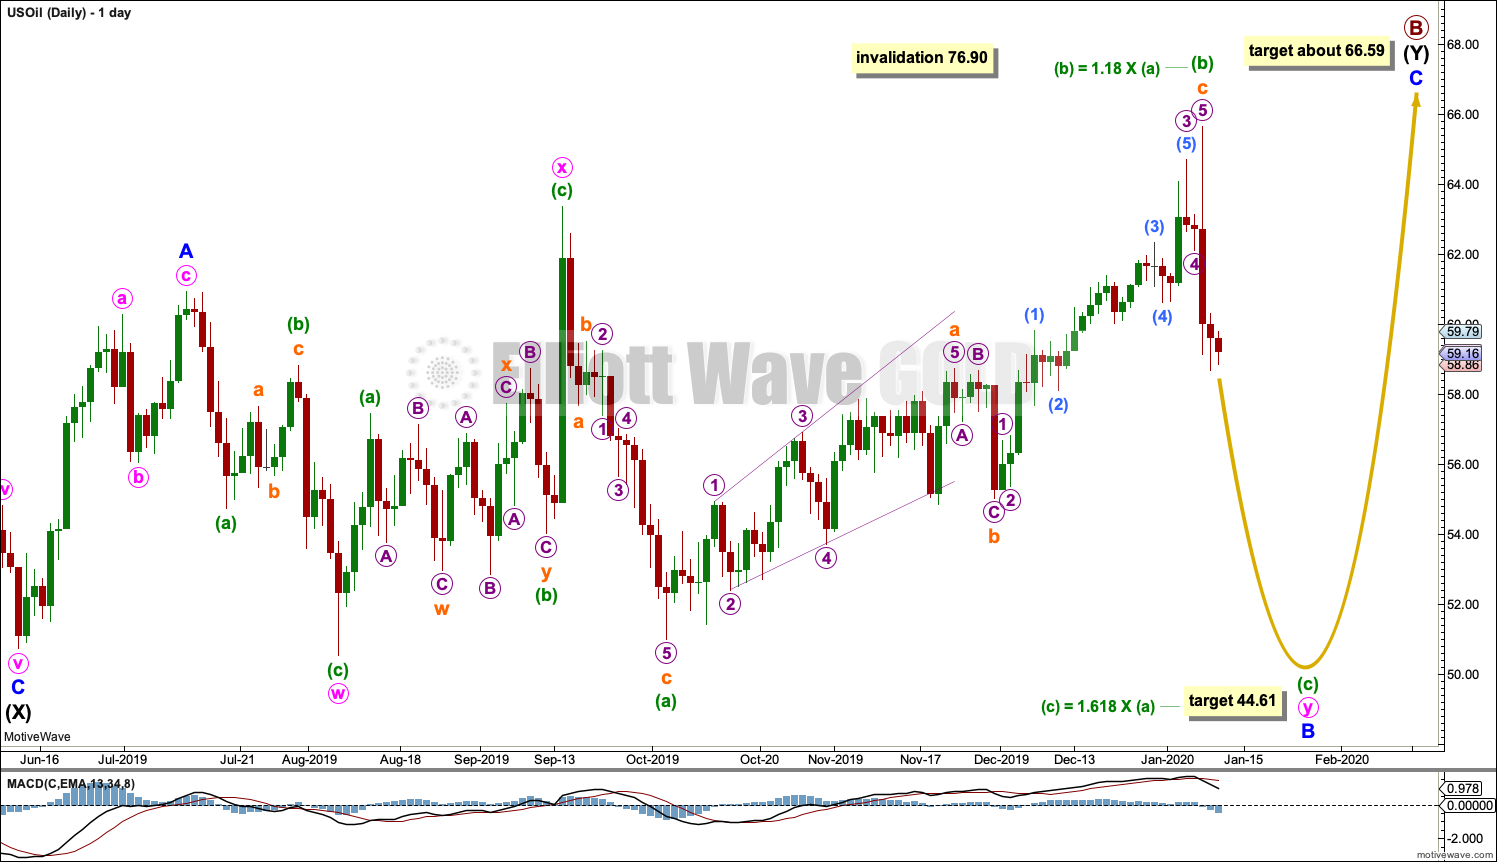
Click chart to enlarge.
This daily chart shows all of intermediate wave (Y) so far.
Intermediate wave (Y) may be subdividing as a flat correction. Within the flat, minor wave A subdivides as a three and minor wave B may be an incomplete three. At its end, minor wave B must retrace a minimum 0.9 of minor wave A at 51.74.
Minor wave B may be subdividing as a double combination: zigzag – X – flat. Within the flat correction of minute wave y, minuette wave (b) has now retraced the minimum requirement of 0.9 the length of minuette wave (a); minuette wave (b) has continued a little higher this week and is still within the common range of 1 – 1.38 times the length of minuette wave (a). Minuette wave (c) should now move at least slightly below the end of minuette wave (a) at 51.00 to avoid a truncation and a very rare running flat. The target calculated expects a common Fibonacci ratio to minuette wave (a).
When minor wave B may be complete, then minor wave C should move higher to end above the end of minor wave A at 60.93.
This wave count now expects the consolidation that Oil has been in for some months now may continue for several more weeks. An upwards swing may be complete and a downwards swing may develop from here.
ALTERNATE ELLIOTT WAVE COUNT
MONTHLY CHART
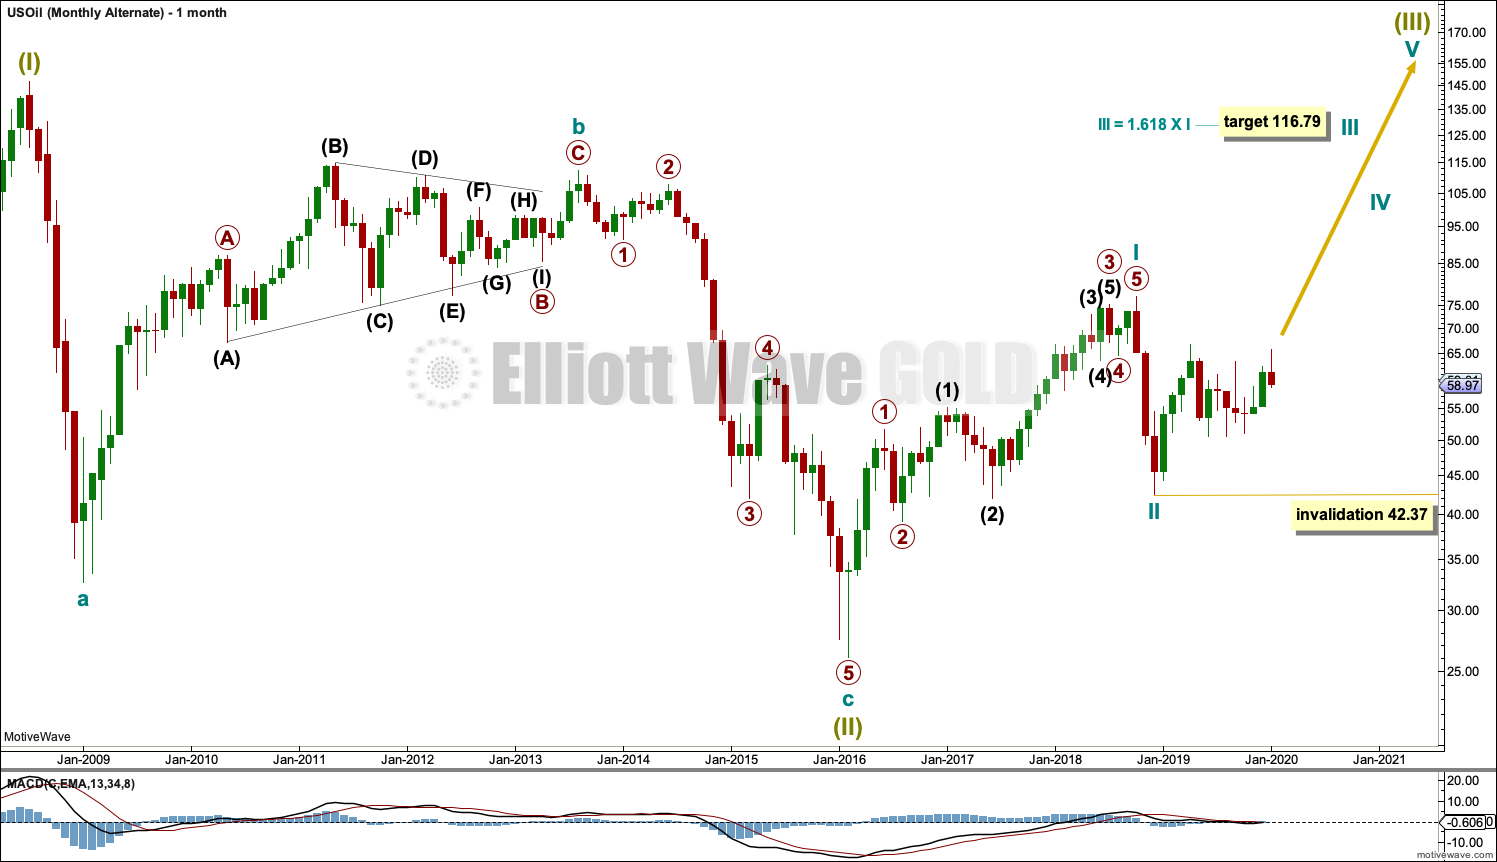
Click chart to enlarge.
It is possible that the bear market is over for Oil and a new bull market has begun.
For a bullish wave count for Oil, the upwards wave from the major low at 26.06 in February 2016 must be seen as a complete five wave impulse. This is labelled cycle wave I.
Cycle wave II may be a complete zigzag at 0.679 the depth of cycle wave I.
A target is calculated for cycle wave III to reach a common Fibonacci ratio to cycle wave I.
Within cycle wave III, no second wave correction may move beyond the start of its first wave below 42.37.
WEEKLY CHART

Click chart to enlarge.
Cycle wave II does look best as a three. This is the only part of this wave count that has a better look than the main wave count, which sees this downwards wave as a five.
The upwards wave of primary wave 1 within cycle wave III must be seen as a five wave structure for a bullish wave count to work. This movement at lower time frames does not subdivide well as a five; this reduces the probability of this wave count.
Cycle wave III may only subdivide as an impulse. Within cycle wave III, so far primary wave 1 may be complete. Primary wave 2 may be moving sideways as a double combination. Primary wave 2 may not move beyond the start of primary wave 1 below 42.37.
Primary wave 2 may be continuing as a double combination.
The first structure in the double would be complete, a zigzag labelled intermediate wave (W). Within intermediate wave (W), minor wave C ends with a slight truncation for minute wave v. This is acceptable.
The double may be now joined by a complete three in the opposite direction, a zigzag labelled intermediate wave (X).
Intermediate wave (Y) may now be completing as an expanded flat correction.
DAILY CHART
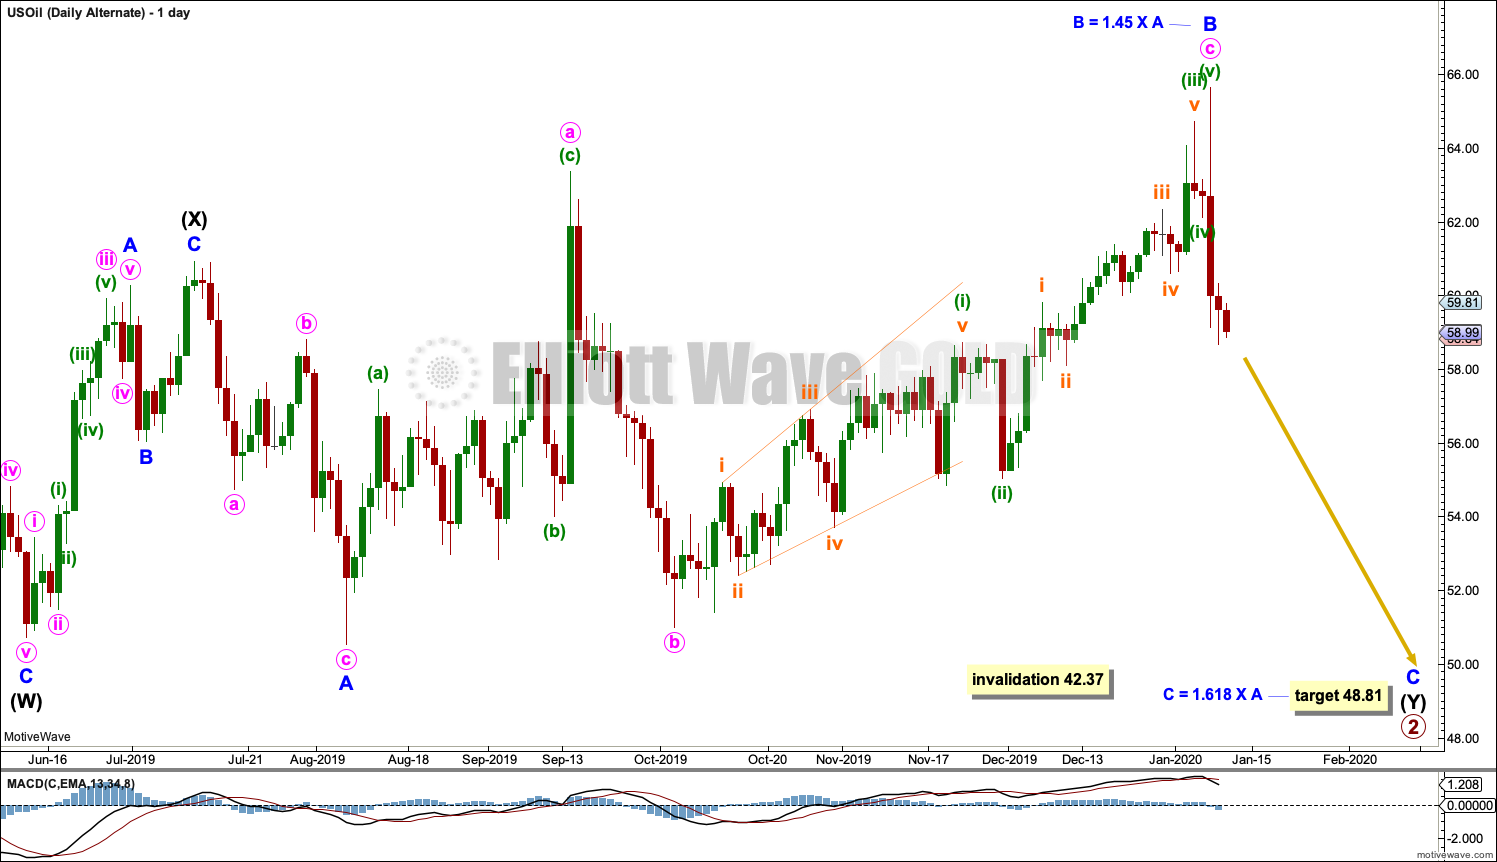
Click chart to enlarge.
Intermediate wave (Y) may be unfolding as an expanded flat correction. Within the expanded flat, minor wave A subdivides as a three and minor wave B may now be a complete three that is just beyond the normal range of 1 to 1.38 times the length of minor wave A. This is still acceptable. The wave count remains valid.
A target is calculated for minor wave C that expects a common Fibonacci ratio to minor wave A. Minor wave C would be likely to make at least a slight new low below the end of minor wave A at 50.53 to avoid a truncation and a very rare running flat.
Primary wave 2 may not move beyond the start of primary wave 1 below 42.37.
TECHNICAL ANALYSIS
MONTHLY CHART
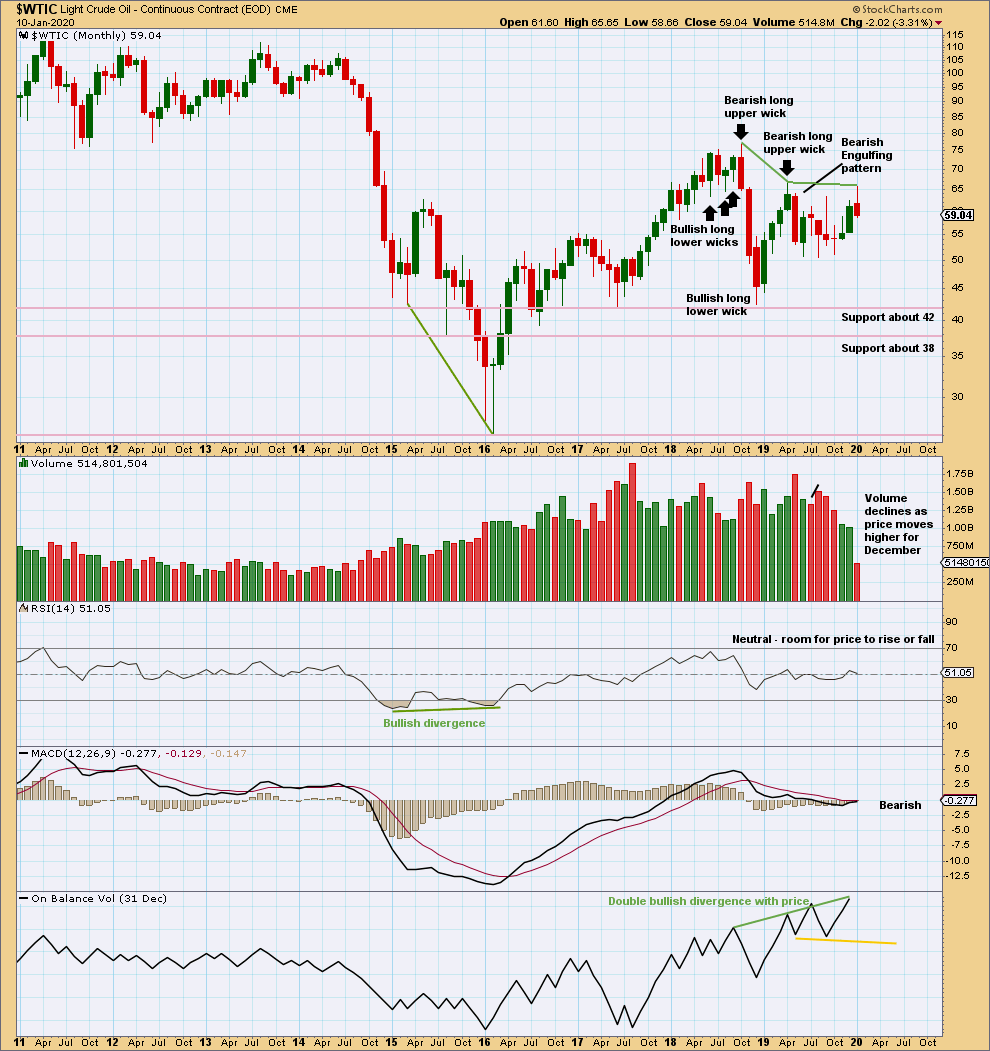
Click chart to enlarge. Chart courtesy of StockCharts.com.
There is now double bullish divergence between price and On Balance Volume. This supports the alternate Elliott wave count.
Overall, price has been moving sideways for a few months now. Within this sideways movement, the downwards month of May has greatest range and volume; this supports the main Elliott wave count. The last completed month of December 2019 closes within the range and lacks support from volume.
WEEKLY CHART
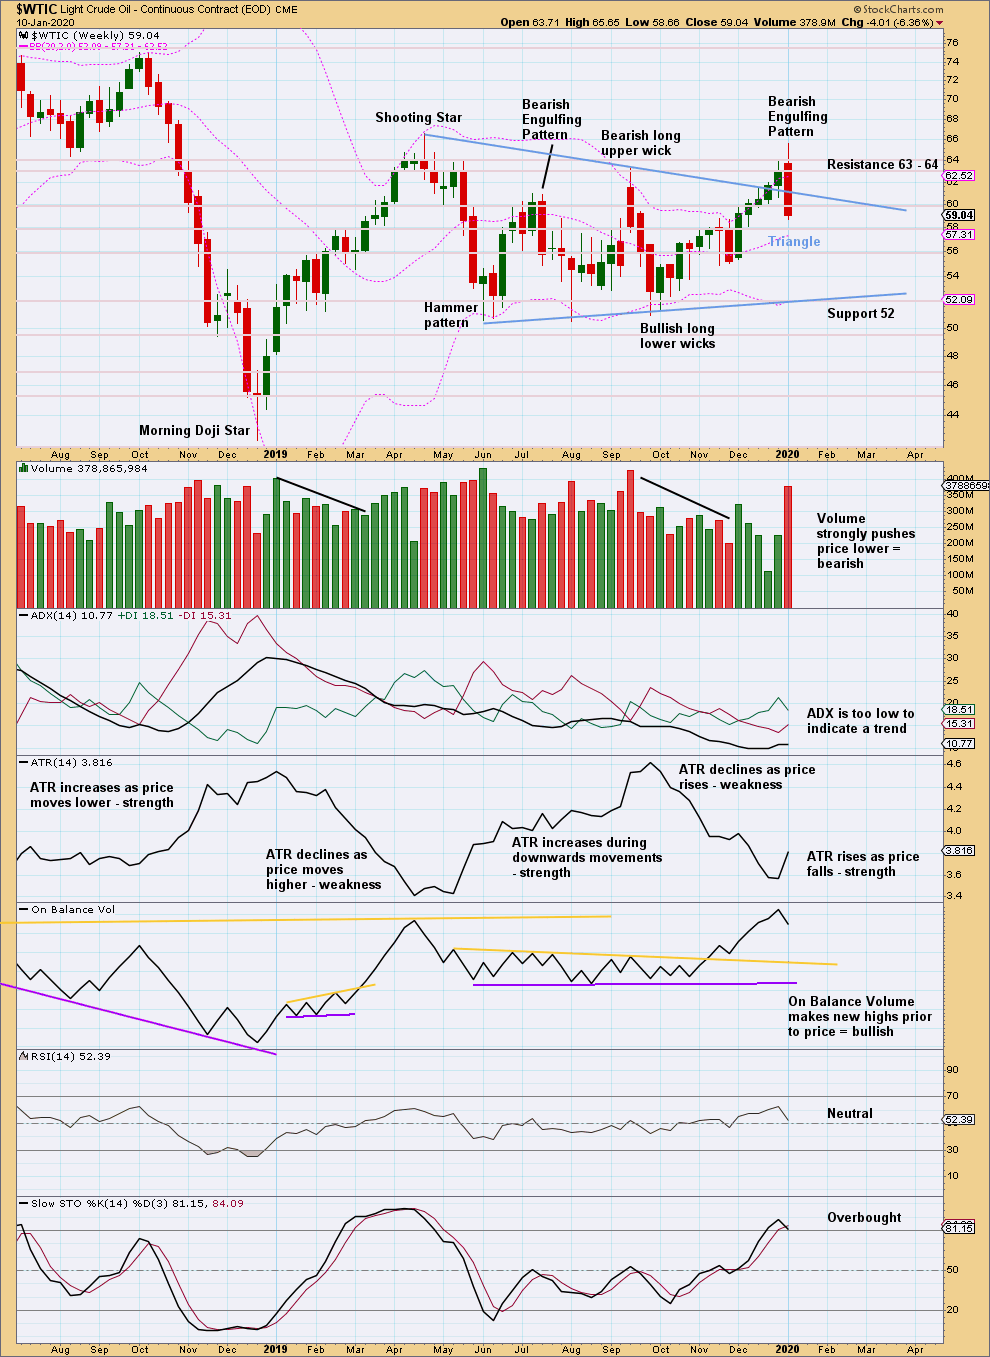
Click chart to enlarge. Chart courtesy of StockCharts.com.
After a possible upwards breakout from the large triangle pattern, price has this week returned to within the triangle on a very strong downwards week with strong support from volume. The upwards breakout was false.
This week’s strong Bearish Engulfing pattern engulfs the entire real bodies of the three prior weeks. The upper wick this week is also bearish. This strongly supports the main Elliott wave count.
DAILY CHART
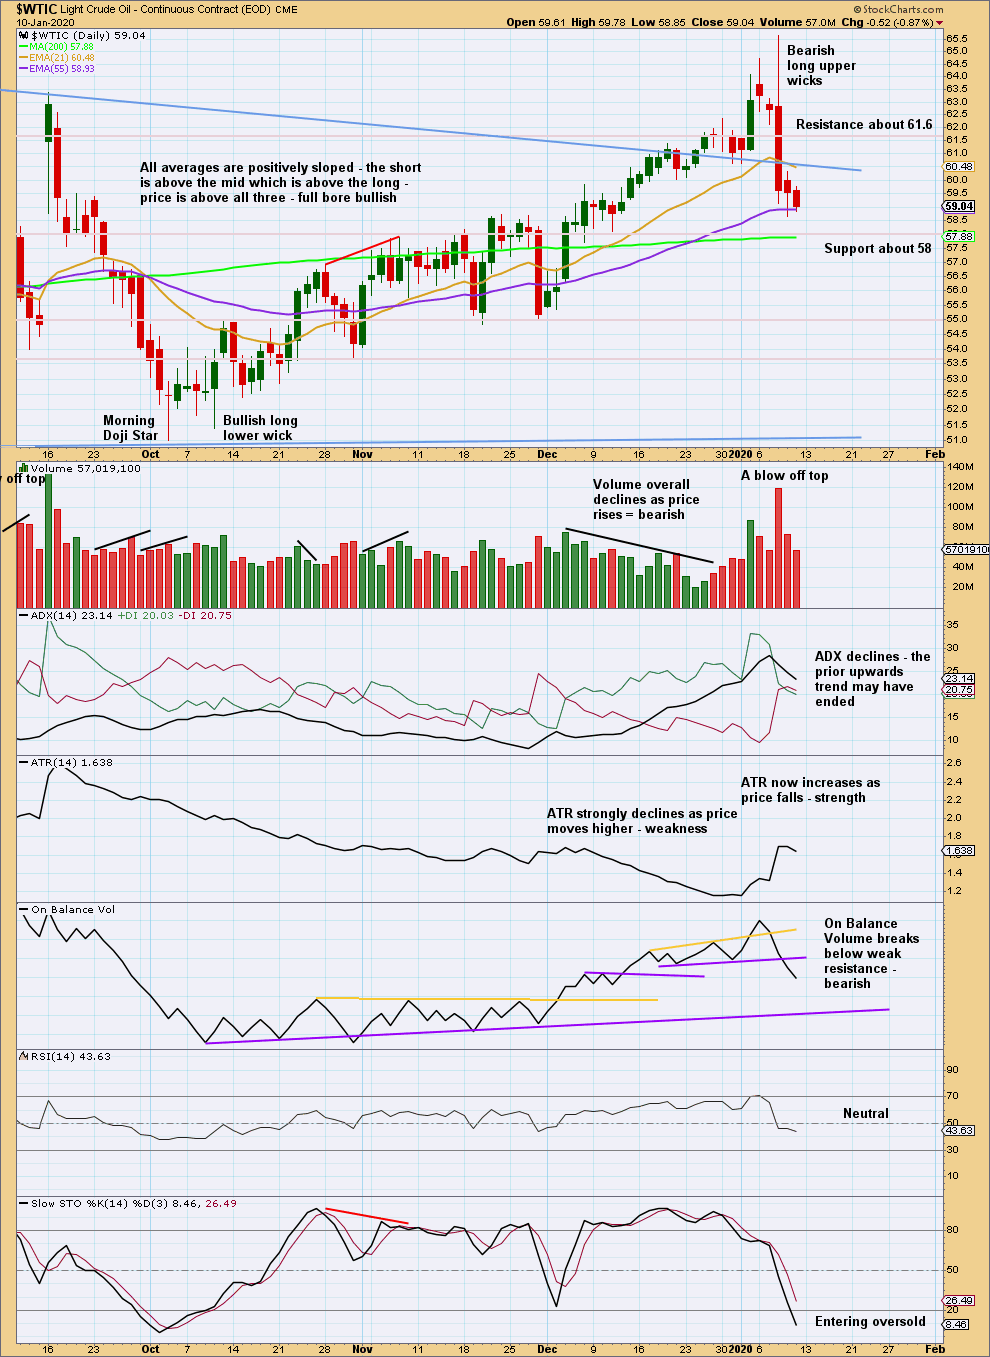
Click chart to enlarge. Chart courtesy of StockCharts.com.
The daily candlestick of the 8th of January completes a very strong Bearish Engulfing pattern with a very bearish long upper wick. This strongly supports the main Elliott wave count.
—
Always practice good risk management as the most important aspect of trading. Always trade with stops and invest only 1-5% of equity on any one trade. Failure to manage risk is the most common mistake new traders make.
Appears monthly MACD at new high
Lake Wanaka, crystal clear water and not too cold actually, quite refreshing on a hot day.
Camping available up there?
Hi Lara, on Oil: Any idea how to label the shallow but downward action from the last few days, seems like some sort of b wave?
Still minuette (c). Which must subdivide as a five wave structure, most likely an impulse.
So far subminuette i may be over at the low for this week, and the little bounce today may be subminuette ii.
Hi Lara,
For S&P, it looks like we’ve passed the minor 3 target, and are now approaching the intermediate 3 target. Would a degree change in the wave count be warranted at this point?
No, not yet. Minor 4 still has to show up on the weekly chart for the wave count to have the right look.
The next target now for minor 3 is 3,332. But more importantly price is now almost at the upper edge of the wide channel (teal on the first weekly chart, maroon on the second). Look for a strong reaction there.
At this time that trend line may be acting as a magnet to price.
When minor 3 and 4 are both complete then I can calculate a new target for intermediate (3) at minor degree.