
Lara’s Weekly: Elliott Wave and Technical Analysis of S&P500 and Gold and US Oil | Charts – February 14, 2020

S&P 500
An inside day to end the session prints a Dragonfly Doji. In the context of an upwards trend, this is bullish.
The alternate Elliott wave count was invalidated this week leaving only the one main Elliott wave count at this time. Targets remain the same.
Summary: The trend is up.
The target for the next interruption to the trend is at 3,415.
Two more large pullbacks or consolidations (fourth waves) during the next 1-2 years are expected: for intermediate (4) and then primary 4.
If price makes a new high by any amount at any time frame above 3,477.39 (even a fraction of a point on a tick chart), then this analysis switches to one of the very bullish alternate monthly charts. The next cycle degree target would then be either 4,092 or 4,213.
The biggest picture, Grand Super Cycle analysis, is here.
Monthly charts were last published here. Video here.
ELLIOTT WAVE COUNTS
FIRST WAVE COUNT
WEEKLY CHART
Click chart to enlarge.
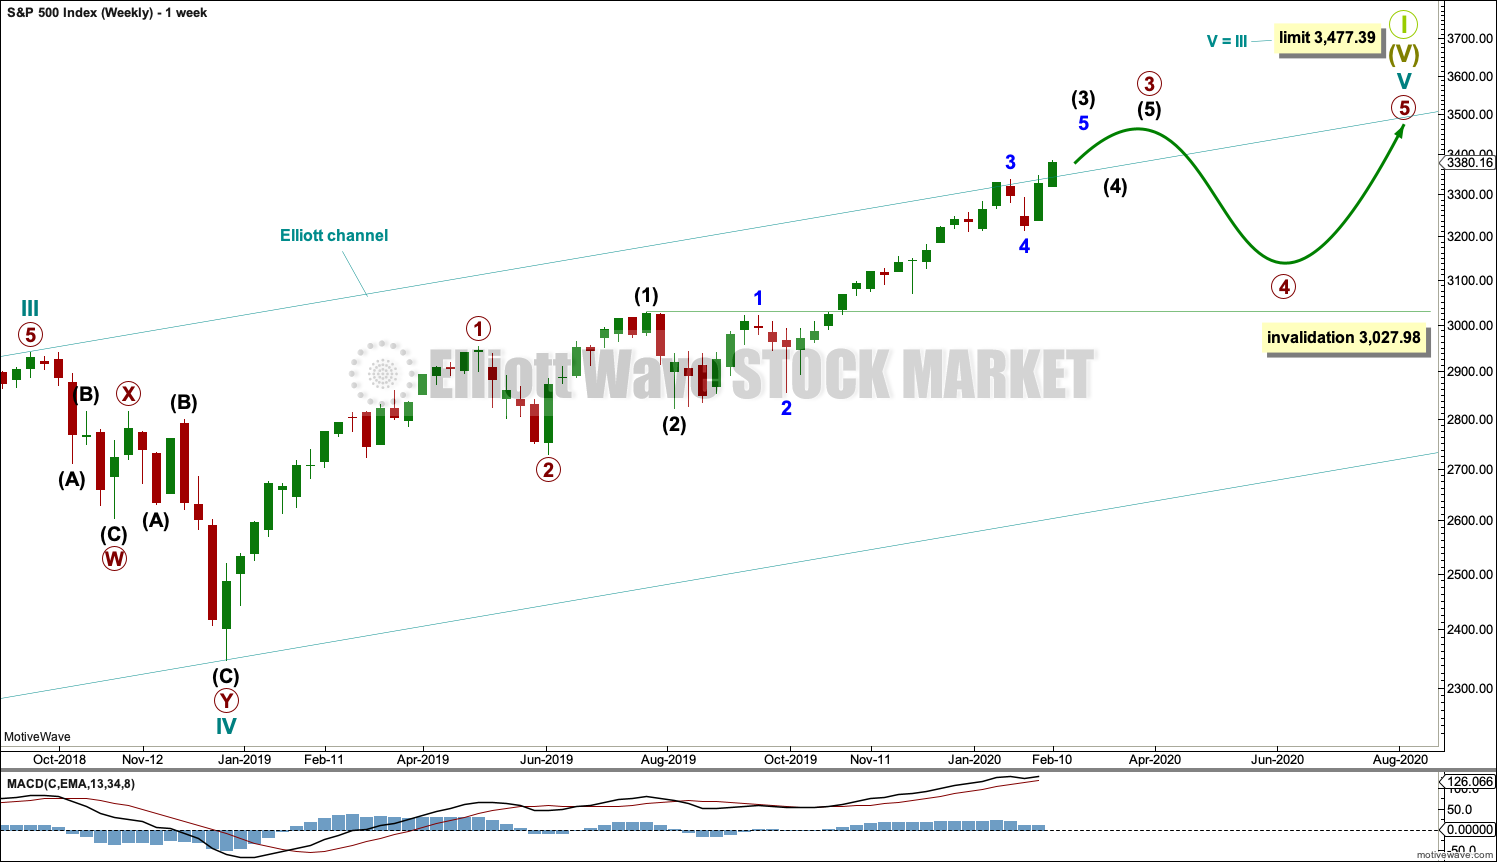
Cycle wave V may subdivide either as an impulse or an ending diagonal. Impulses are much more common, and it is clear at this stage that cycle wave V is an impulse and not a diagonal.
At this stage, cycle wave V may take another one to two or so years to complete.
A channel is drawn about the impulse of Super Cycle wave (V) using Elliott’s first technique. Draw this channel first from the high of 2,079.46 on the 5th of December 2014 to the high of 2,940.91 on the 21st of September 2018, then place a parallel copy on the low at 1,810.10 on the 11th of February 2016. Cycle wave IV found support about the lower edge.
Within Super Cycle wave (V), cycle wave III may not be the shortest actionary wave. Because cycle wave III is shorter than cycle wave I, this limits cycle wave V to no longer than equality in length with cycle wave III at 3,477.39. A new high by any amount at any time frame above this point would invalidate this main wave count in favour of one of the two alternate wave counts in the monthly chart analysis which are much more bullish.
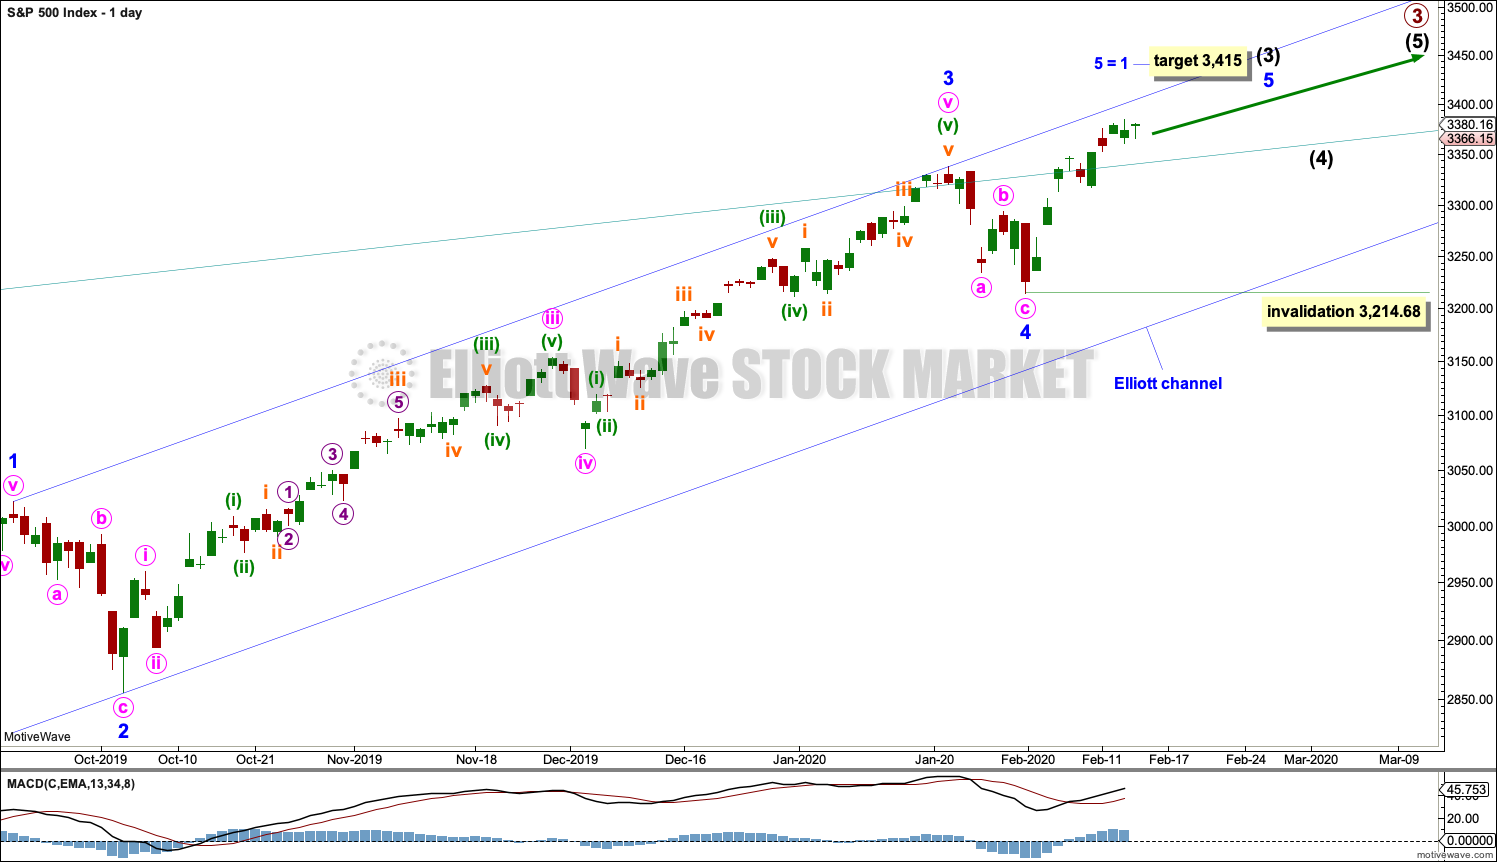
The daily chart below will focus on movement from the end of minor wave 1 within intermediate wave (3).
Within cycle wave V, primary waves 1 and 2 may be complete. Within primary wave 3, intermediate waves (1) and (2) may be complete. Intermediate wave (3) may be over at any stage now. Intermediate wave (4) may not move into intermediate wave (1) price territory below 3,027.98.
Within cycle wave V, the corrections of primary wave 2, intermediate wave (2) and minor wave 2 all show up clearly on the weekly chart. For cycle wave V to have the right look, the corresponding corrections of minor wave 4, intermediate wave (4) and primary wave 4 should also show up on the weekly chart. Minor wave 4 now shows up on the weekly chart, and so now two more large multi-week corrections are needed as cycle wave V continues higher, and for this wave count the whole structure must complete at or before 3,477.39.
DAILY CHART
Click chart to enlarge.
Minor waves 2 and 4 for this wave count both subdivide as zigzags; there is no alternation in structure. Minor wave 2 is deep at 0.83 the length of minor wave 1, and minor wave 4 is shallow at 0.26 the length of minor wave 3; there is alternation in depth. Minor wave 2 lasted 10 sessions and minor wave 4 lasted 7 sessions; the proportion is acceptable and gives the wave count the right look.
There is no adequate Fibonacci ratio between minor waves 1 and 3. This makes it more likely that minor wave 5 may exhibit a Fibonacci ratio. The target expects minor wave 5 to exhibit the most common Fibonacci ratio within an impulse.
Within minor wave 5, no second wave correction may move beyond its start below 3,214.68.
When intermediate waves (3) and (4) may be complete, then a target will again be calculated for primary wave 3.
Price is now above the upper edge of the teal channel, which is copied over from the weekly chart. This trend line may now be about where price may find some support.
SECOND WAVE COUNT
WEEKLY CHART
Click chart to enlarge.
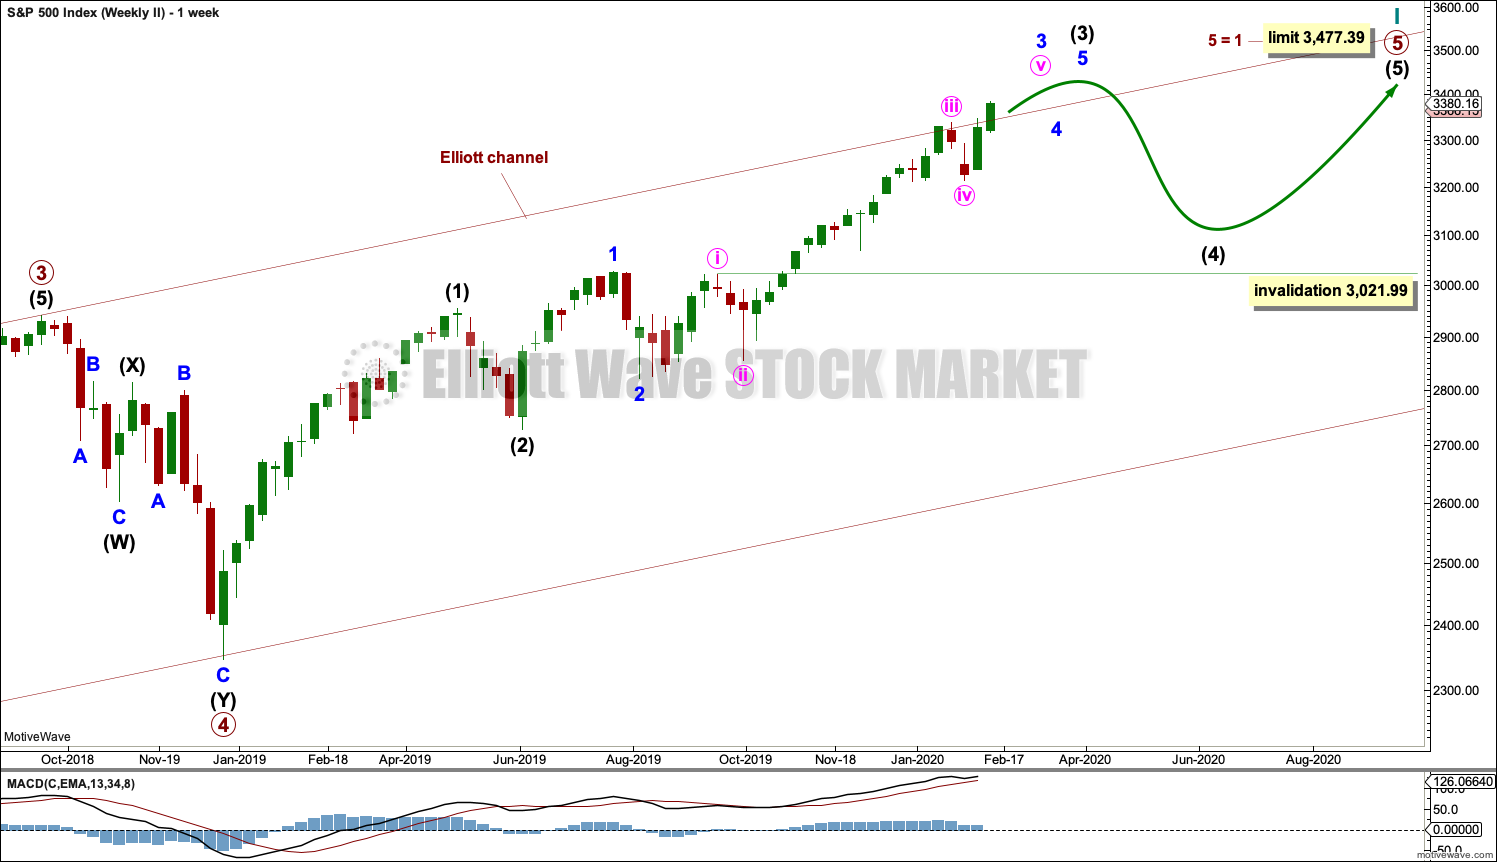
This second wave count sees all subdivisions from the end of the March 2009 low in almost the same way, with the sole difference being the degree of labelling.
If the degree of labelling for the entirety of this bull market is all moved down one degree, then only a first wave at cycle degree may be nearing an end.
When cycle wave I is complete, then cycle wave II should meet the technical definition of a bear market as it should retrace more than 20% of cycle wave I, but it may end about either the 0.382 or 0.618 Fibonacci Ratios of cycle wave I. Cycle wave II may end close to the low of primary wave II within cycle wave I, which is at 1,810.10. It is also possible that cycle wave II could be fairly shallow and only barely meet the definition of a bear market.
The impulse is still viewed as nearing an end; a fifth wave is still seen as needing to complete higher. This wave count labels it primary wave 5. Primary wave 5 may still need another year to two or so to complete, depending upon how time consuming the corrections within it may be.
Primary wave 5 may be subdividing as an impulse, in the same way that cycle wave V is seen for the first weekly chart.
TECHNICAL ANALYSIS
WEEKLY CHART
Click chart to enlarge. Chart courtesy of StockCharts.com.
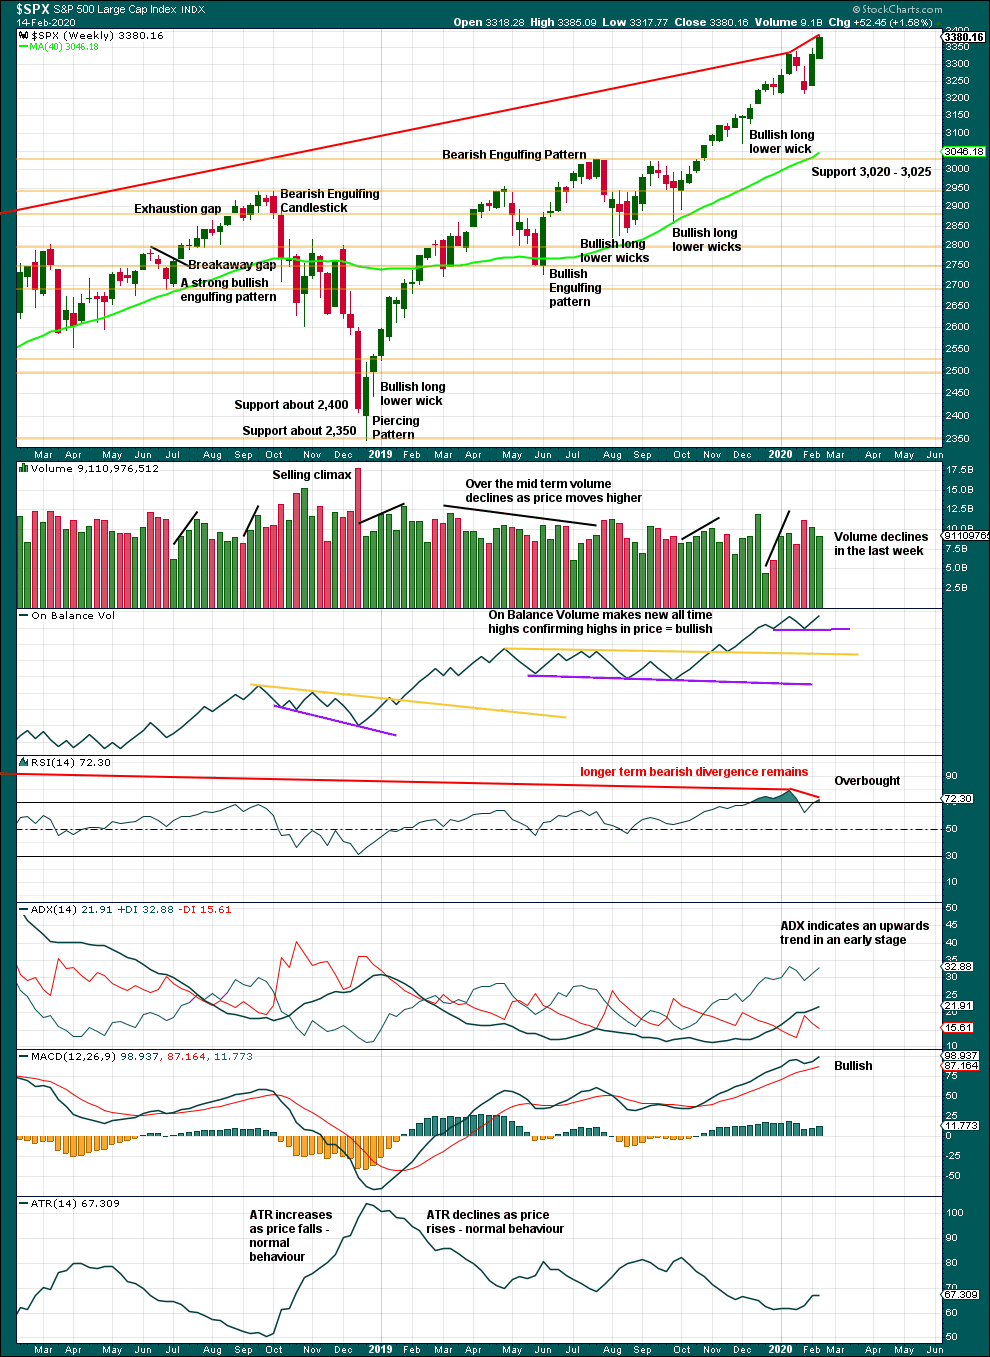
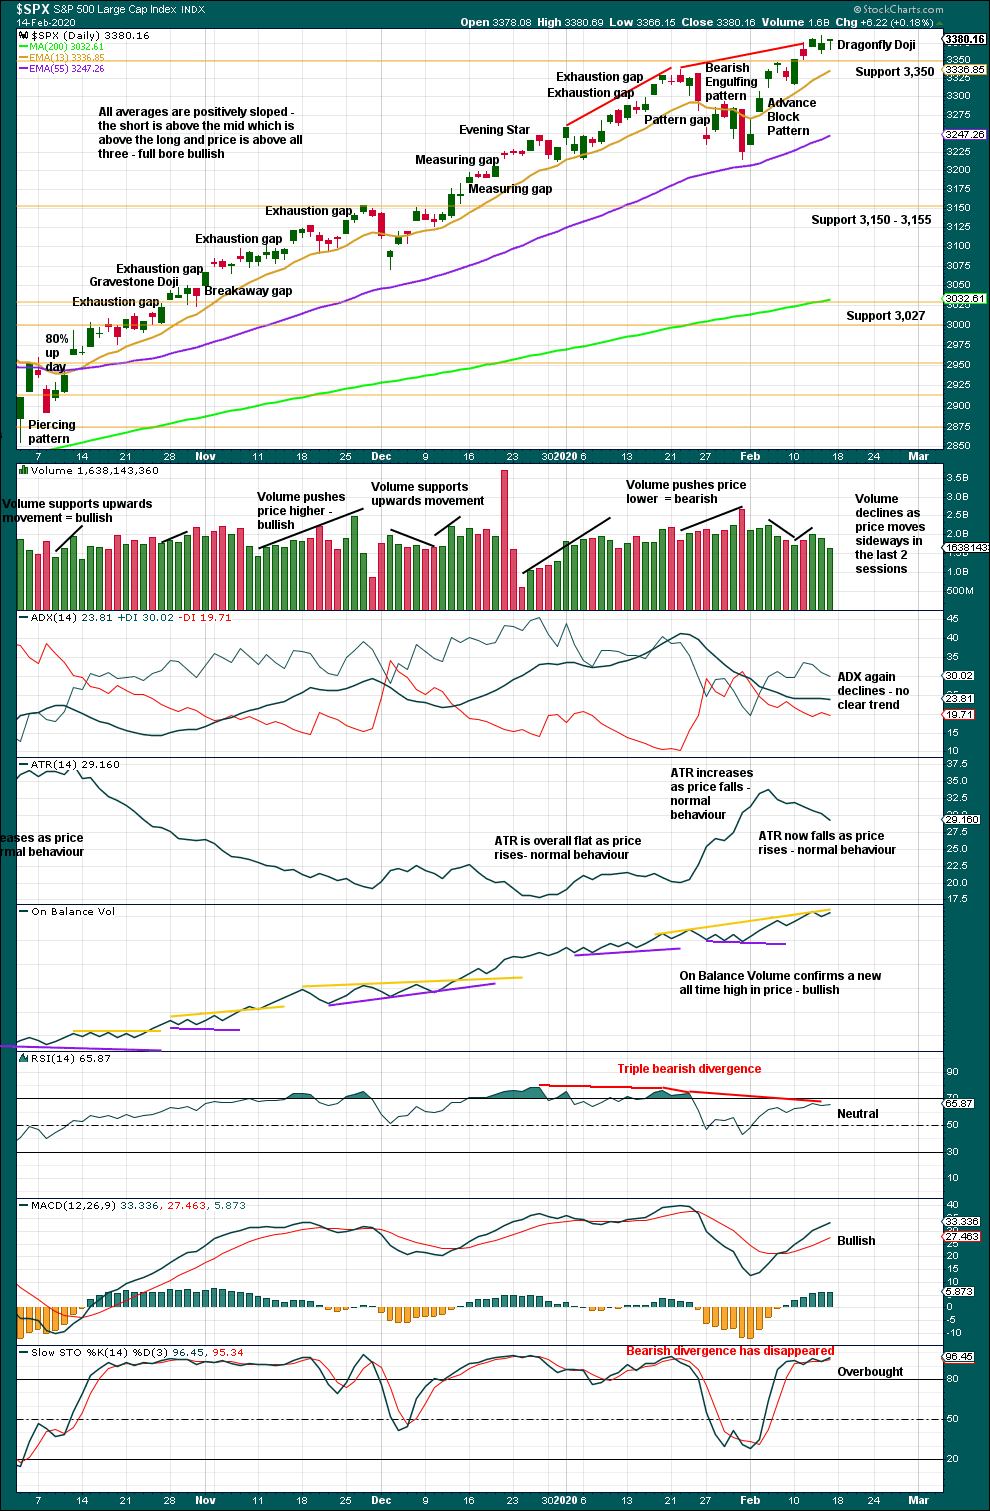
It is very clear that the S&P is in an upwards trend and the bull market is continuing. Price does not move in straight lines; there will be pullbacks and consolidations along the way.
This chart is overall bullish. There are no signs of weakness in upwards movement.
A pullback or consolidation is complete and found strong support below about 3,020 to 3,025.
This bull market beginning in March 2009 has been characterised now for many years by rising price on declining volume. Despite all technical textbooks stating this is unsustainable, it has now been sustained for over a decade. This is concerning for an eventual bearish move as it may mean that support below is thin and weak, but for now the bull market continues. A decline in volume in current market conditions shall not be read necessarily as bearish.
This week exhibits some strength in upwards movement with reasonable range, although a small decline in volume again is not of a concern here.
Further pullbacks or consolidations will unfold. Do not expect price to move in a straight line. Pullbacks to support in a bull market may be used as opportunities to join an established trend.
Continued bearish divergence for the short term between price and RSI suggests the risk of a pullback remains high.
DAILY CHART
Click chart to enlarge. Chart courtesy of StockCharts.com.
The larger trend, particularly at the monthly time frame, remains up. Expect pullbacks and consolidations to be more short term in nature although they can last a few weeks.
Look for initial support for any pullbacks about 3,350. For the short term, the Dragonfly Doji on Friday is bullish.
BREADTH – AD LINE
WEEKLY CHART
Click chart to enlarge. Chart courtesy of StockCharts.com. So that colour blind members are included, bearish signals will be noted with blue and bullish signals with yellow.
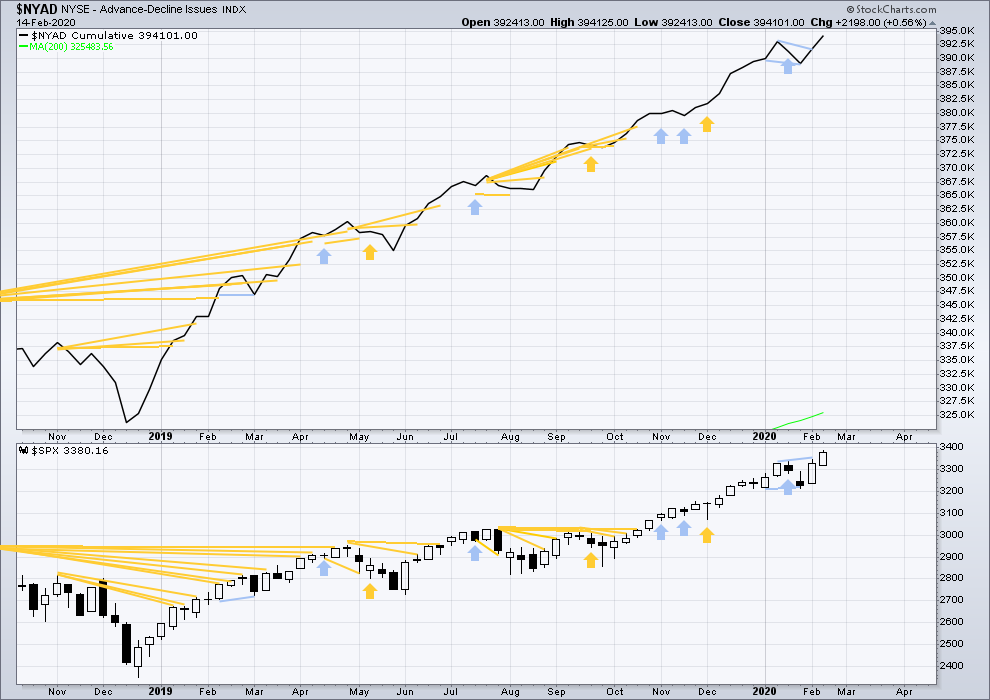
Bear markets from the Great Depression and onwards have been preceded by an average minimum of 4 months divergence between price and the AD line with only two exceptions in 1946 and 1976. With the AD line making new all time highs last week, the end of this bull market and the start of a new bear market is very likely a minimum of 4 months away, which is mid May 2020.
In all bear markets in the last 90 years there is some positive correlation (0.6022) between the length of bearish divergence and the depth of the following bear market. No to little divergence is correlated with more shallow bear markets. Longer divergence is correlated with deeper bear markets.
If a bear market does develop here, it comes after no bearish divergence. It would therefore more likely be shallow.
Bearish short-term divergence noted last week has not been followed by any downwards movement. It is considered to have failed.
This week both price and the AD line have made new all time highs. Upwards movement has support from rising market breadth. This is bullish and supports the Elliott wave count.
Large caps all time high: 3,385.09 on 13th February 2020.
Mid caps all time high: 2,106.30 on 17th January 2020.
Small caps all time high: 1,100.58 on 27th August 2018.
For the short term, there is a little weakness now in only large caps making most recent new all time highs.
DAILY CHART
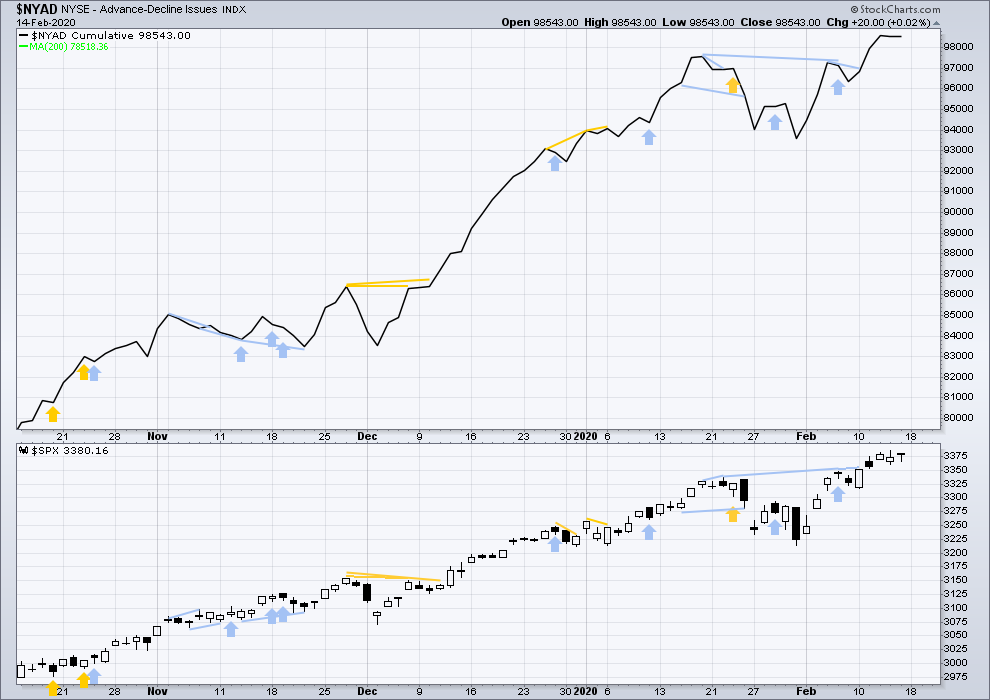
Click chart to enlarge. Chart courtesy of StockCharts.com. So that colour blind members are included, bearish signals will be noted with blue and bullish signals with yellow.
Breadth should be read as a leading indicator.
A sideways day for price with the AD line flat is neutral.
The last all time high in price had support from a corresponding new all time high in the AD line. This supports the Elliott wave count.
VOLATILITY – INVERTED VIX CHART
WEEKLY CHART
Click chart to enlarge. Chart courtesy of StockCharts.com. So that colour blind members are included, bearish signals will be noted with blue and bullish signals with yellow.
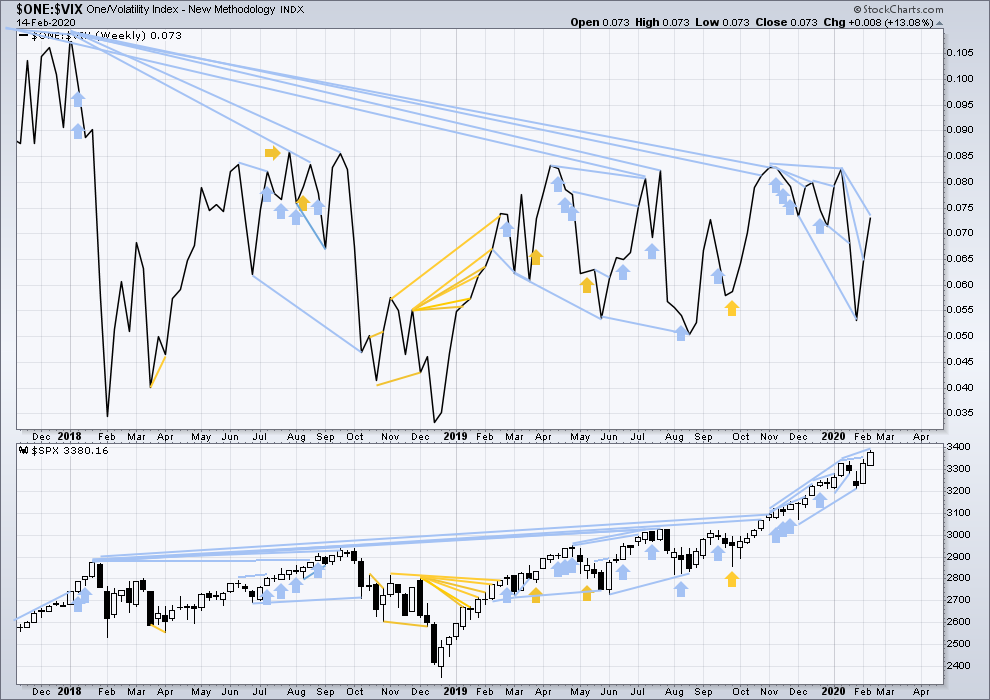
The all time high for inverted VIX was on 30th October 2017. There is now over two years of bearish divergence between price and inverted VIX.
The rise in price is not coming with a normal corresponding decline in VIX; VIX remains elevated. This long-term divergence is bearish and may yet develop further as the bull market matures.
This divergence may be an early warning, a part of the process of a top developing that may take years. It is clearly not useful in timing a trend change from bull to a fully fledged bear market.
Price has moved higher and made a new high, but inverted VIX has not. There is again short, mid and long-term bearish divergence. This supports the main Elliott wave count.
DAILY CHART
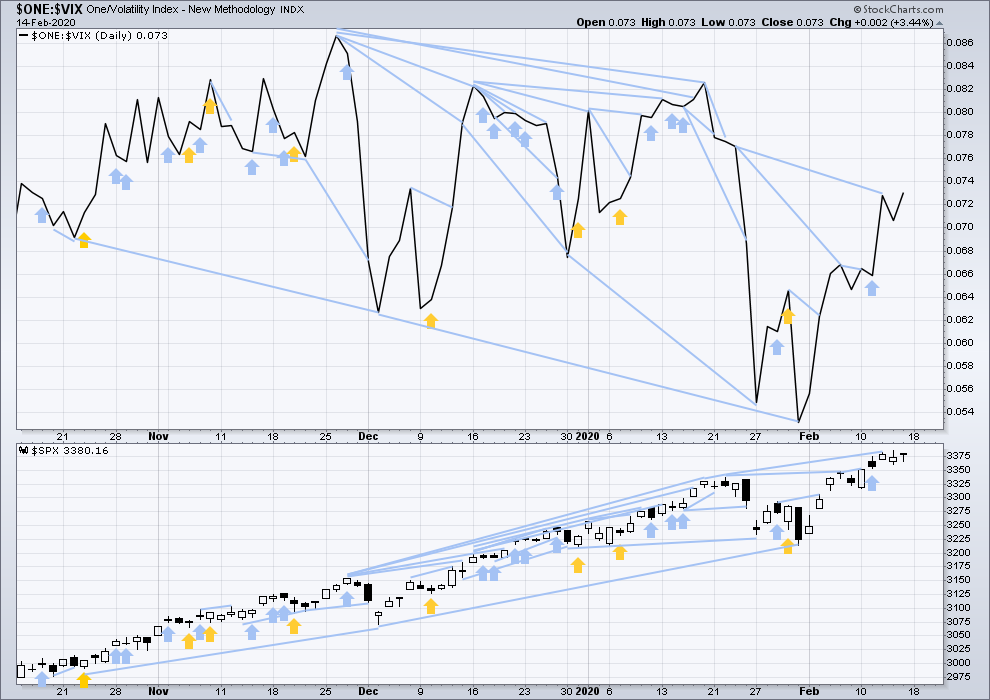
Click chart to enlarge. Chart courtesy of StockCharts.com. So that colour blind members are included, bearish signals will be noted with blue and bullish signals with yellow.
Price has completed an inside day. Inverted VIX has increased.
While price has moved sideways, VIX has declined. This is bullish.
DOW THEORY
Dow Theory confirmed a bear market in December 2018. This does not necessarily mean a bear market at Grand Super Cycle degree though; Dow Theory makes no comment on Elliott wave counts. On the 25th of August 2015 Dow Theory also confirmed a bear market. The Elliott wave count sees that as part of cycle wave II. After Dow Theory confirmation of a bear market in August 2015, price went on to make new all time highs and the bull market continued.
DJIA: 23,344.52 – a close on the 19th of December at 23,284.97 confirms a bear market.
DJT: 9,806.79 – price has closed below this point on the 13th of December.
S&P500: 2,532.69 – a close on the 19th of December at 2,506.96 provides support to a bear market conclusion.
Nasdaq: 6,630.67 – a close on the 19th of December at 6,618.86 provides support to a bear market conclusion.
With all the indices having moved higher following a Dow Theory bear market confirmation, Dow Theory would confirm a bull market if the following highs are made:
DJIA: 26,951.81 – a close above this point has been made on the 3rd of July 2019.
DJT: 11,623.58 – to date DJT has failed to confirm an ongoing bull market.
S&P500: 2,940.91 – a close above this point was made on the 29th of April 2019.
Nasdaq: 8,133.30 – a close above this point was made on the 26th of April 2019.
GOLD
A short-term target for a little more upwards movement at 1,580 was met and passed by 4.50. The Elliott wave counts remain the same.
Summary: Downwards movement may resume with strength next week.
A new low below 1,536.52 would indicate a high was in place on the 8th of January and a downwards trend has begun. This is now the main wave count as price has strongly breached a channel containing prior upwards movement.
A third wave down at two degrees may begin in another one to very few days.
Grand SuperCycle analysis is here.
Monthly charts were last updated here.
BEARISH ELLIOTT WAVE COUNT
WEEKLY CHART
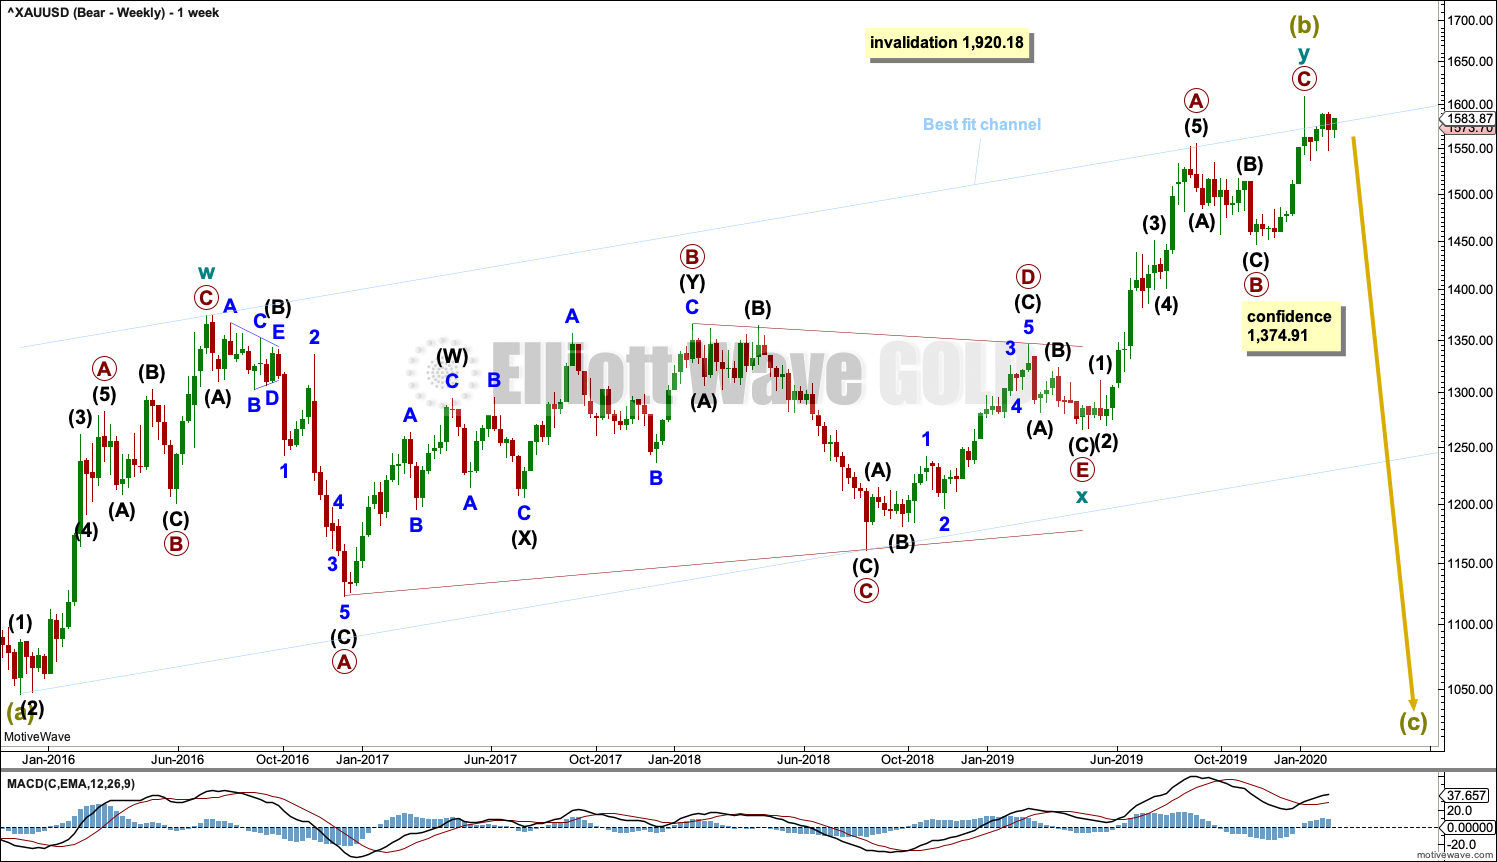
Click chart to enlarge.
Super Cycle wave (b) may a complete double zigzag. But it is possible that it may be incomplete and may require one final high; this is outlined now in an alternate wave count below.
The first zigzag in the double is labelled cycle wave w. The double is joined by a three in the opposite direction, a triangle labelled cycle wave x. The second zigzag in the double is labelled cycle wave y.
The purpose of the second zigzag in a double is to deepen the correction. Cycle wave y has achieved this purpose.
A new low below 1,374.91 would add strong confidence to this wave count. At that stage, the bullish Elliott wave count would be invalidated. At that stage, targets for Super Cycle wave (c) would be calculated.
A wide best fit channel is added in light blue. Copy this channel over to daily charts. Price is again very close to the upper edge of this channel, which may provide resistance.
DAILY CHART
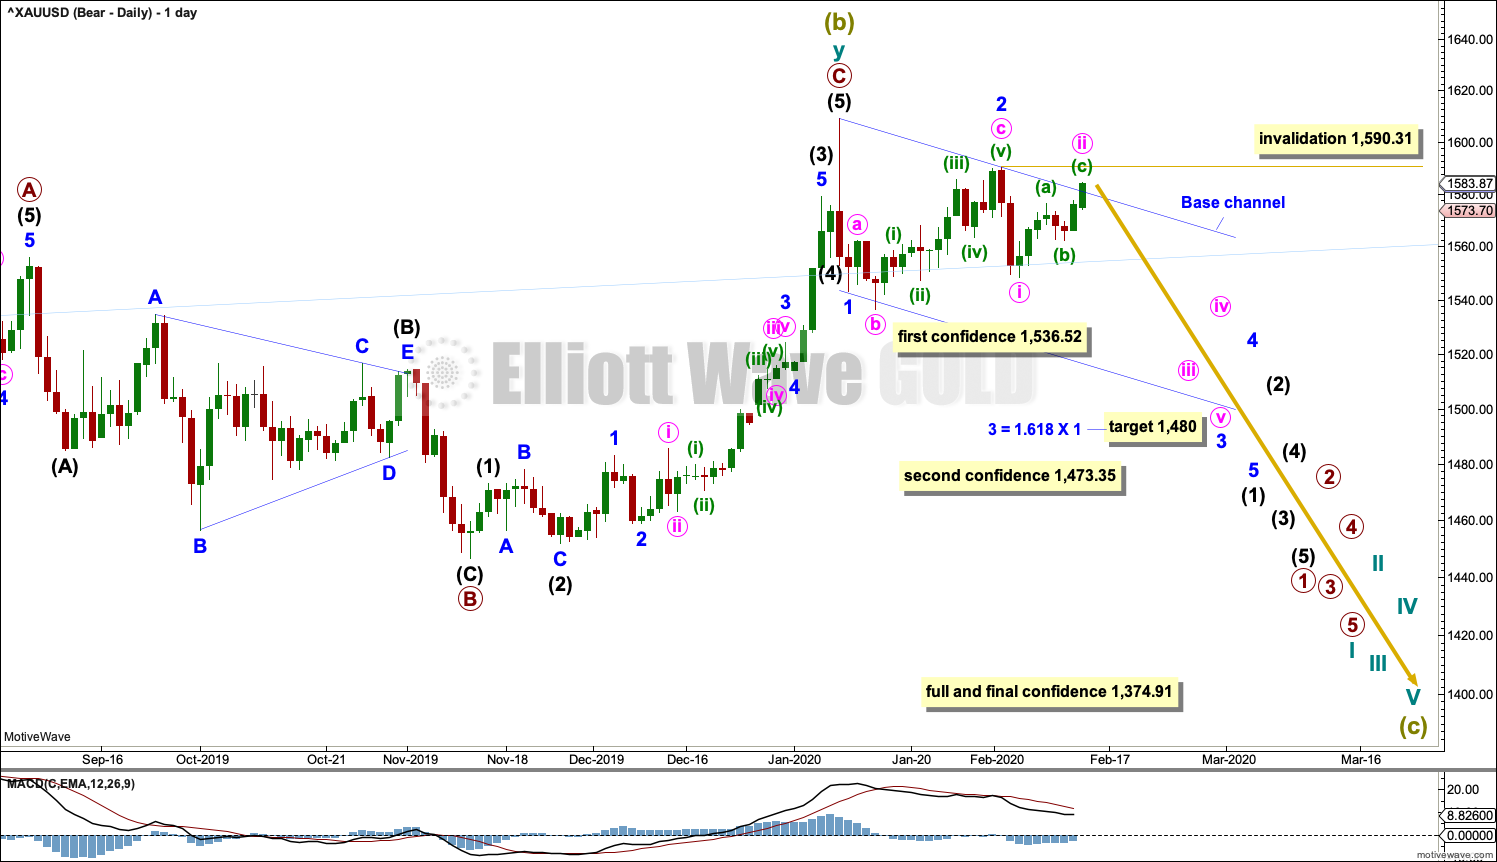
Click chart to enlarge.
It is possible that Super Cycle wave (b) may be complete and the bear market for Gold may have resumed.
A new low below 1,536.52 would invalidate the alternate bearish wave count and add some confidence in this wave count. A new low below 1,473.35 would add further confidence. Thereafter, a new low by any amount at any time frame below 1,374.91 would invalidate the bullish wave count below and add full and final confidence in this wave count. Targets for Super Cycle wave (c) would be calculated at that stage.
If Super Cycle wave (c) has begun, then it should develop a five wave structure downwards at all time frames up to and including monthly.
Minor waves 1 and 2 may be complete. Within minor wave 3, minute wave ii may not move beyond the start of minute wave i above 1,590.31.
Minute wave ii may find resistance about the upper edge of the base channel and the best fit channel.
Draw a base channel about minor waves 1 and 2. Draw the first trend line from the start of minor wave 1 to the end of minor wave 2, then place a parallel copy on the end of minor wave 1. Early in new trends Gold often but not always fits within base channels. Because it has a tendency to begin new trends slowly with deep and time consuming second waves, a close above this base channel on Friday is not of great concern.
ALTERNATE DAILY CHART
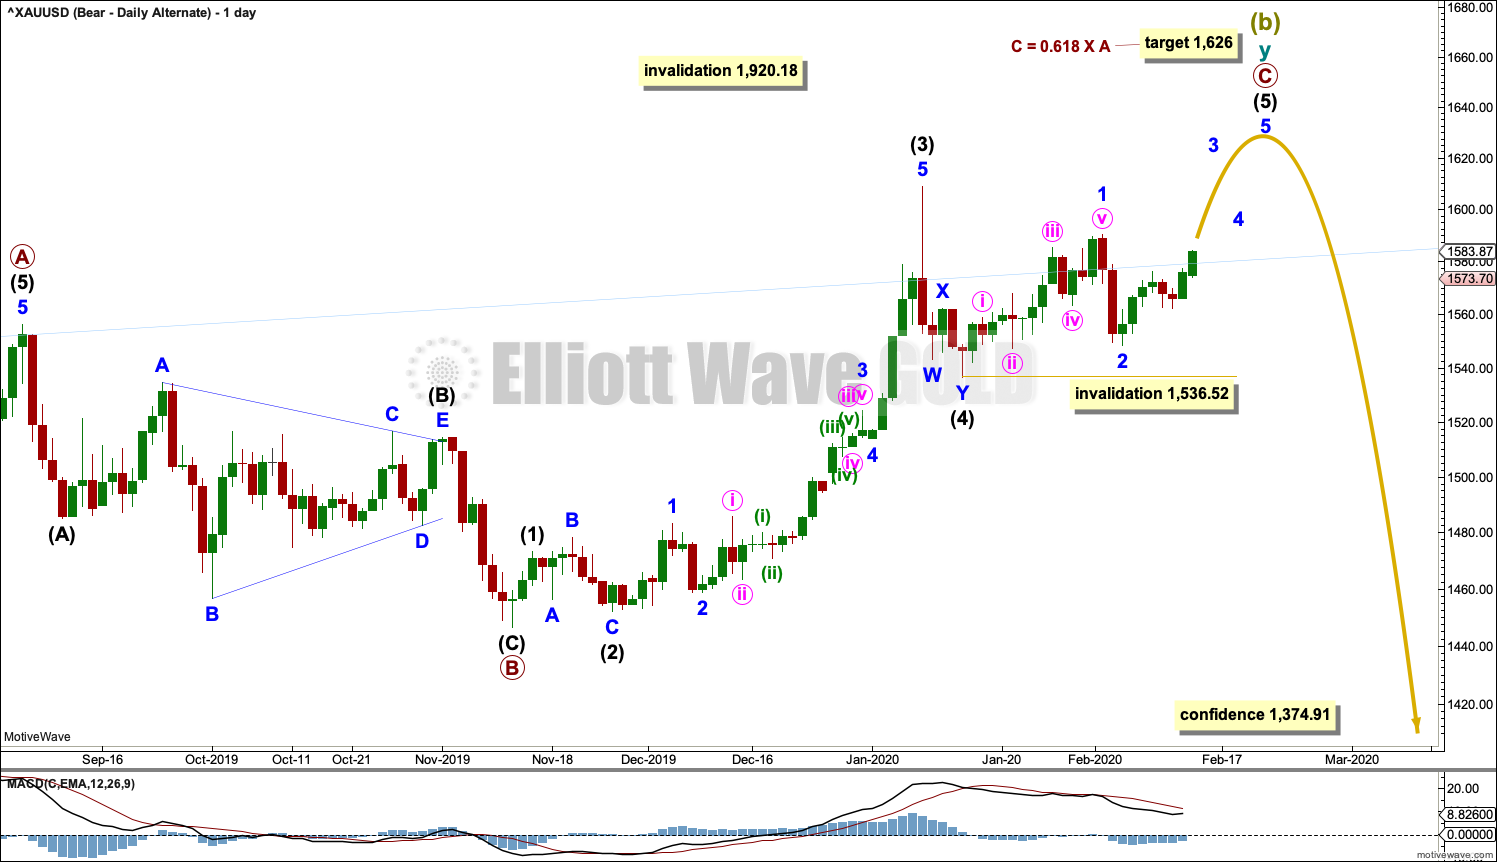
Click chart to enlarge.
The double zigzag for Super Cycle wave (b) may be still incomplete.
Within cycle wave y, primary waves A and B are complete. Primary wave C must complete as a five wave structure. It is unfolding as an impulse. Within the impulse, intermediate waves (1) to (4) may now be complete.
Intermediate wave (2) was a deep 0.79 zigzag, which lasted 8 sessions. Intermediate wave (4) may have been a shallow 0.46 double zigzag lasting 4 sessions. Fourth waves are usually more brief than second waves for Gold.
Within intermediate wave (5), minor wave 2 may not move beyond the start of minor wave 1 below 1,536.52.
Sideways and downwards movement of the last few weeks is now too large to look like a normal part of primary wave C. This wave count now does not have the right look. Its probability is low.
BULLISH ELLIOTT WAVE COUNT
WEEKLY CHART
Click chart to enlarge.
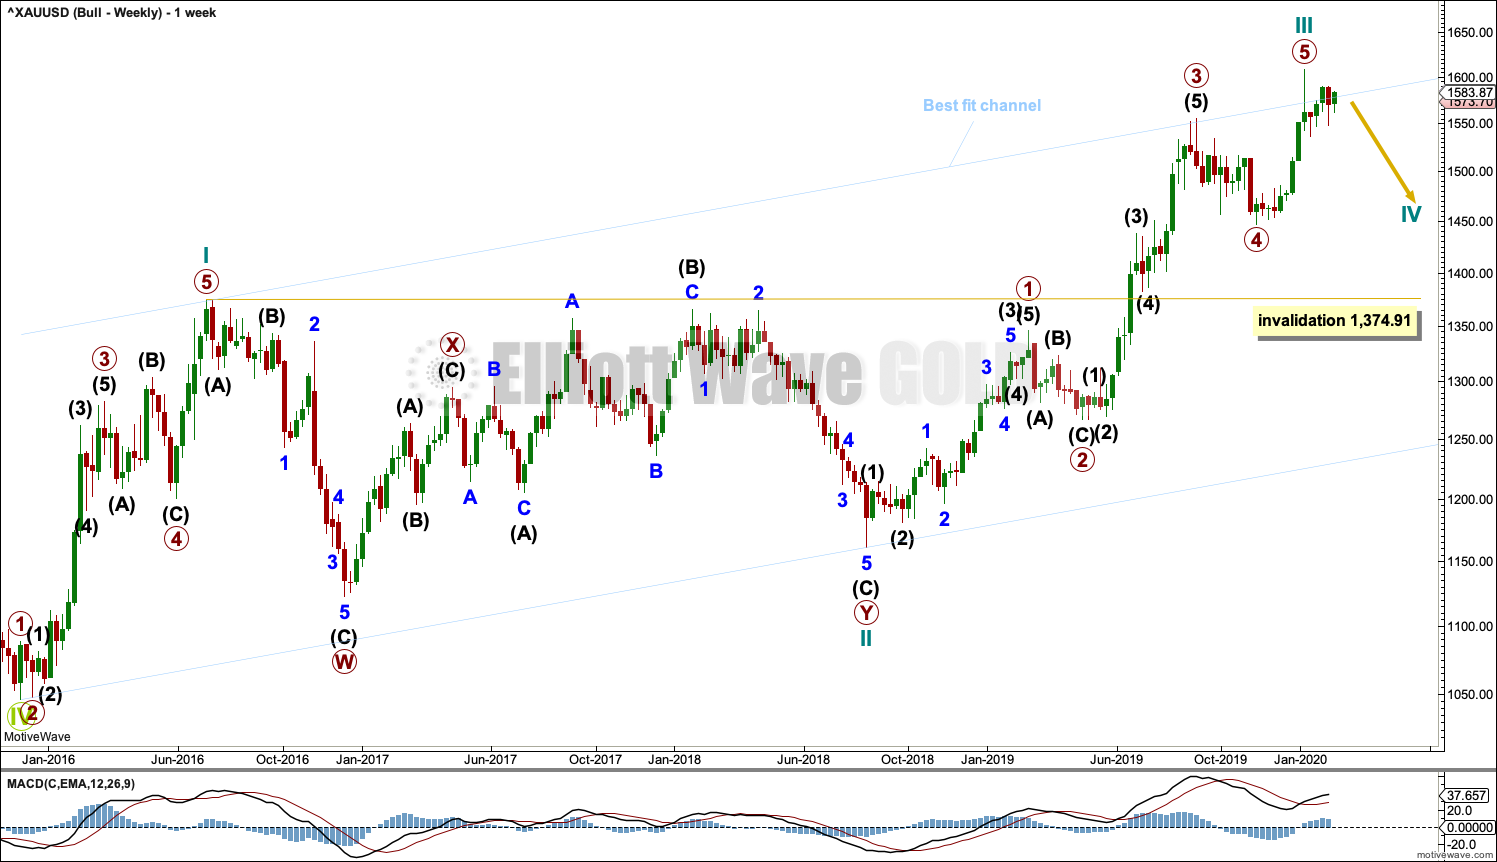
This wave count sees the the bear market complete at the last major low for Gold on 3 December 2015.
If Gold is in a new bull market, then it should begin with a five wave structure upwards on the weekly chart. However, the biggest problem with this wave count is the structure labelled cycle wave I because this wave count must see it as a five wave structure, but it looks more like a three wave structure.
Commodities often exhibit swift strong fifth waves that force the fourth wave corrections coming just prior and just after to be more brief and shallow than their counterpart second waves. It is unusual for a commodity to exhibit a quick second wave and a more time consuming fourth wave, and this is how cycle wave I is labelled. This wave count still suffers from this very substantial problem, which is one reason why the bearish wave count is preferred because it has a better fit in terms of Elliott wave structure.
Cycle wave II subdivides well as a double combination: zigzag – X – expanded flat.
Cycle wave III may now be complete. Cycle wave IV may now move lower over several weeks to months.
Cycle wave II subdivides as a double combination, which lasted 110 weeks. Given the guideline of alternation, cycle wave IV may be expected to most likely subdivide as a zigzag. Cycle wave IV may be more brief than cycle wave II; Gold’s fourth waves tend to be more brief and zigzags tend to be more brief than combinations.
Cycle wave IV may not move into cycle wave I price territory below 1,374.91.
Add the wide best fit channel to weekly and daily charts.
DAILY CHART

Click chart to enlarge.
Cycle wave IV would most likely subdivide as a zigzag, which may last several months. Within a zigzag, primary wave A must subdivide as a five wave structure, most likely an impulse. Within the impulse, intermediate waves (1) and (2) may now most likely be complete. Within intermediate wave (3), minor wave 2 may not move beyond the start of minor wave 1 above 1,590.31.
TECHNICAL ANALYSIS
WEEKLY CHART
Click chart to enlarge. Chart courtesy of StockCharts.com.
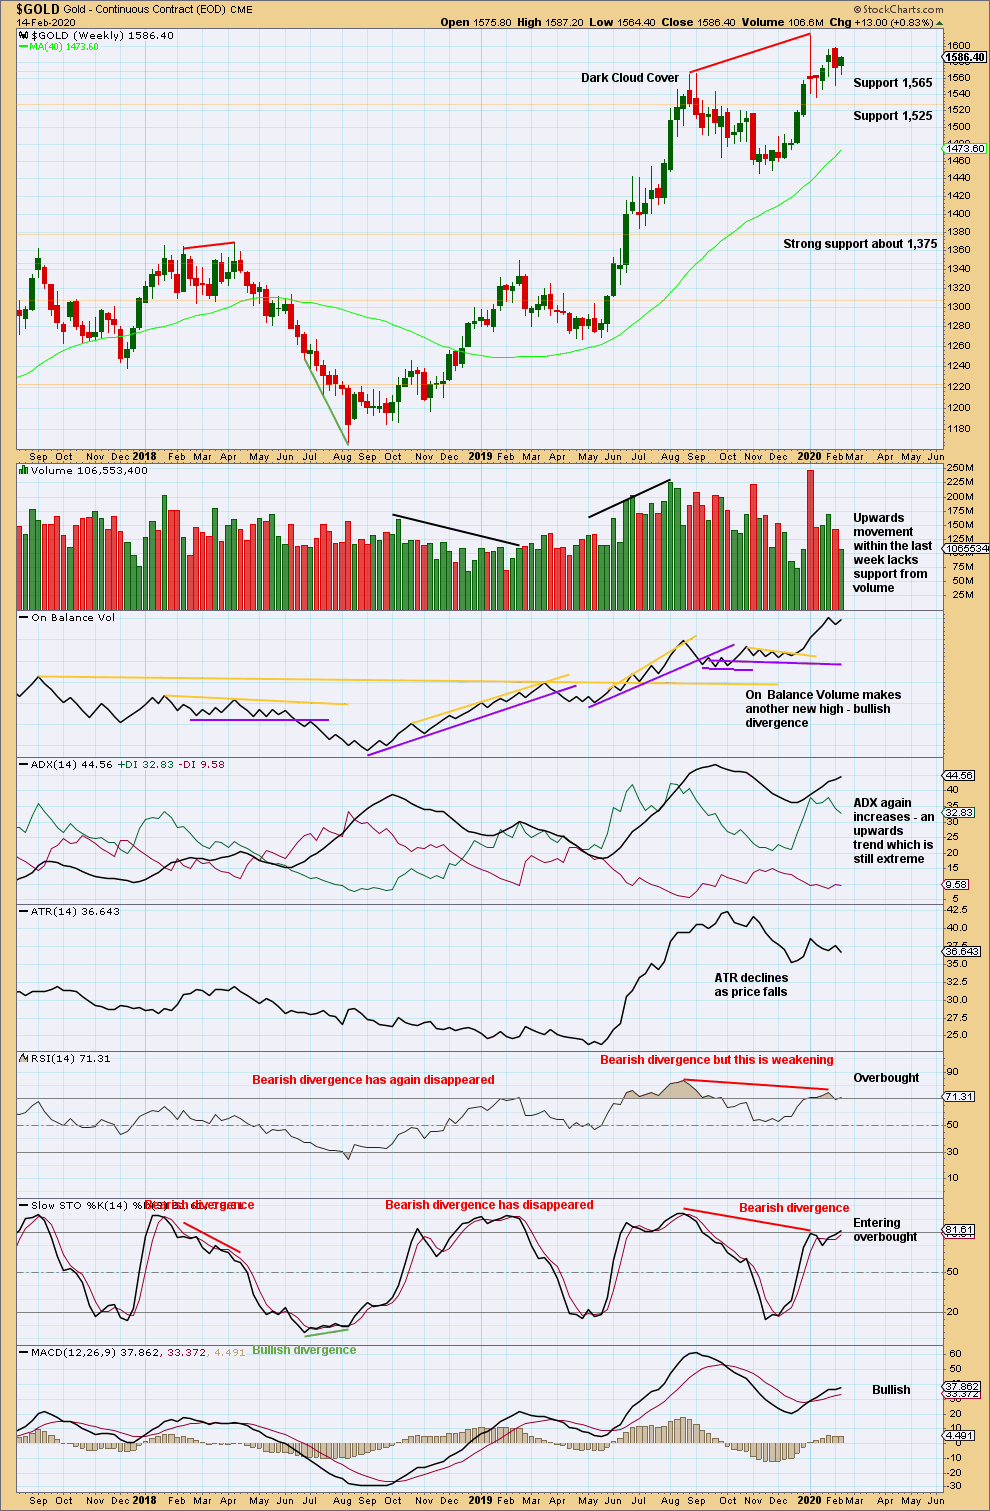
Bullish divergence between price and On Balance Volume is contradicted by bearish divergence between price and RSI. More weight may be given to RSI as this tends to be slightly more reliable, particularly after it has reached extreme. This would support the main bearish wave count.
The upwards trend reached extreme and RSI reached overbought. After reaching overbought, RSI then exhibited bearish divergence. This set up is often (not always) seen at major trend changes.
A small range inside week closes green. The lack of support this week for upwards movement supports the main Elliott wave count.
DAILY CHART
Click chart to enlarge. Chart courtesy of StockCharts.com.
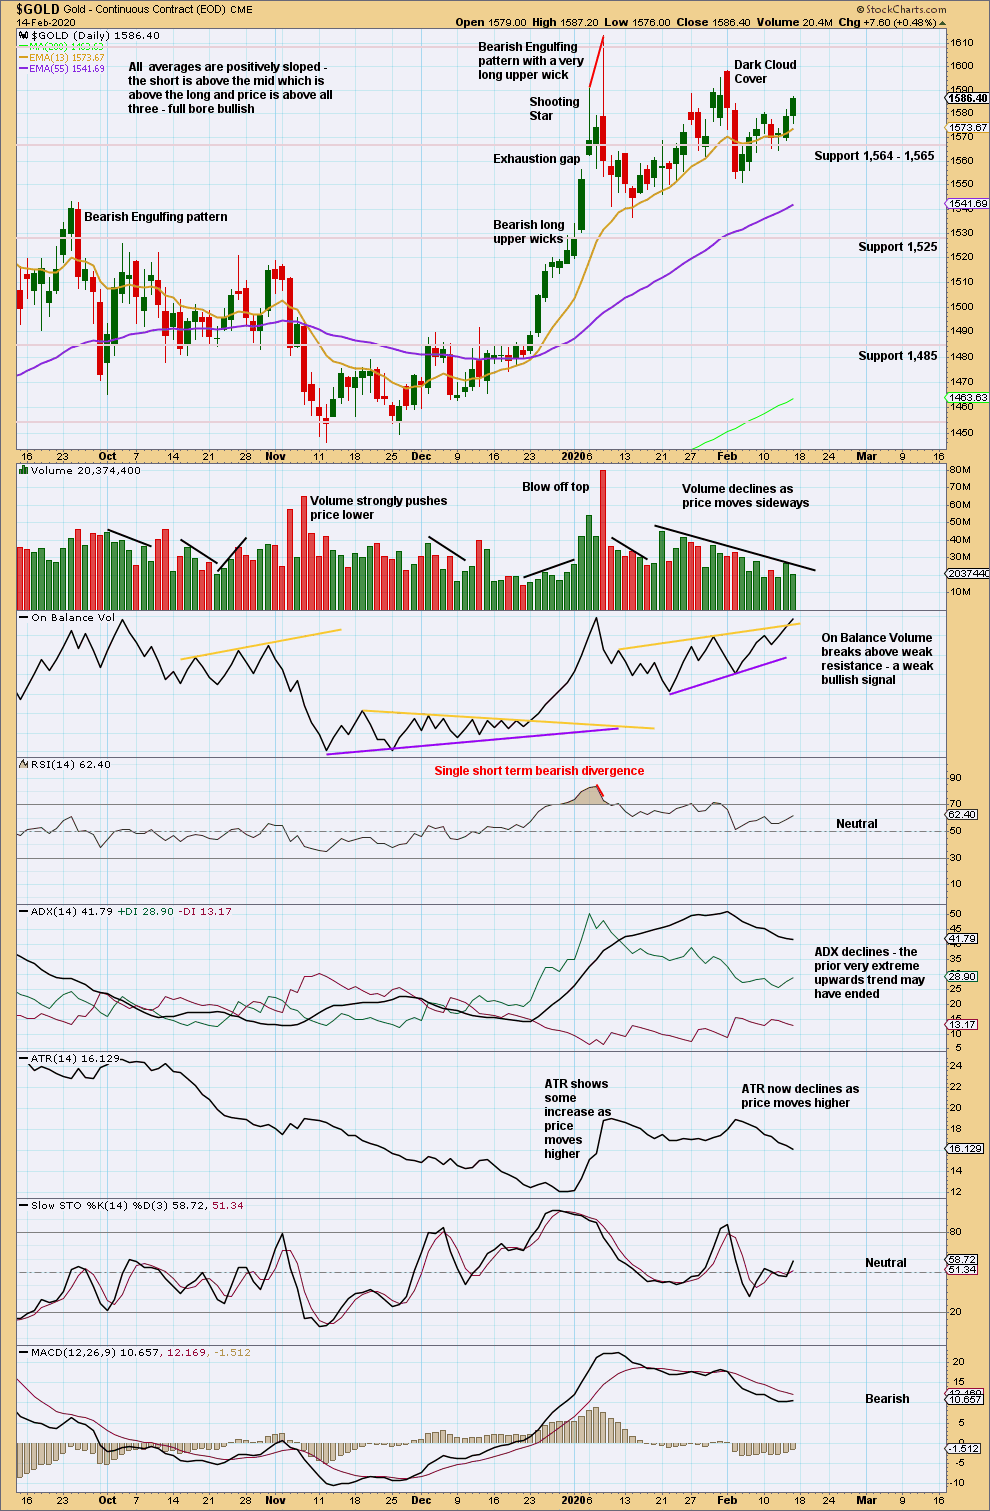
The last Bearish Engulfing pattern has strong support from volume, which increases the bearish implications. Expect a trend change to either down or sideways.
Now a strong downwards day after Dark Cloud Cover reinforces the view that a sustainable high may be in place.
Upwards movement shows increasing weakness; volume does not support upwards movement and range is declining. This looks like a counter trend bounce.
A decline in volume for the last upwards session suggests the counter trend bounce may be over here or over very soon.
GDX WEEKLY CHART
Click chart to enlarge. Chart courtesy of StockCharts.com.
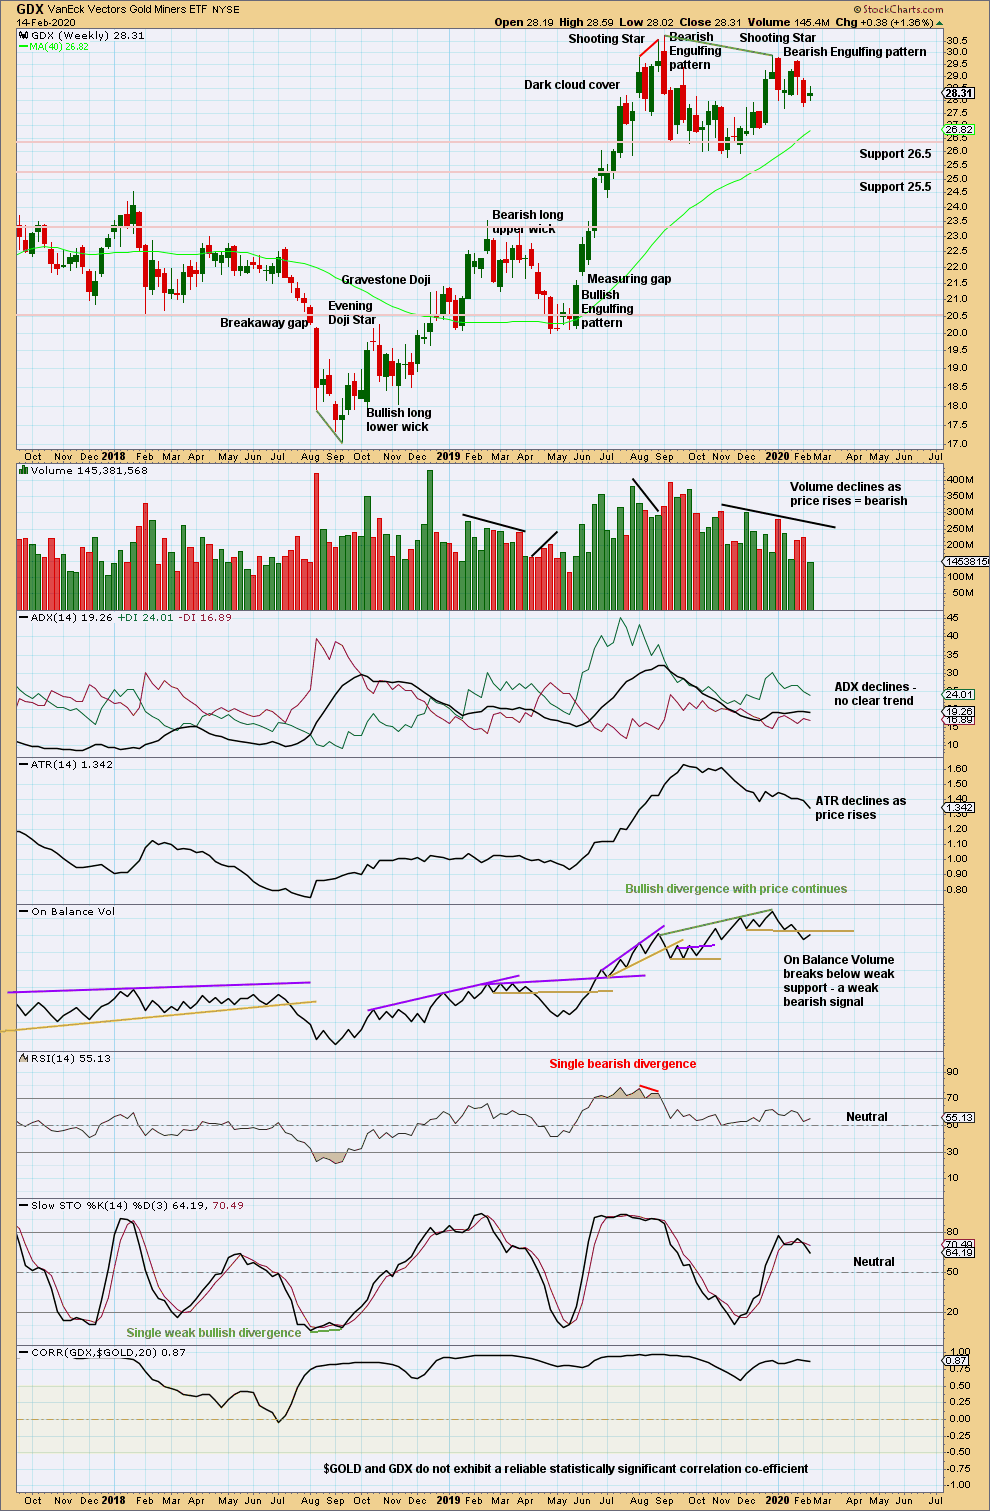
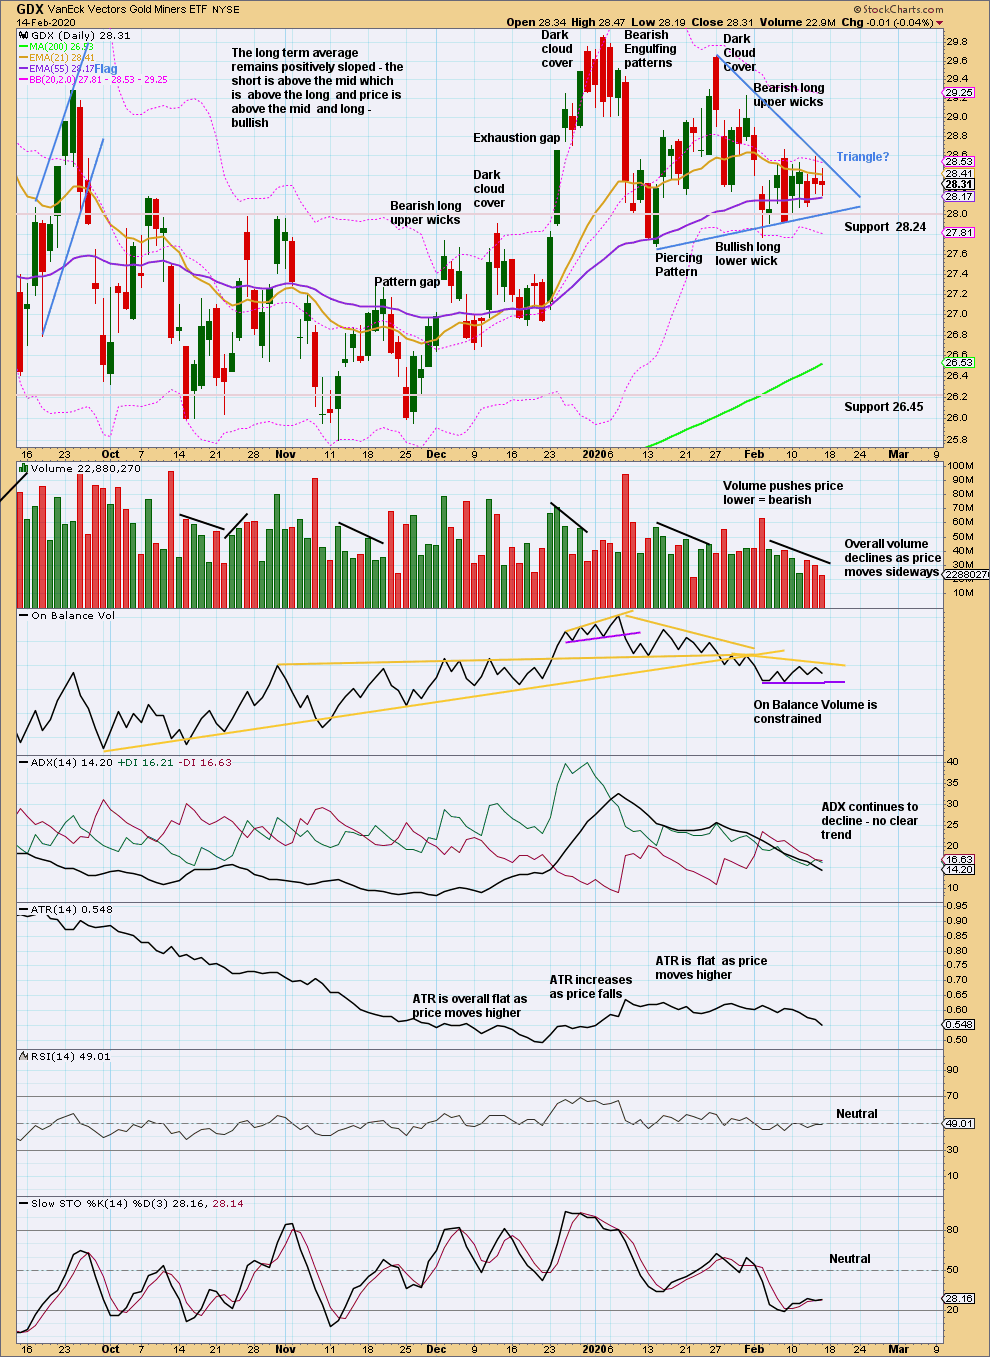
Now two bearish candlestick patterns in a row, the second with support from volume, strongly suggest a trend change here to either down or sideways. The last Bearish Engulfing candlestick pattern has support from volume.
Volume and ATR are both declining as price rises from the last swing low in November 2029. This upwards movement so far has some weakness and looks likely to be a counter trend movement. An inside week that has closed green and has weak volume does not change this view.
GDX DAILY CHART
Click chart to enlarge. Chart courtesy of StockCharts.com.
A very strong bearish candlestick after an extreme upwards trend, along with closure of the last gap (now renamed an exhaustion gap) and now two bearish signals from On Balance Volume and volume supporting downwards movement and not upwards, strongly suggest GDX has found a high.
Price is range bound. The volume profile during this consolidation is bearish. This consolidation may be a classic symmetrical triangle. The breakout from these patterns is upwards 54% of the time (Kirkpatrick and Dhalquist – “Technical Analysis”).
US OIL
Both Elliott wave counts this week have expected upwards movement and for price to remain above 49.32. This is exactly what has happened for the week.
Summary: Both the bullish and bearish Elliott wave counts now expect upwards movement. The target for the main bearish count is at 65.83.
MAIN ELLIOTT WAVE COUNT – BEARISH
MONTHLY CHART
Click chart to enlarge.
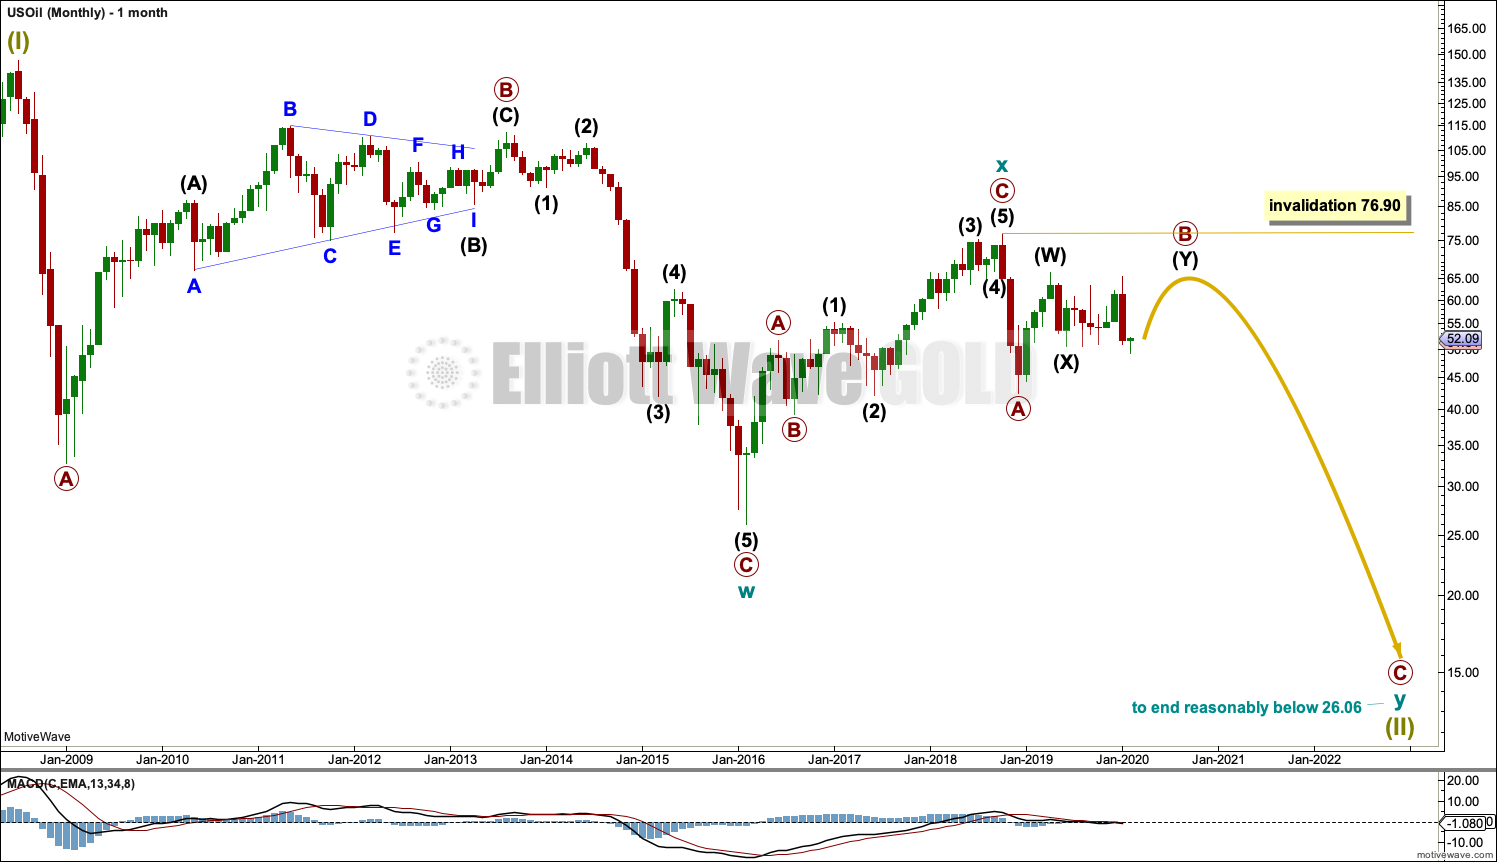
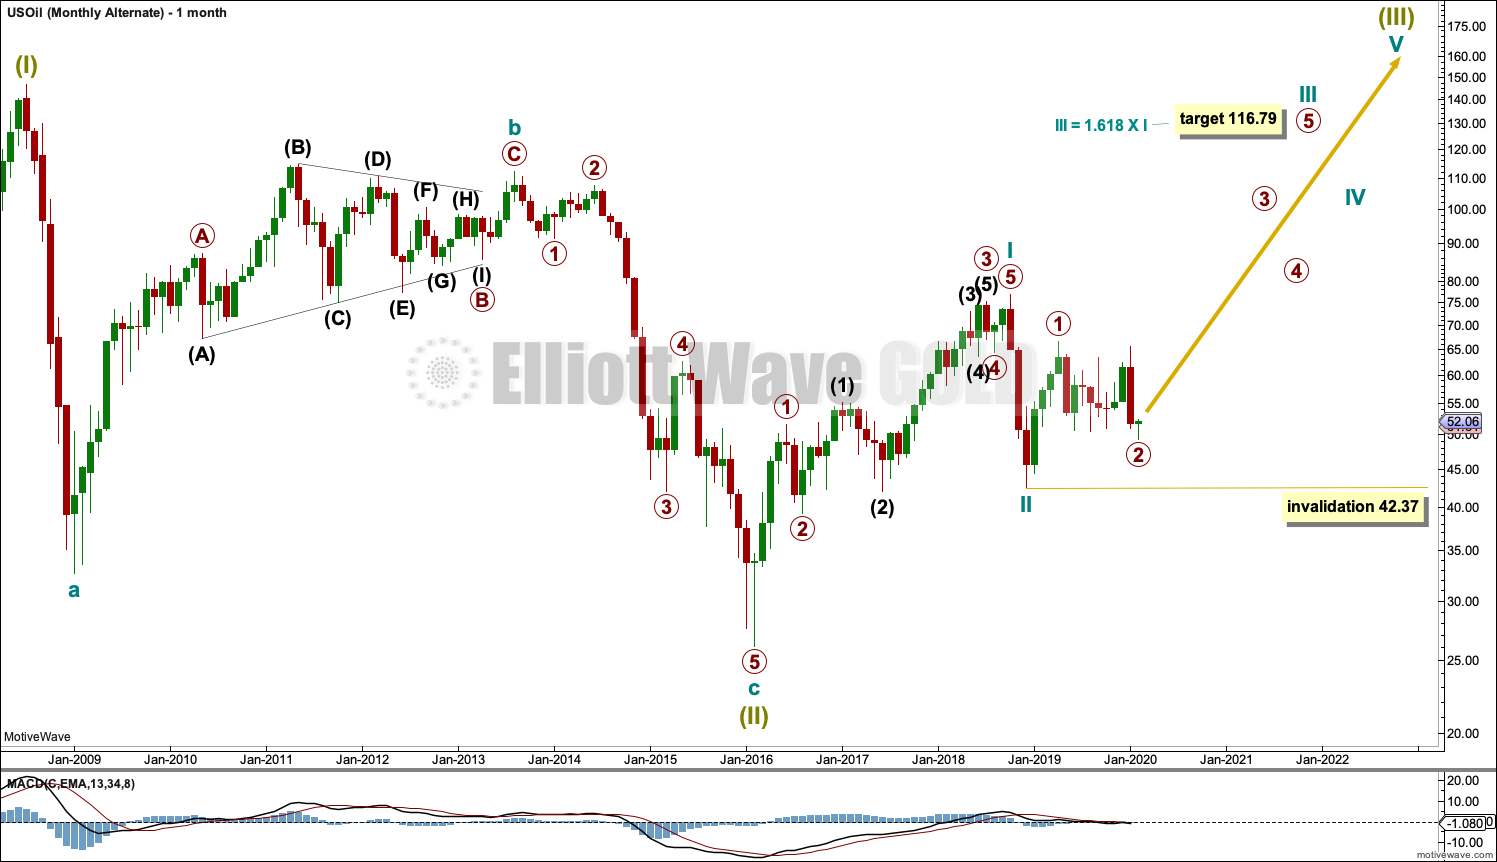
The basic Elliott wave structure is five steps forward and three steps back. This Elliott wave count expects that US Oil is still within a three steps back pattern, which began in July 2008. The Elliott wave count expects that the bear market for US Oil continues.
This Elliott wave corrective structure is a double zigzag, which is a fairly common structure. The correction is labelled Super Cycle wave (II).
The first zigzag in the double is complete and labelled cycle wave w. The double is joined by a three in the opposite direction labelled cycle wave x, which subdivides as a zigzag. The second zigzag in the double may now have begun, labelled cycle wave y.
The purpose of a second zigzag in a double zigzag is to deepen the correction when the first zigzag does not move price deep enough. To achieve this purpose cycle wave y may be expected to move reasonably below the end of cycle wave w at 26.06. When primary wave B may be complete then the start of primary wave C may be known and a target may be calculated.
Cycle wave y is expected to subdivide as a zigzag, which subdivides 5-3-5.
Cycle wave w lasted 7.6 years and cycle wave x lasted 2.7 years. Cycle wave y may be expected to last possibly about a Fibonacci 5 or 8 years.
Primary wave B may not move beyond the start of primary wave A above 76.90.
WEEKLY CHART
Click chart to enlarge.
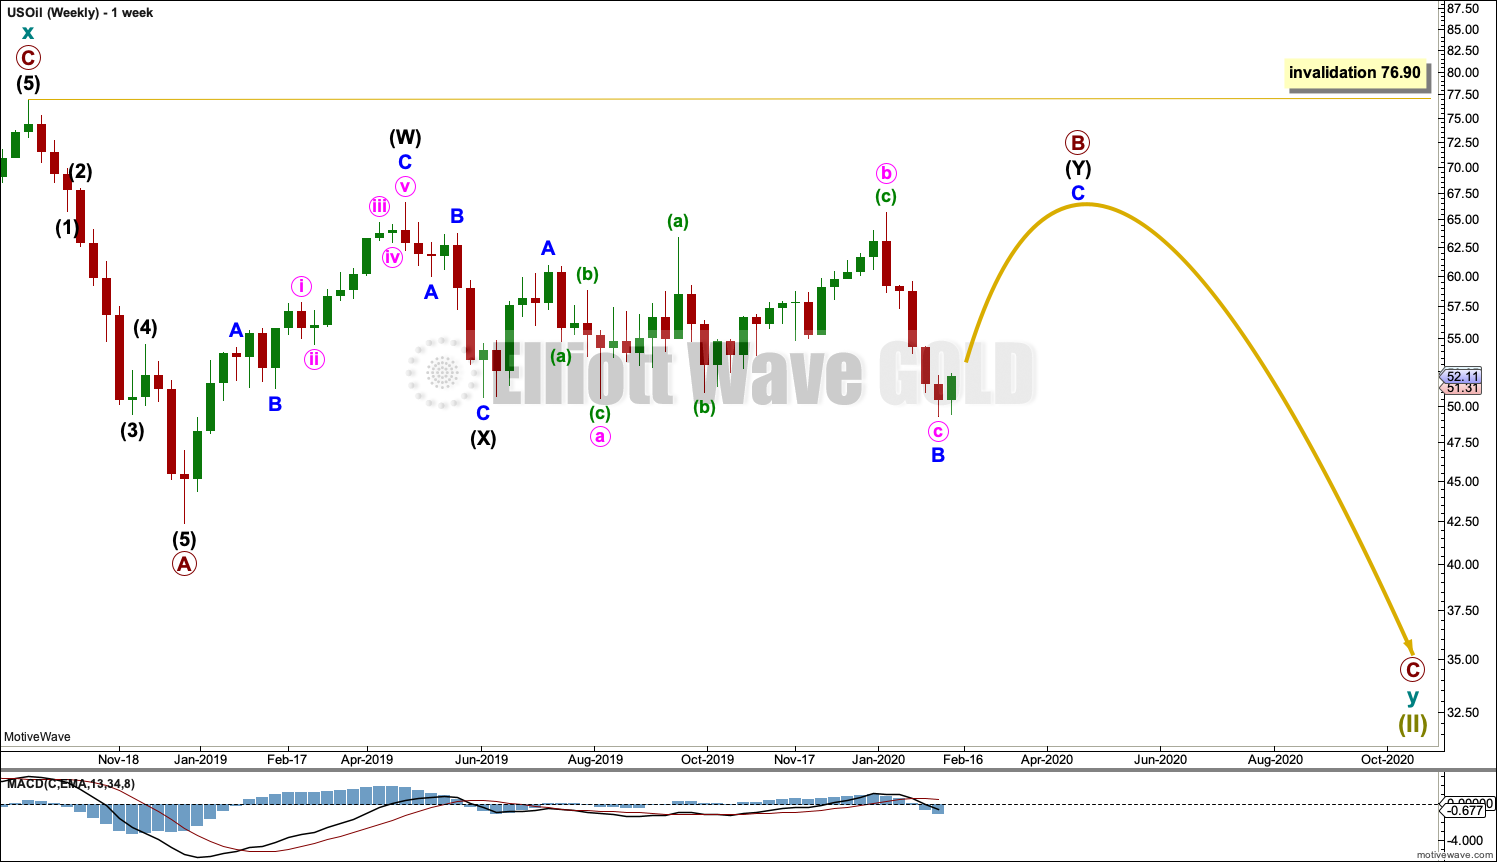
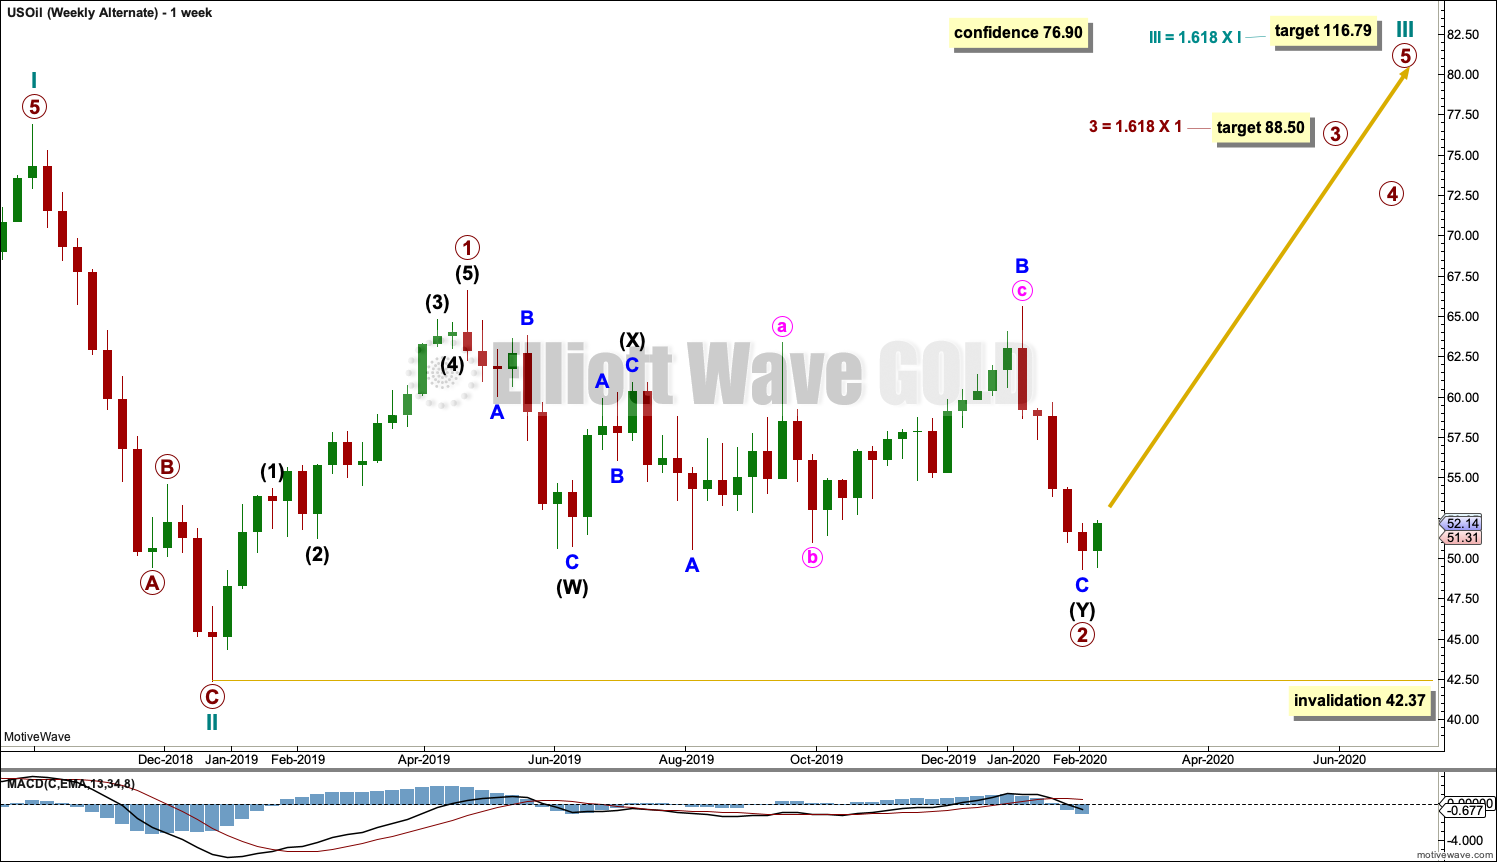
This weekly chart shows all of cycle wave y so far.
Cycle wave y is expected to subdivide as a zigzag. A zigzag subdivides 5-3-5. Primary wave A must subdivide as a five wave structure if this wave count is correct.
Primary wave A may be a complete five wave impulse at the last low.
Primary wave B may be a double combination: zigzag – X – flat. Intermediate wave (W) fits as a zigzag. Intermediate wave (Y) may be unfolding as a flat correction.
Within intermediate wave (Y), minor wave A may be complete. Minor wave B may be a complete expanded flat. Minor wave C may now move upwards to complete the flat correction of intermediate wave (Y).
Within the flat correction of intermediate wave (Y), minor wave C would be very likely to make at least a slight new high above the end of minor wave A at 60.93 to avoid a truncation and a very rare running flat.
When primary wave B may be complete, then a downwards breakout would be expected for primary wave C.
Primary wave B may not move beyond the start of primary wave A above 76.90.
DAILY CHART
Click chart to enlarge.
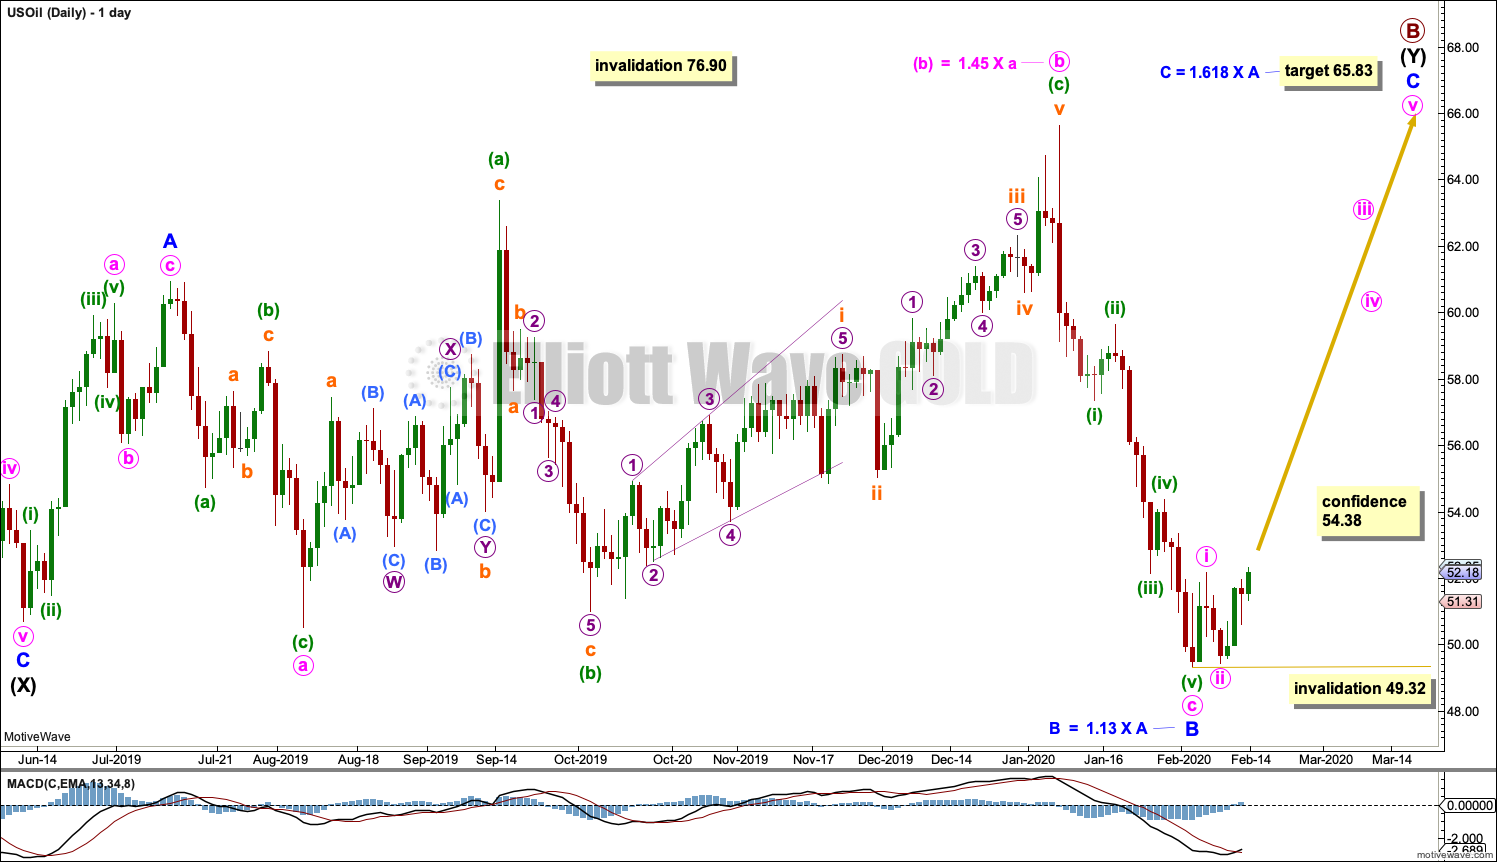
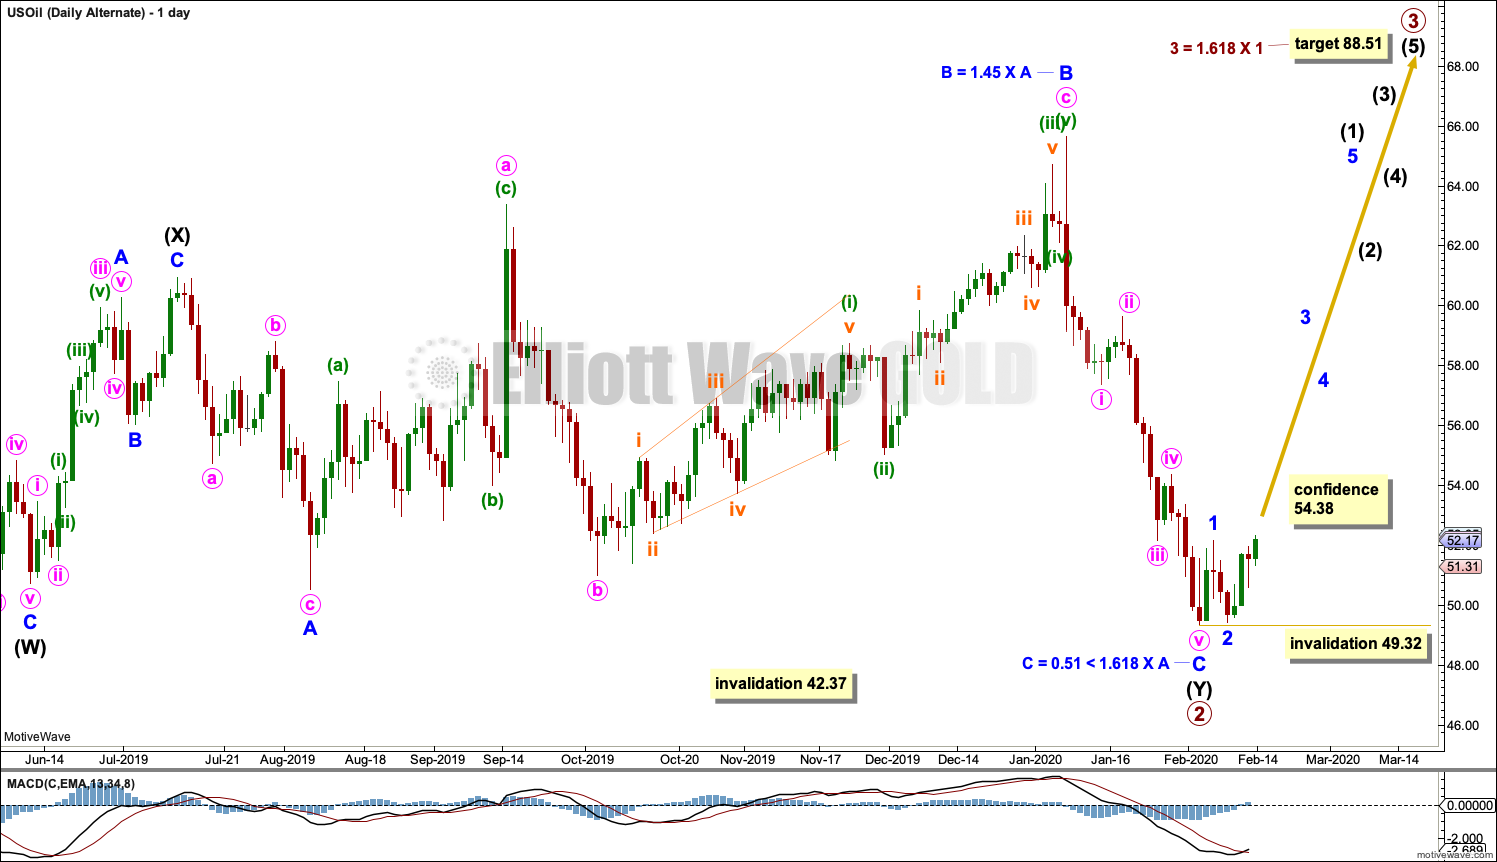
This daily chart shows all of intermediate wave (Y).
Intermediate wave (Y) may be subdividing as a flat correction. Within the flat, minor waves A and B both subdivide as threes. Minor wave B at 1.13 the length of minor wave A is within the most common range of 1 to 1.38. The target calculated for minor wave C expects it to exhibit the most common Fibonacci ratio to minor wave A.
A new high above 54.38 could not be a second wave correction within minuette wave (v) within minute wave c, so at that stage minute wave c and minor wave B would most likely be complete.
If minute wave ii within minor wave C continues lower, it may not move beyond the start of minute wave i below 49.32.
ALTERNATE ELLIOTT WAVE COUNT
MONTHLY CHART
Click chart to enlarge.
It is possible that the bear market is over for Oil and a new bull market has begun.
For a bullish wave count for Oil, the upwards wave from the major low at 26.06 in February 2016 must be seen as a complete five wave impulse. This is labelled cycle wave I.
Cycle wave II may be a complete zigzag at 0.679 the depth of cycle wave I.
A target is calculated for cycle wave III to reach a common Fibonacci ratio to cycle wave I.
Within cycle wave III, no second wave correction may move beyond the start of its first wave below 42.37.
WEEKLY CHART
Click chart to enlarge.
Cycle wave II does look best as a three. This is the only part of this wave count that has a better look than the main wave count, which sees this downwards wave as a five.
The upwards wave of primary wave 1 within cycle wave III must be seen as a five wave structure for a bullish wave count to work. This movement at lower time frames does not subdivide well as a five; this reduces the probability of this wave count.
Cycle wave III may only subdivide as an impulse. Within cycle wave III, so far primary waves 1 and 2 may be complete. If it continues any lower, then primary wave 2 may not move beyond the start of primary wave 1 below 42.37.
A target calculated for primary wave 3 expects it to exhibit a common Fibonacci ratio to primary wave 1.
DAILY CHART
Click chart to enlarge.
Primary wave 2 may now be a complete double combination.
The first structure in the double is a zigzag labelled intermediate wave (W). The double is joined by a three in the opposite direction labelled intermediate wave (X), which subdivides as a zigzag. The second structure in the double may now be a complete expanded flat labelled intermediate wave (Y).
The confidence point is the same for the same reason. If minor wave 2 within primary wave 3 continues lower, then it may not move beyond the start of minor wave 1 below 49.32.
TECHNICAL ANALYSIS
MONTHLY CHART
Click chart to enlarge. Chart courtesy of StockCharts.com.
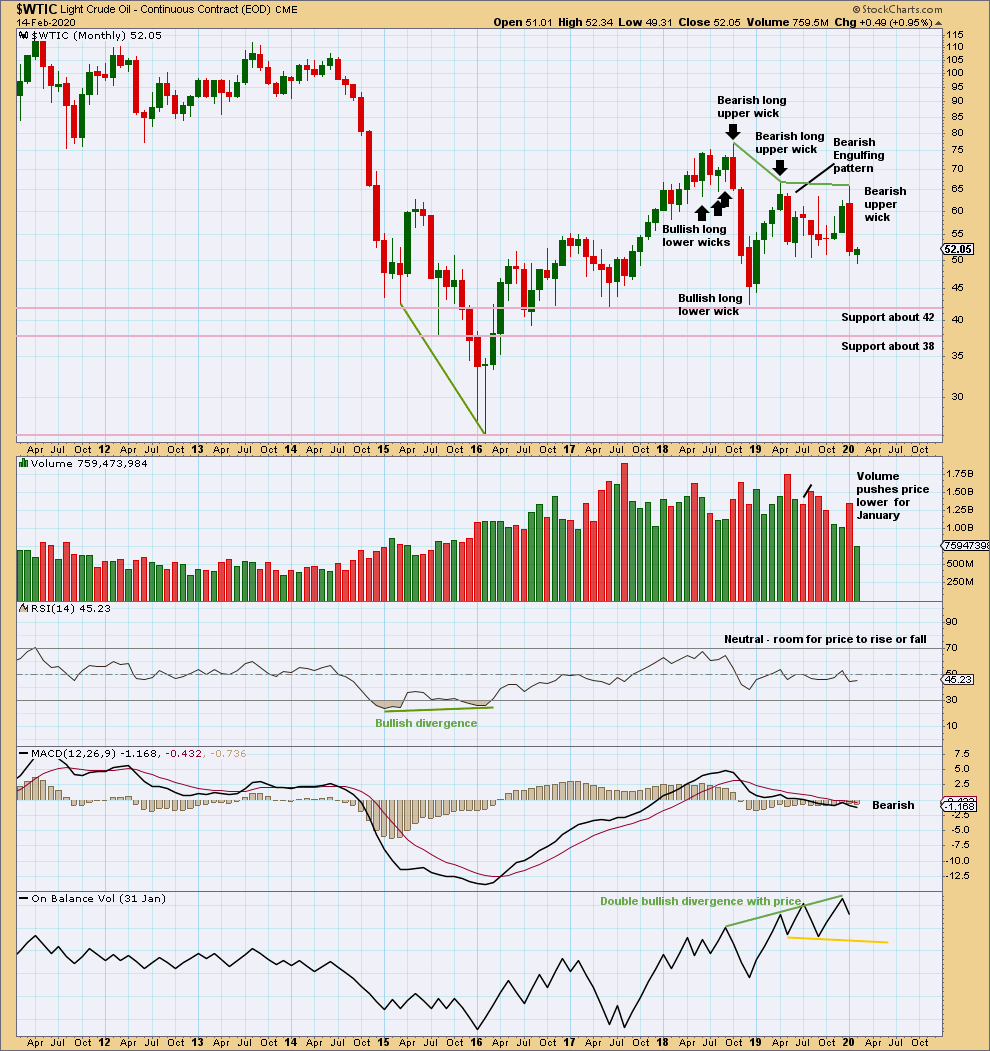
There is now double bullish divergence between price and On Balance Volume. This supports the alternate Elliott wave count.
Overall, price has been moving sideways for a few months now. Within this sideways movement, the downwards month of May has greatest range and volume; this supports the main Elliott wave count. Upwards movement for December lacks support from volume. Now downwards movement for January exhibits increased range and support from volume. The volume profile remains bearish; this supports the main Elliott wave count. More weight is given to this evidence than to divergence with On Balance Volume, as that tends to be a little less reliable.
WEEKLY CHART
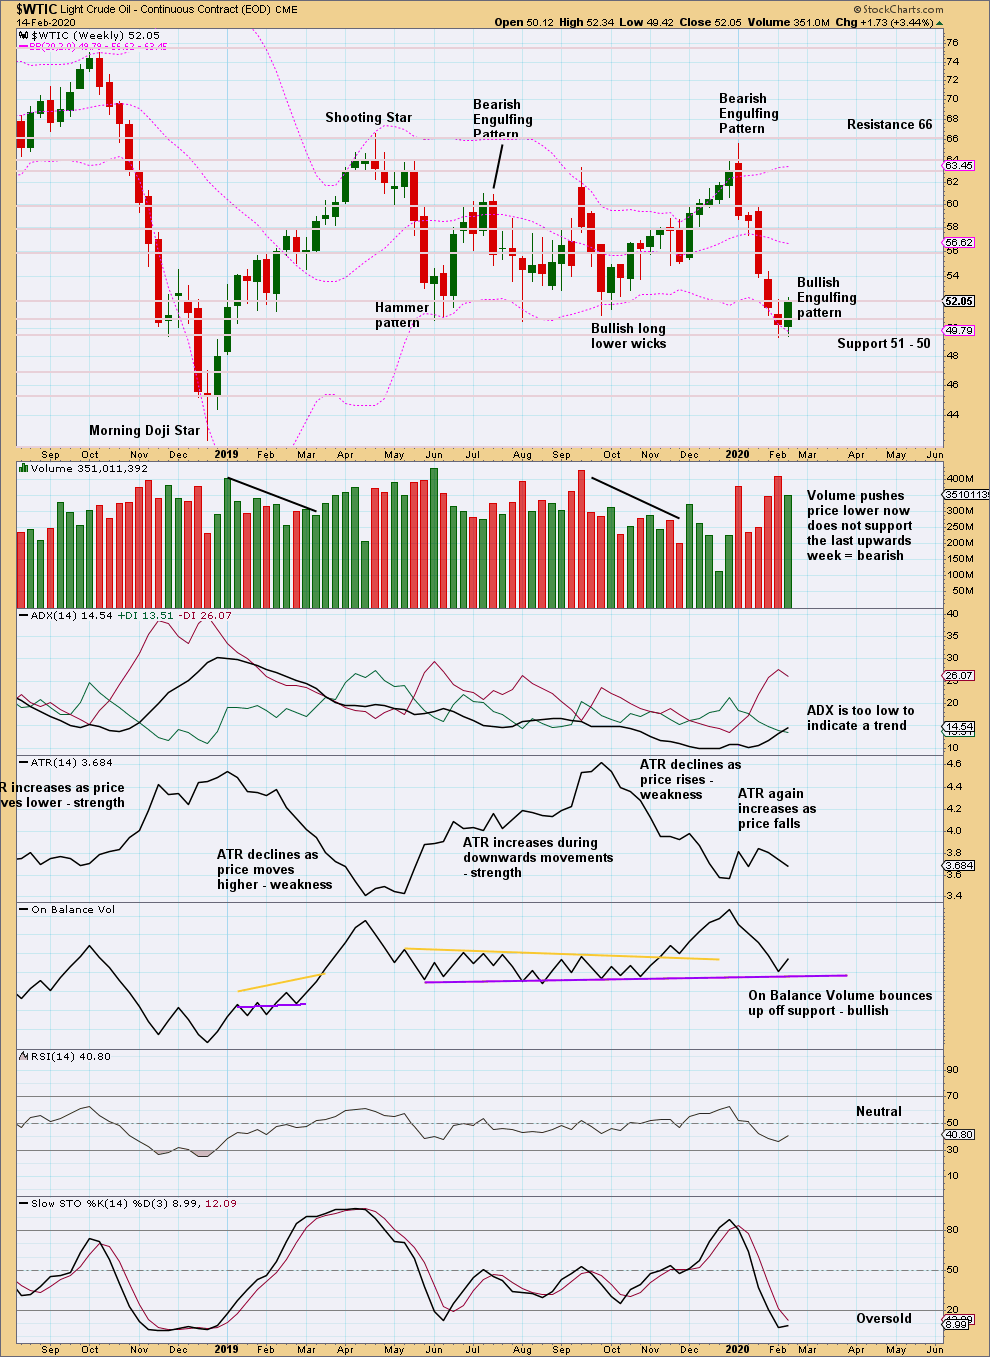
Click chart to enlarge. Chart courtesy of StockCharts.com.
Price is consolidating, swinging from support to resistance and back again. Support is about 50 – 51 and resistance is about 66. A downwards swing may now be over; price reached support and Stochastics reached oversold. A bullish signal this week from On Balance Volume is reasonable as the support line is long held, tested multiple times and close to horizontal. The resistance line no longer holds reasonable technical significance and so is shortened
It is now reasonable to expect an upwards swing to resistance has begun, indicated by a bullish candlestick pattern at support while Stochastics was oversold.
When price consolidates, each swing is normally very choppy and overlapping. Do not expect price to move in a straight line.
DAILY CHART
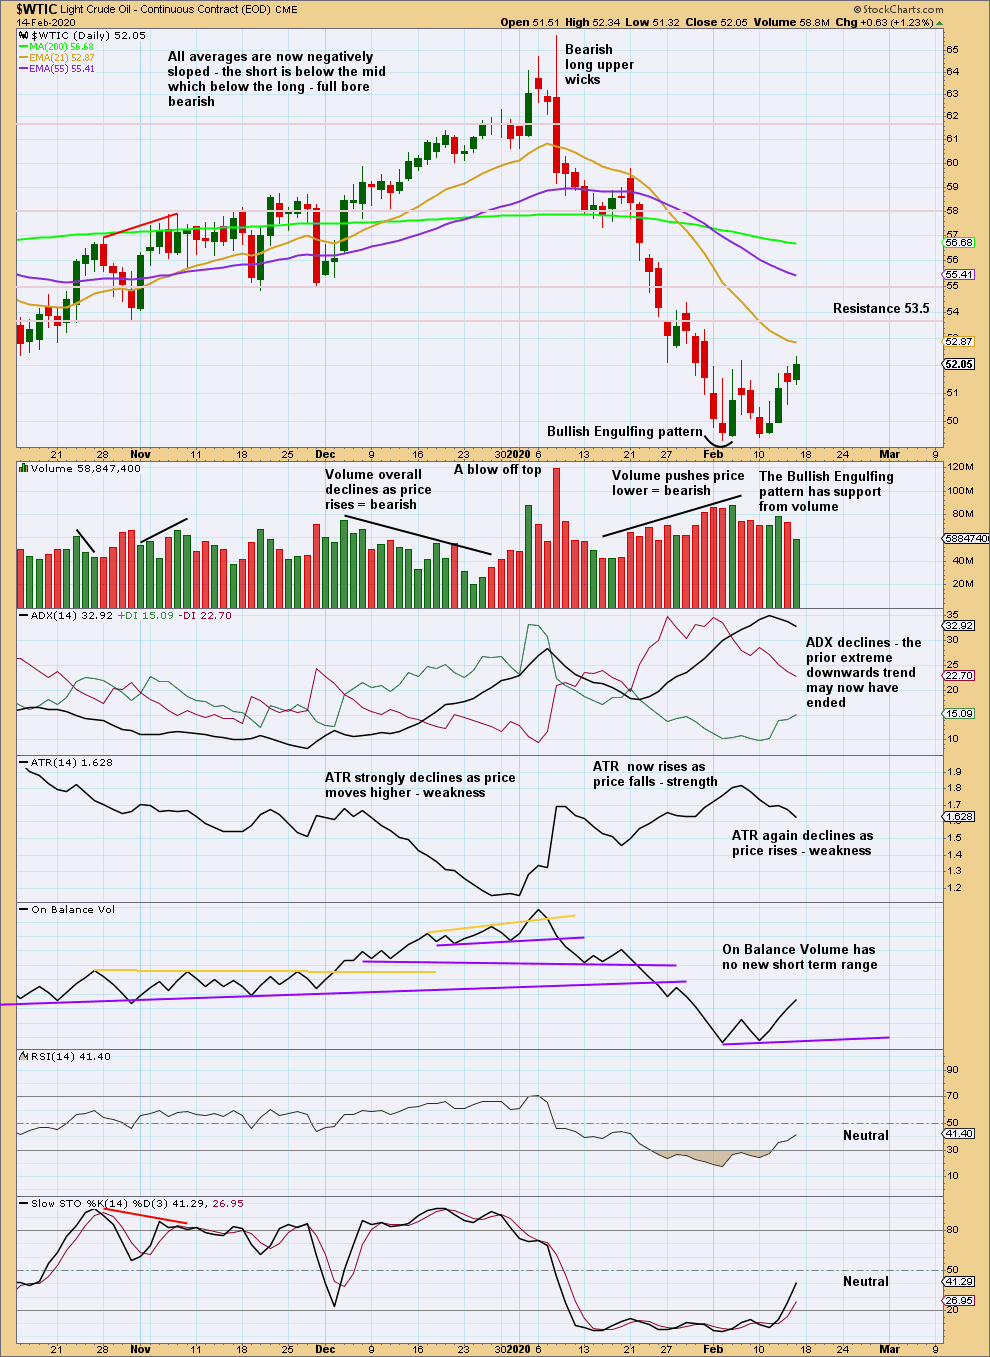
Click chart to enlarge. Chart courtesy of StockCharts.com.
The weekly time frame is best to view the larger consolidation. This daily time frame focusses more on each swing within the larger consolidation.
The downwards swing at this time frame is viewed as a downwards trend. The trend reached extreme. Stochastics and RSI reached oversold. Thereafter, a bullish candlestick reversal pattern that has support from volume suggests a trend change. This supports the Elliott wave analysis.
—
Always practice good risk management as the most important aspect of trading. Always trade with stops and invest only 1-5% of equity on any one trade. Failure to manage risk is the most common mistake new traders make.
Gold updated daily chart with a new target. It looks like its forming another blow off top.
The last blow off top was from 3rd to 8th Jan, you can see it on this chart labelled minor 5 of intermediate (3). It formed over four days.
That’s a really nice illustration of how blow off tops can form, they may not be a single day event but can continue for a few days.
This current day looks like it will close strongly, and so I’ll expect more upwards movement on Monday.
The new target for intermediate (5) to = intermediate (3) is also reasonably close to where primary C would = primary A at 1,736.
Conditions for Gold remain very extreme. This blow off top will reverse, the only question is exactly where and when.
To try and answer that question the earliest would be to draw a channel about it on an hourly chart. While price remains within that channel expect price to keep going up. If the channel is breached then it would be possible the blow off top may have ended.
Following blow off tops price turns and reverses very strongly. So look out below.
Lara,
The bullish wave chart, like the 1st bearish chart, had an invalidation point of 1,590.31. So now they are both invalidated ?
Does this mean we now have only the second bearish chart still valid or do we have the bullish chart also still valid? If bullish is still valid, then is the cycle wave IV (teal color) already done and we are now in cycle wave V ?
Thanks.
I’m assuming this is for Gold.
The alternate bear wave count is now the main wave count for Gold. Updated chart here.
Updated bull daily chart here
Thank you very much Lara. And, my mistake in not mentioning it was Gold, sorry.
Lara, Bitcoin may be topping here in Wave 1 up. Any thoughts for Wave 2 support levels? Thanks!
I’ll update Bitcoin later today. I’ll make it public.
I’m really sorry, but I’ve totally run out of time today. And I won’t have time tomorrow. And I may not next week… because… I’m in the process of emigrating.
OMG! I’ll swap you. Kiwi land one of the best places on earth! …and I’ve travelled to 42 countries.
Yeah, it’s pretty good.
I must be mad 🙂
But… the water is cold and the winters are too. Looking forward to some warm water surfing I am
Hi Lara!!!
US Oil touched 54.66 today but did not close above confidence # of 54.38. Am I correct that we have confirmation of the bullish confidence target on the daily chart?
Larry
You are correct.
A close is not necessary, because the EW rule I’m using here is any amount at any time frame; within minuette (v) of minute c of minor B, no second wave correction may move beyond the start of its first wave.
This question gets asked a fair amount actually, and so I’m wondering, is my explanation clear?
Much of general TA requires closing prices, but EW rules focus on price highs or lows.
Hi Lara,
It looks like intermediate 2 for btcusd has started. How long would you expect it to last?
on the GOLD daily , you ruled out a triangle? any opinion on tbonds, anyone?
The triangle doesn’t look any better than the alternate, so yes, I didn’t publish the idea.
It’s technically viable, but the probability is about the same as the alternate.