
Lara’s Weekly: Elliott Wave and Technical Analysis of S&P500 and Gold and US Oil | Charts – August 21, 2020

S&P 500
Upwards movement continues.
A new alternate Elliott wave count is published this week.
Summary: Upwards movement may still complete prior to 3,432.15. However, if price passes 3,432.15, then a target for upwards movement to end would be at 3,800.
Confidence points for downwards movement are 2,954.86 and 2,637.01. Further confidence in a sustainable high may be had as each price point is passed.
A new low below 2,191.86 would be extremely bearish.
The biggest picture, Grand Super Cycle analysis, is here.
Last monthly charts are here. Video is here.
ELLIOTT WAVE COUNTS
FIRST WAVE COUNT
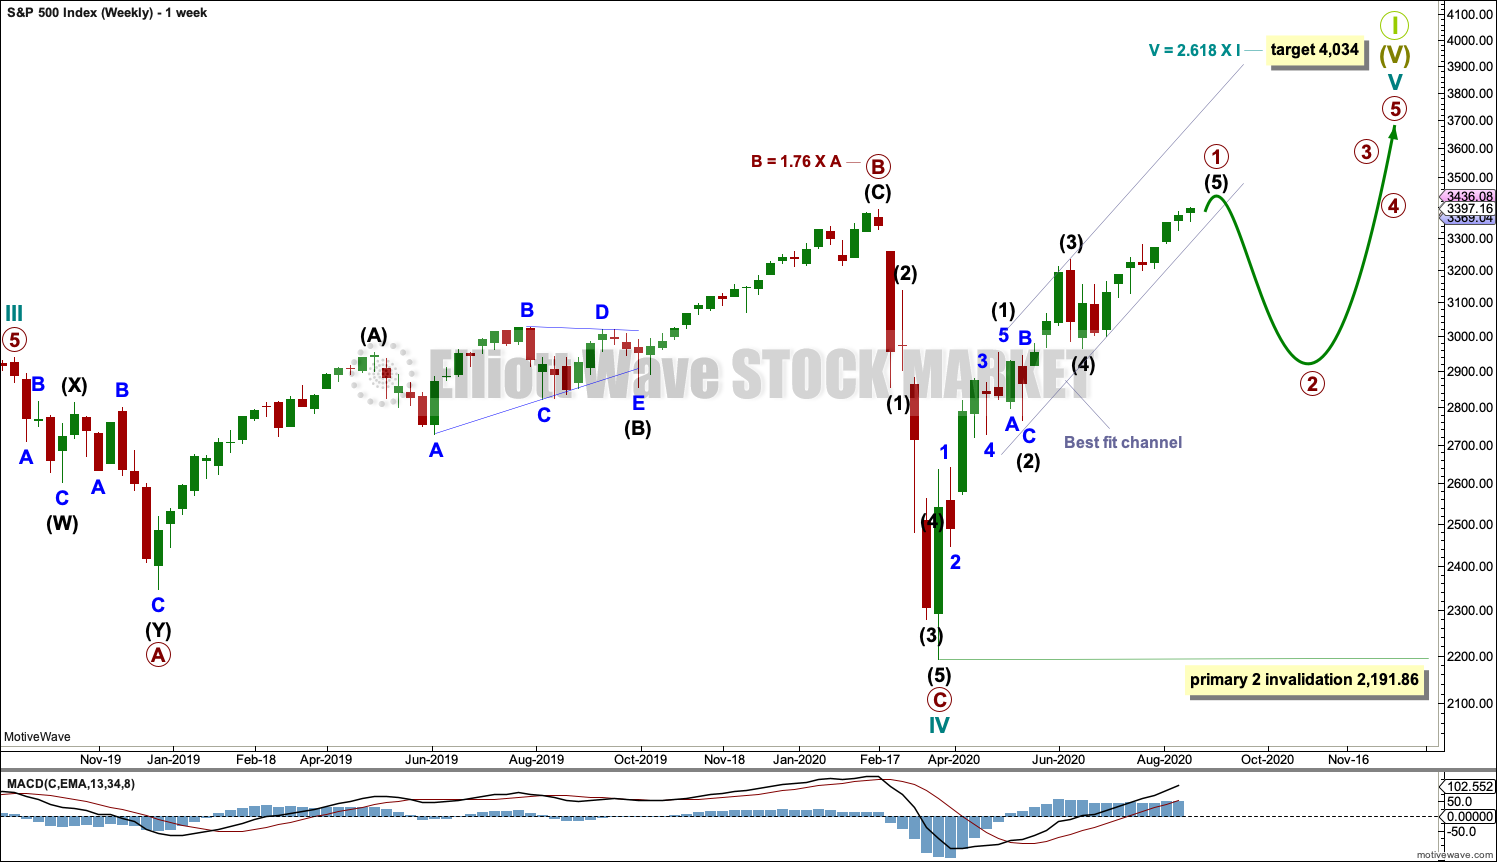
WEEKLY CHART
Click chart to enlarge.
Cycle wave V may last from one to several years.
Cycle wave V may be underway and would most likely subdivide as an impulse. But if overlapping develops, then an ending diagonal should be considered. This chart considers the more common impulse.
Primary wave 1 may be incomplete. Primary wave 2 may not move beyond the start of primary wave 1 below 2,191.86.
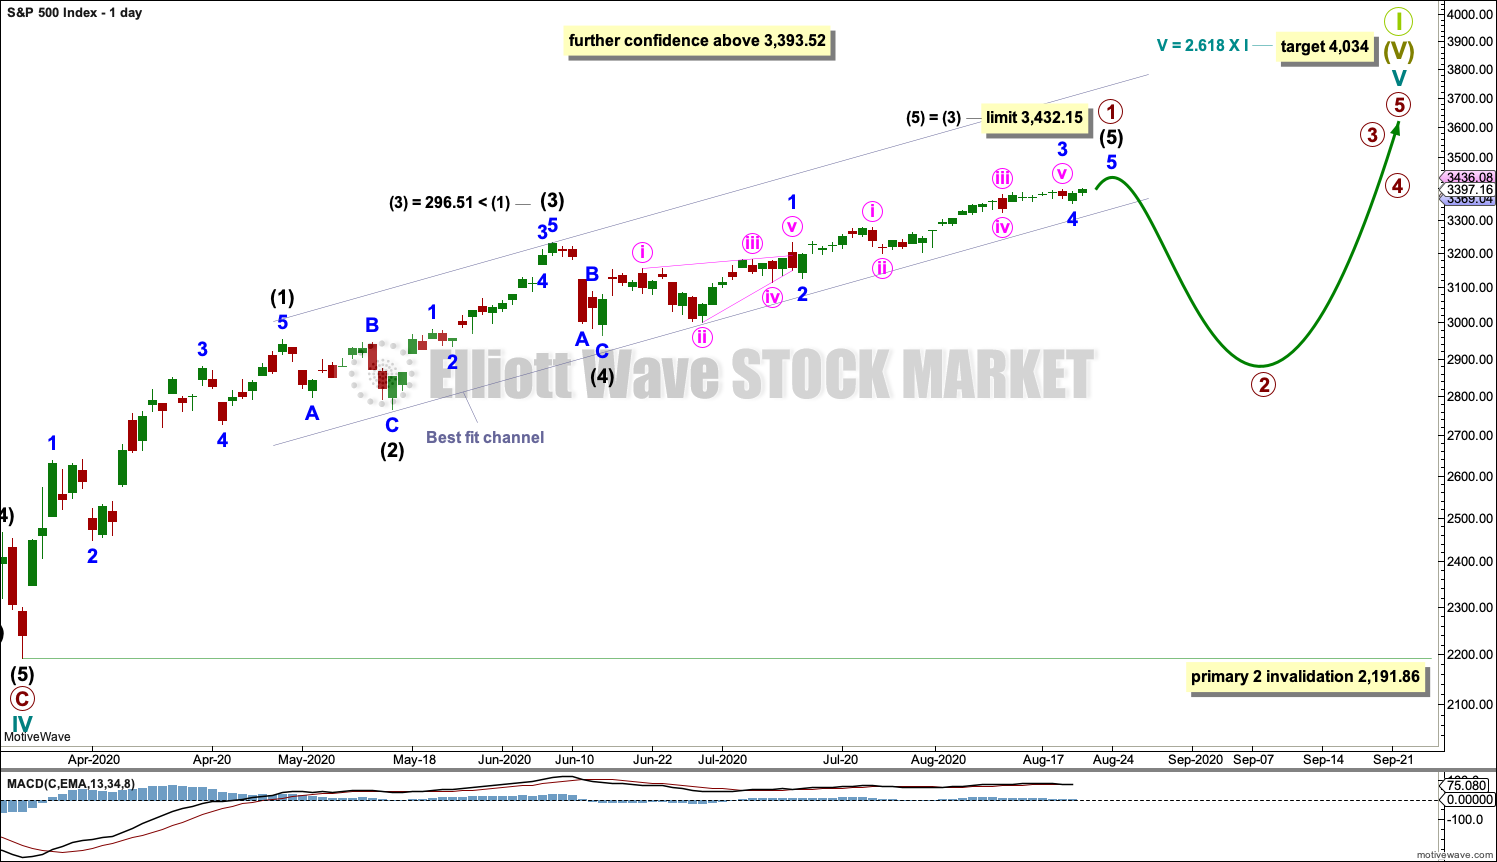
DAILY CHART
Click chart to enlarge.
The target for the end of this bull market is provisional. It would best be calculated at primary degree, but that cannot be done until all of primary waves 1 through to 4 are complete. At that stage, the target will be recalculated and will very likely change.
Cycle wave V must subdivide as a five wave motive structure, most likely an impulse.
Primary wave 1 must end before or at 3,432.15 where intermediate wave (5) would reach equality in length with intermediate wave (3). Intermediate wave (3) is shorter than intermediate wave (1), so it may not be the shortest actionary wave.
Primary wave 2 may unfold as a multi-week pullback and may not move beyond the start of primary wave 1 below 2,191.86.
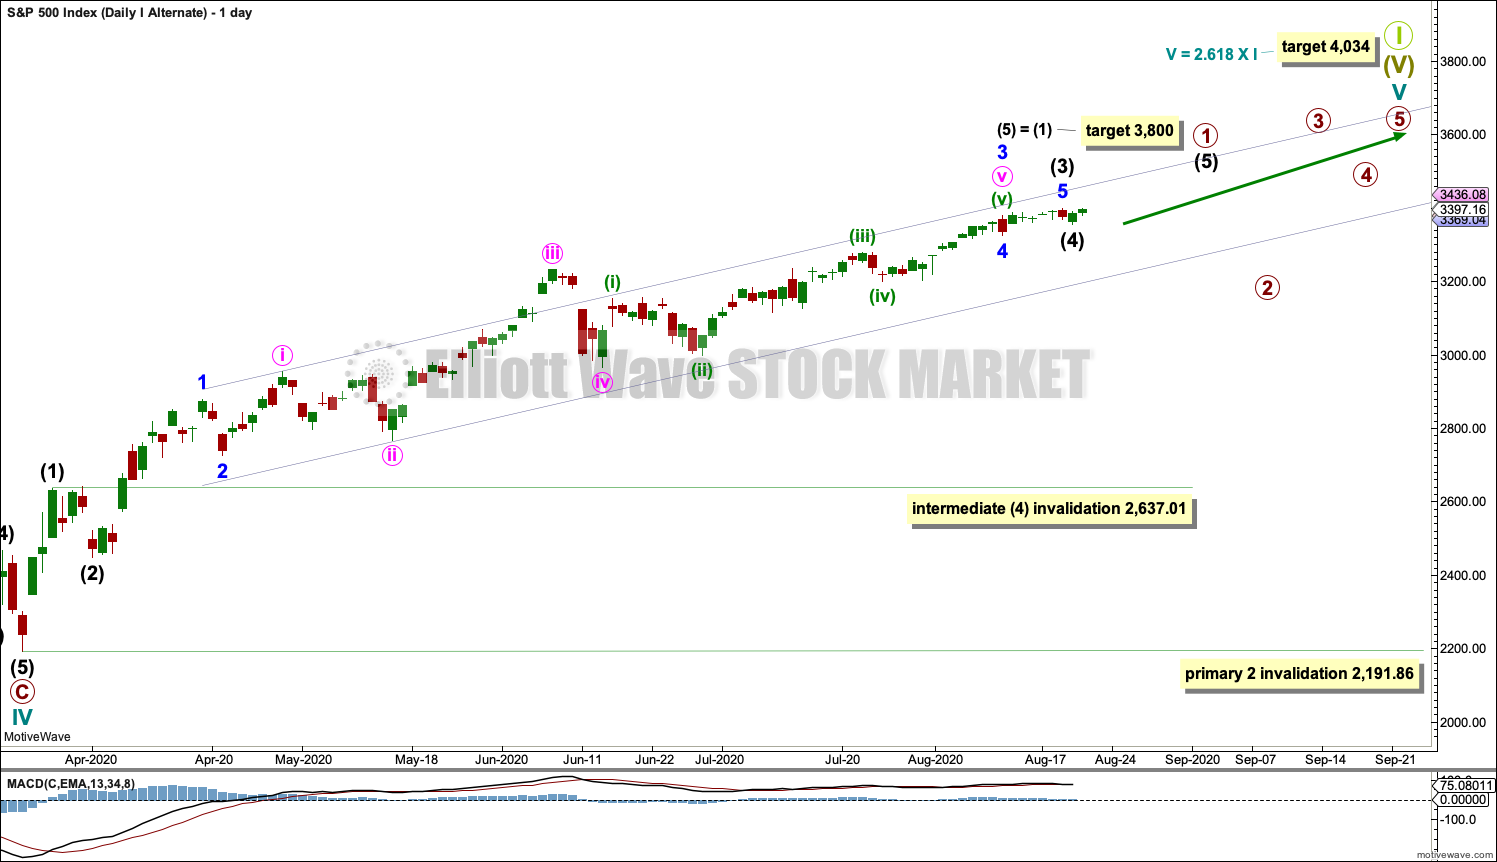
ALTERNATE DAILY CHART
Click chart to enlarge.
This wave count is new. It labels primary wave 1 differently.
It is possible to see primary wave 1 as an impulse in which intermediate wave (3) is longer than intermediate wave (1).
This wave count breaks up the first impulse up. The main daily chart sees intermediate wave (1) ending on the 29th of April whereas this alternate sees this as a series of first and second waves. This upwards movement looks best labelled as one complete impulse, which the main daily chart does, so this alternate has a lower probability.
A target is calculated for intermediate wave (5) based upon the most common Fibonacci ratio to intermediate wave (1).
If intermediate wave (4) continues further, then it may not move into intermediate wave (1) price territory below 2,637.01. If intermediate wave (4) continues lower, then it would most likely find support about the lower edge of the best fit channel. This wave count would be discarded long before it would be invalidated based upon the wrong look.
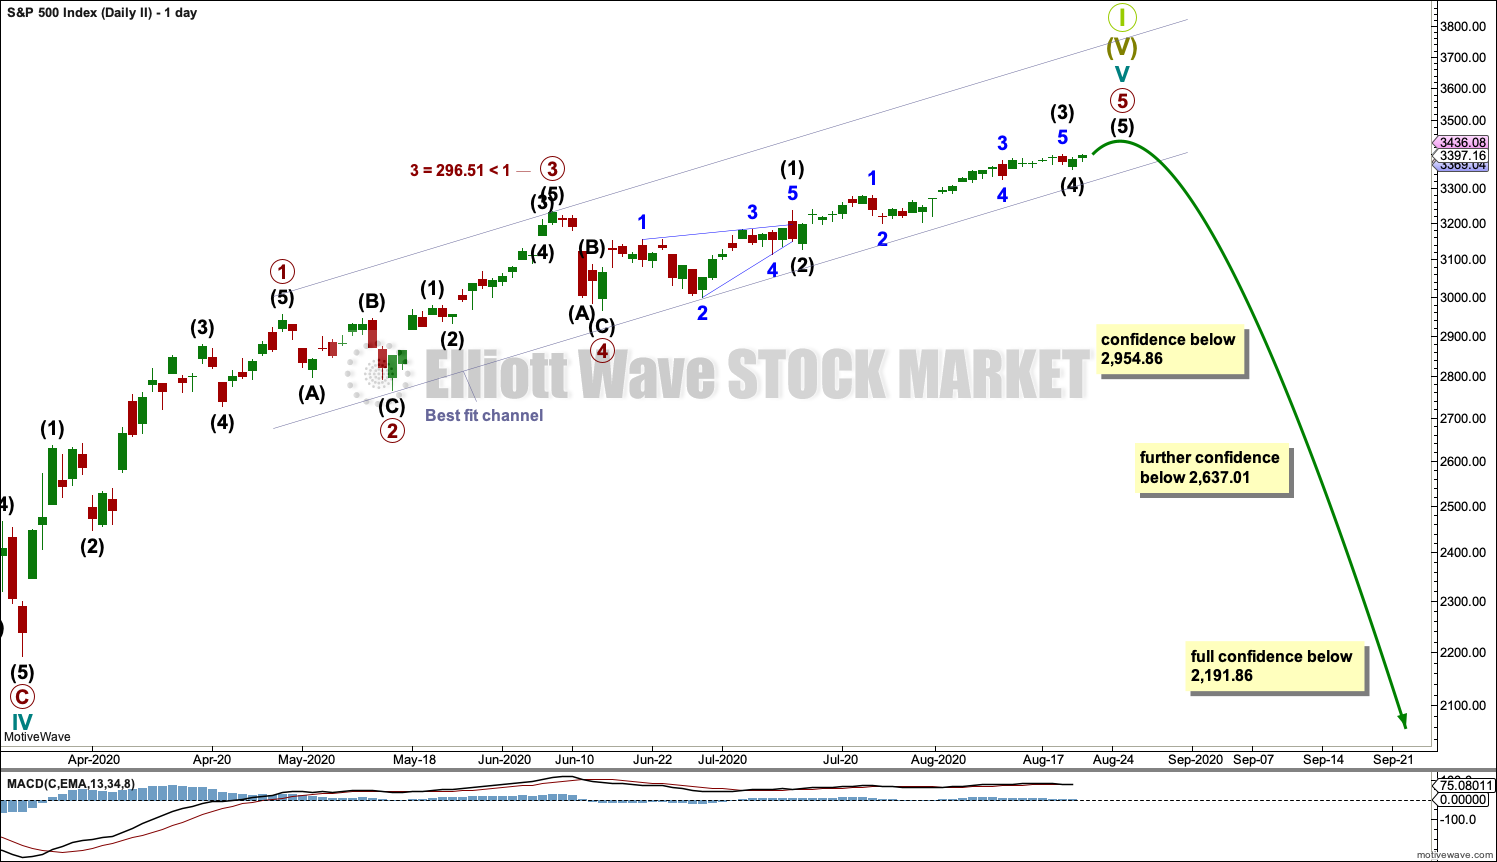
SECOND WAVE COUNT
DAILY CHART
Click chart to enlarge.
This wave count is the same as the first wave count with the exception of the degree of labelling within cycle wave V. If the degree of labelling is moved up one degree, then it is possible that cycle wave V to end Super cycle wave (V) to end Grand Super Cycle wave I is very close to completion.
Primary waves 1 through to 4 within cycle wave V may be complete. Primary wave 5 may be almost complete.
A new low below 2,191.86 would invalidate the first wave count and provide full confidence in this second wave count.
Cycle wave V has moved above the end of cycle wave I at 2,940.91, avoiding a truncation. It has now also moved beyond the price territory of cycle wave IV to a new all time high above 3,393.52.
The alternate daily chart for the first wave count works in the same way for this second wave count. The limit is removed; it may be passed and this wave count would remain valid. If the limit is passed, then cycle wave V would be labelled in the same way as the alternate daily chart above.
TECHNICAL ANALYSIS
WEEKLY CHART
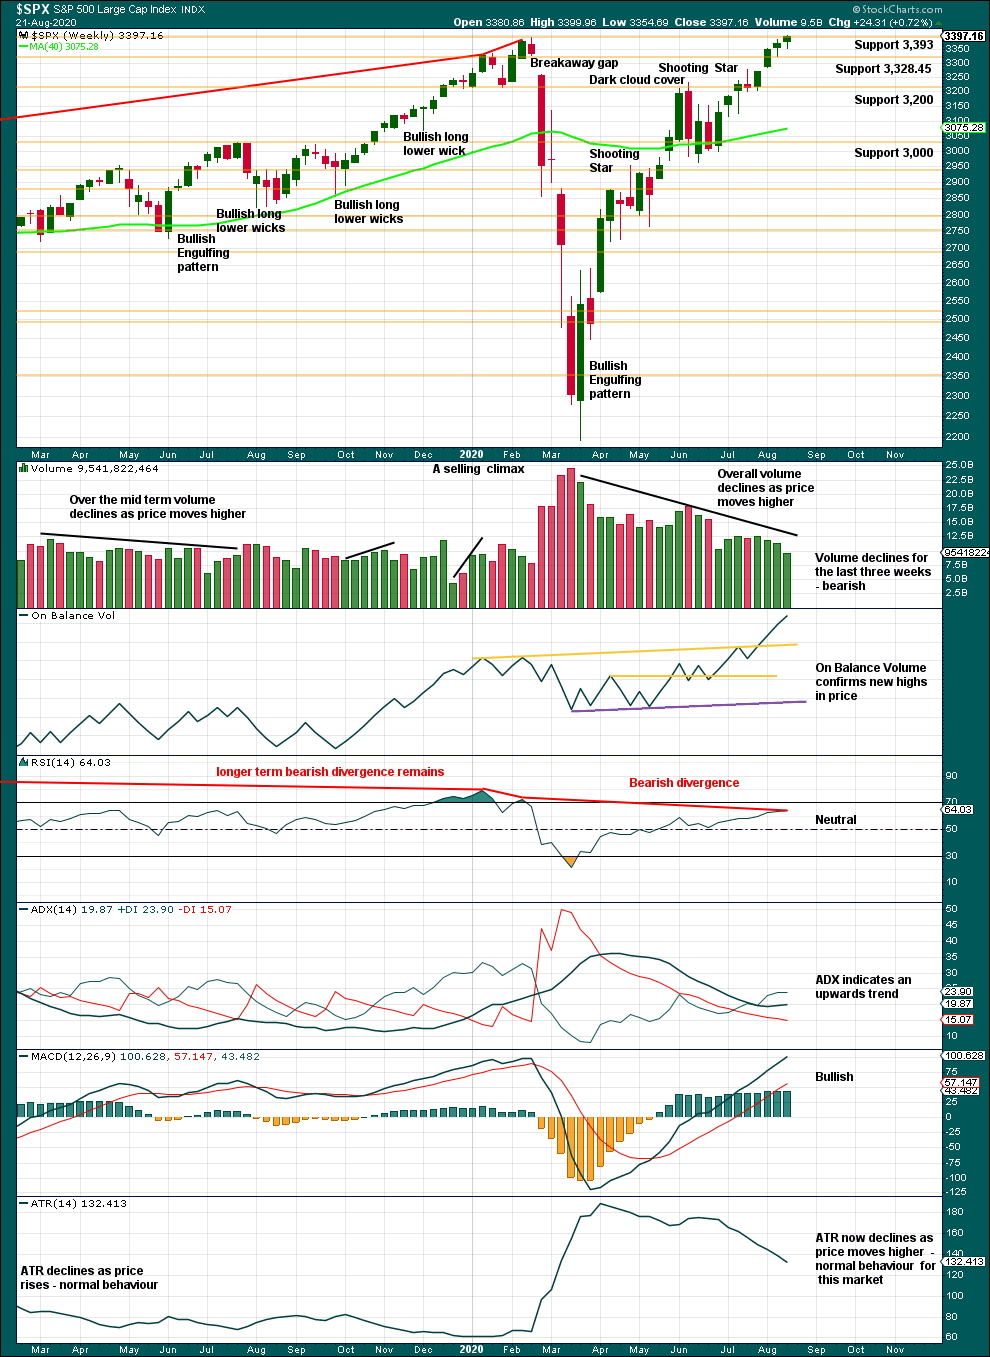
Click chart to enlarge. Chart courtesy of StockCharts.com.
A further decline in range and volume this week indicates weakness. This week has closed above the prior all time high at 3,393.52. Now that this has been breached, it is possible that some energy may be released and price may move up with a little more strength.
RSI is not overbought, but it does exhibit bearish divergence with price. Sometimes this can disappear, but it is often a signal of weakness and appears before a sustainable high.
For the short term, a close near highs for the week and a slightly bullish lower wick suggest more upwards movement next week.
DAILY CHART
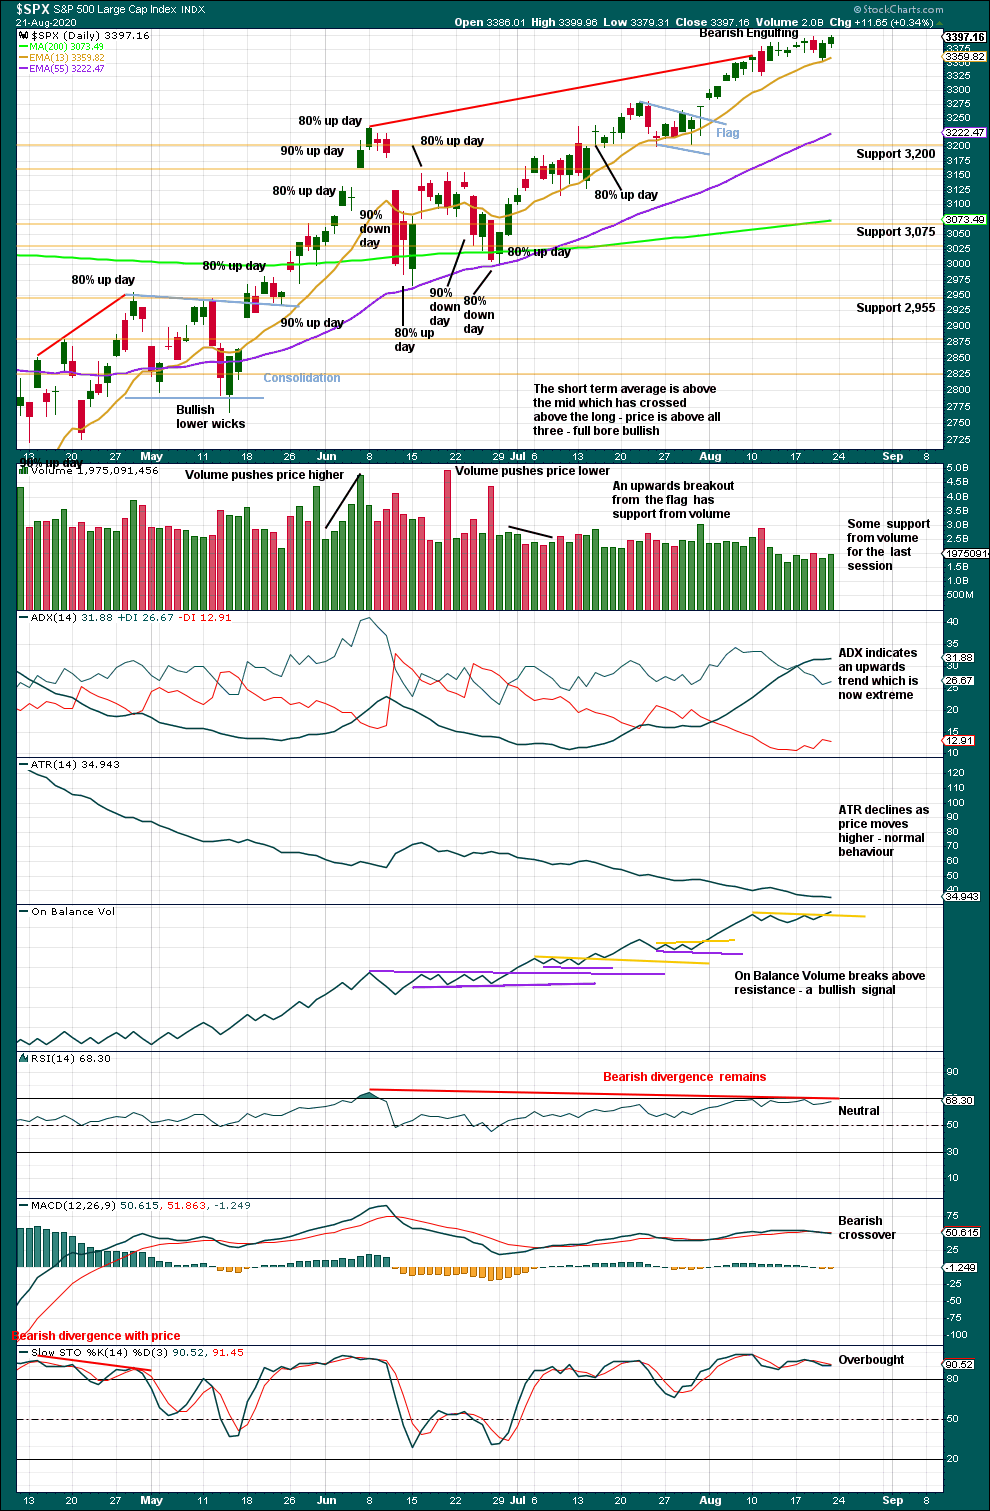
Click chart to enlarge. Chart courtesy of StockCharts.com.
A target from the flag pole would be at 3,405. This has been almost met.
A Bearish Engulfing candlestick pattern has appeared for the second time in recent price history (on the 11th and 19th of August) and yet price continues higher.
Risk of a multi-week pullback is still high. ADX is extreme and RSI is near overbought and exhibits bearish divergence. However, there is at this stage no signal of a trend change.
Assume the trend remains the same, upwards, until proven otherwise.
BREADTH – AD LINE
WEEKLY CHART
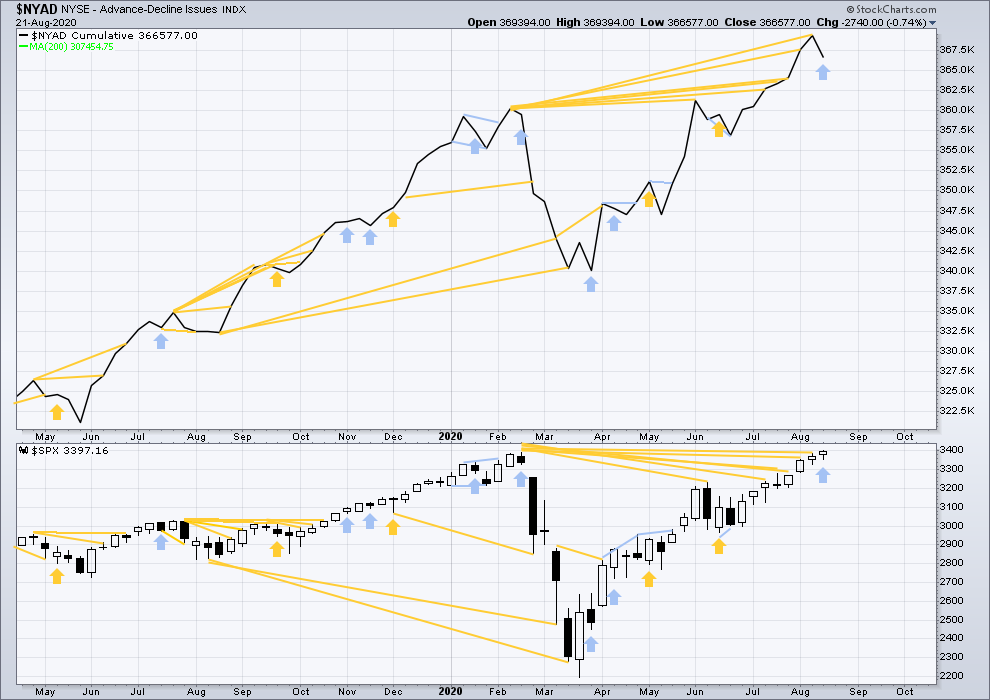
Click chart to enlarge. Chart courtesy of StockCharts.com. So that colour blind members are included, bearish signals will be noted with blue and bullish signals with yellow.
Breadth should be read as a leading indicator.
Lowry’s Operating Companies Only AD line has still not made new all time highs. The last high for the OCO AD line was in the week beginning January 13, 2020. There is now 7 months of bearish divergence between price and the OCO AD line. This may now support the more bearish second wave count. It is possible now that a major trend change may occur.
The NYSE All Issues AD line made new highs in the week beginning 1st of June.
This week price has continued higher, but the AD line has declined. This is a single week instance of bearish divergence.
Large caps all time high: 3,399.96 on 21st August 2020.
Mid caps all time high: 2,109.43 on 20th February 2020.
Small caps all time high: 1,100.58 on 27th August 2018.
This week only large caps have made new all time highs. This rise is led by large caps, which is a feature of an aged bull market.
DAILY CHART
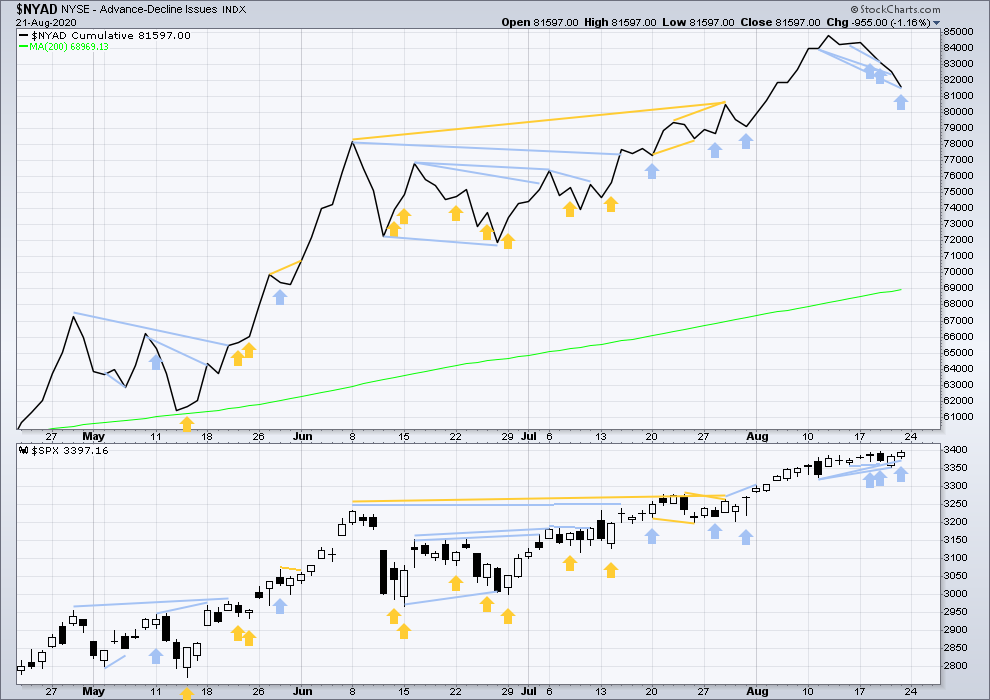
Click chart to enlarge. Chart courtesy of StockCharts.com. So that colour blind members are included, bearish signals will be noted with blue and bullish signals with yellow.
Price has moved higher on Friday, but the AD line has moved strongly lower to make another new low below the prior low of the 11th of August. This divergence is bearish. There is now a cluster of bearish signals from the AD line.
VOLATILITY – INVERTED VIX CHART
WEEKLY CHART
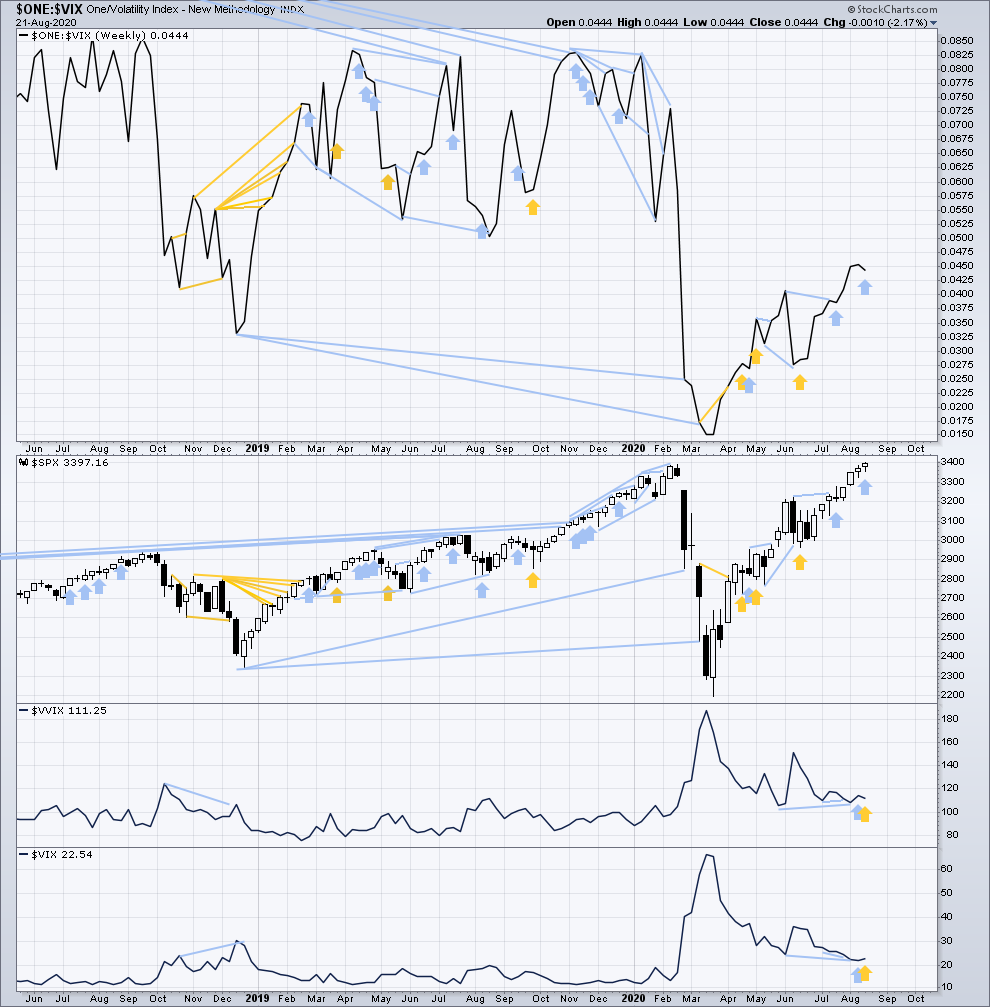
Click chart to enlarge. Chart courtesy of StockCharts.com. So that colour blind members are included, bearish signals will be noted with blue and bullish signals with yellow.
Inverted VIX remains well below all time highs. There remains over two years of strong bearish divergence between price and inverted VIX.
This week price has moved higher, but inverted VIX has moved lower. This divergence is bearish.
Comparing VIX and VVIX: From weeks beginning 1st June to last week, VIX has made new lows as price has made new highs, but VVIX has failed to make corresponding new lows with VIX. VVIX remains slightly elevated. This divergence is not strong, but it is bearish for price.
This week VIX has moved higher, but VVIX has moved lower. This divergence is bullish for price for the short term.
DAILY CHART
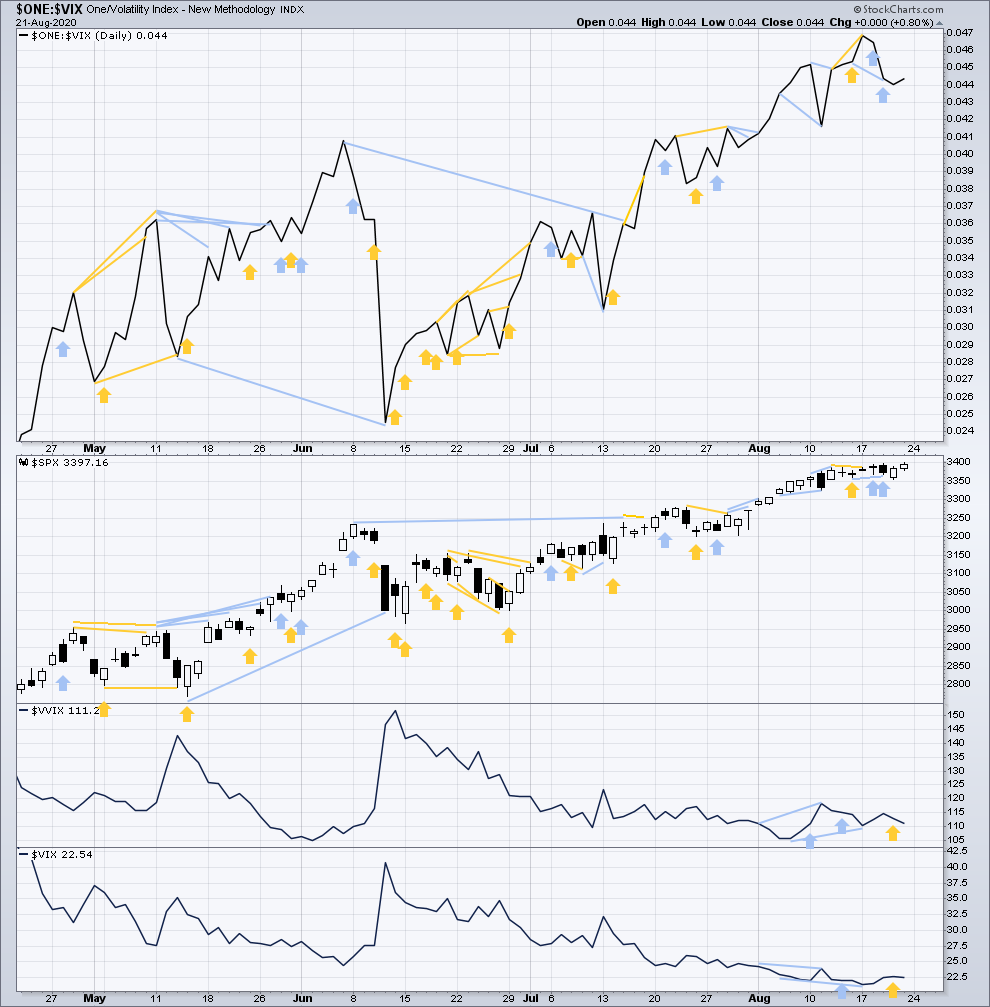
Click chart to enlarge. Chart courtesy of StockCharts.com. So that colour blind members are included, bearish signals will be noted with blue and bullish signals with yellow.
Today both price and inverted VIX have moved higher. There is no new short-term divergence. There is still a cluster of three bearish signals.
Comparing VIX and VVIX at the daily chart level: VIX is making new lows, but VVIX remains slightly elevated. This divergence is bearish.
DOW THEORY
Dow Theory still concludes a bear market is in place.
DJIA DAILY CHART
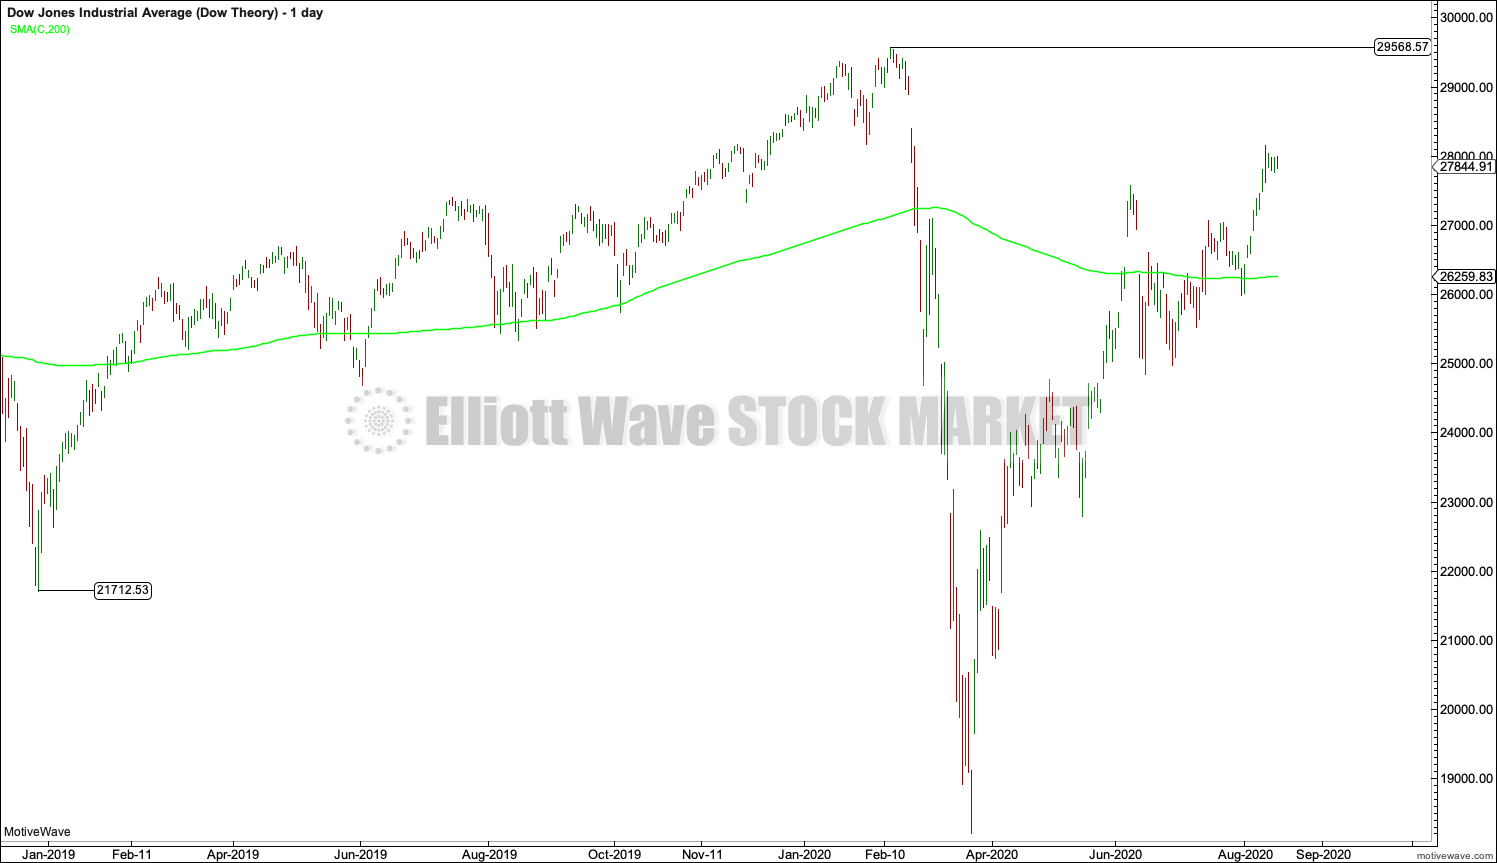
Dow Theory confirmed a bear market with the following low made on a closing basis:
DJIA: 21,712.53 – a close below this point was been made on the March 12, 2020.
At this time, to shift Dow Theory from viewing a bear market to confirmation of a new bull market would require new highs made on a closing basis:
DJIA: 29,568.57
DJT DAILY CHART
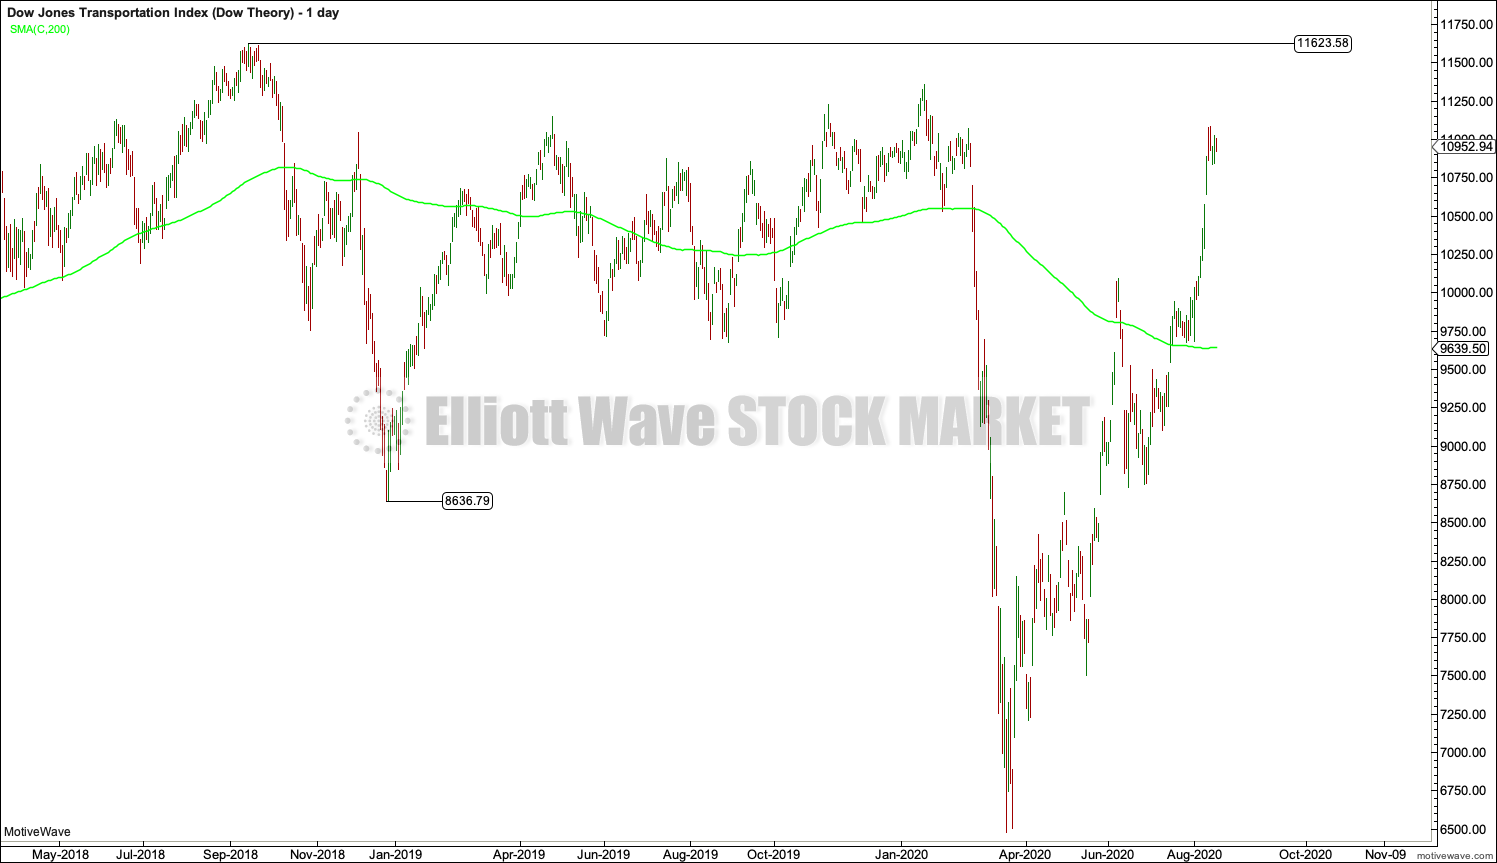
Dow Theory confirmed a bear market with the following low made on a closing basis:
DJT: 8,636.79 – a close below this point was been made on March 9, 2020.
At this time, to shift Dow Theory from viewing a bear market to confirmation of a new bull market would require new highs made on a closing basis:
DJT: 11,623.58
SPX DAILY CHART
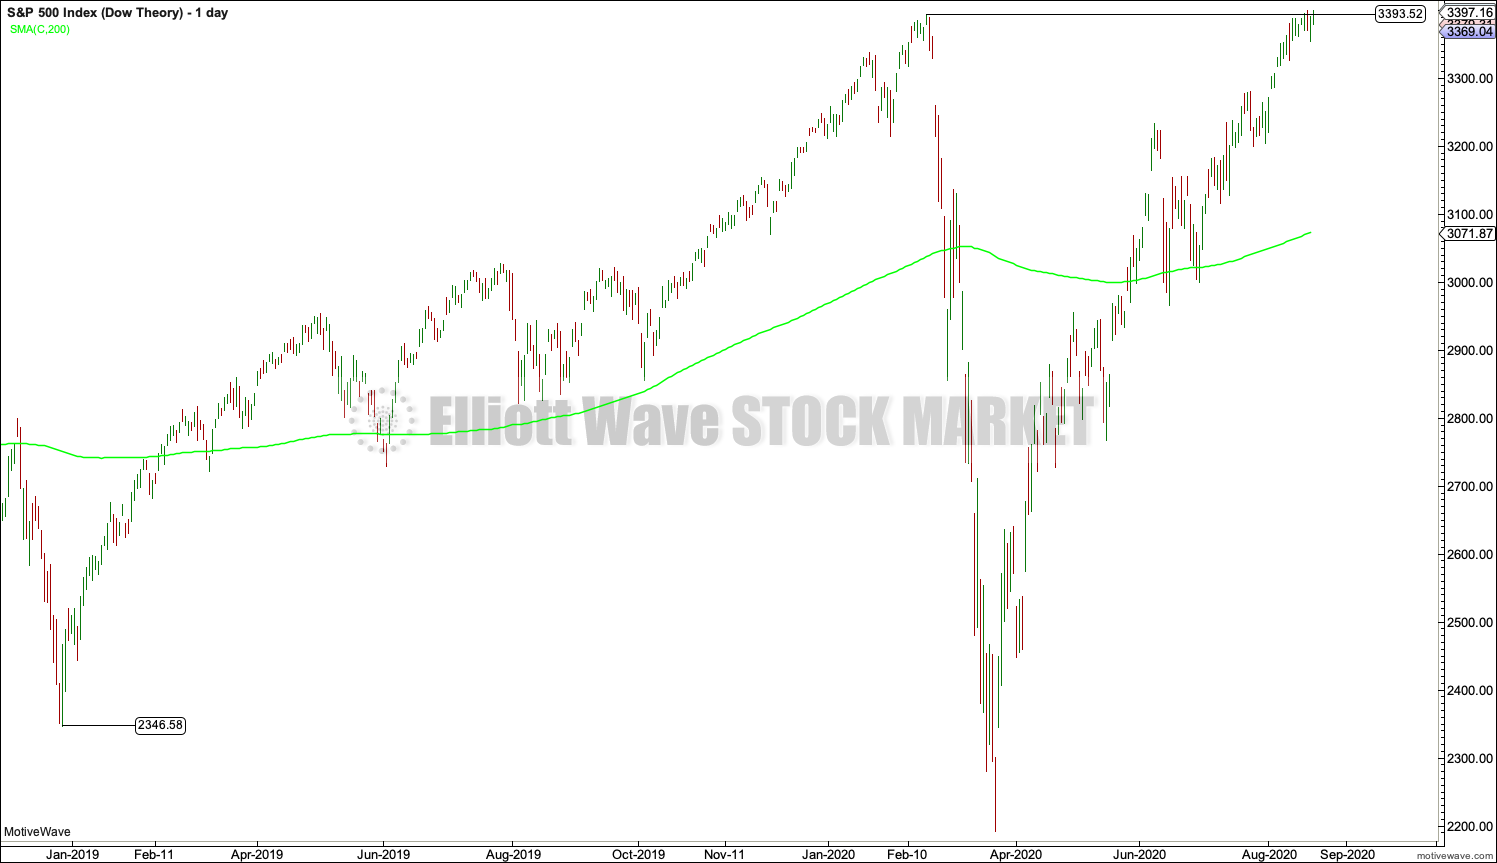
Adding in the S&P and Nasdaq for an extended Dow Theory, a bear market was confirmed:
S&P500: 2,346.58 – a close below this point was made on March 20, 2020.
At this time, to shift Dow Theory from viewing a bear market to confirmation of a new bull market would require new highs made on a closing basis:
S&P500: 3,393.52 – closed above on 21st August 2020.
NASDAQ DAILY CHART
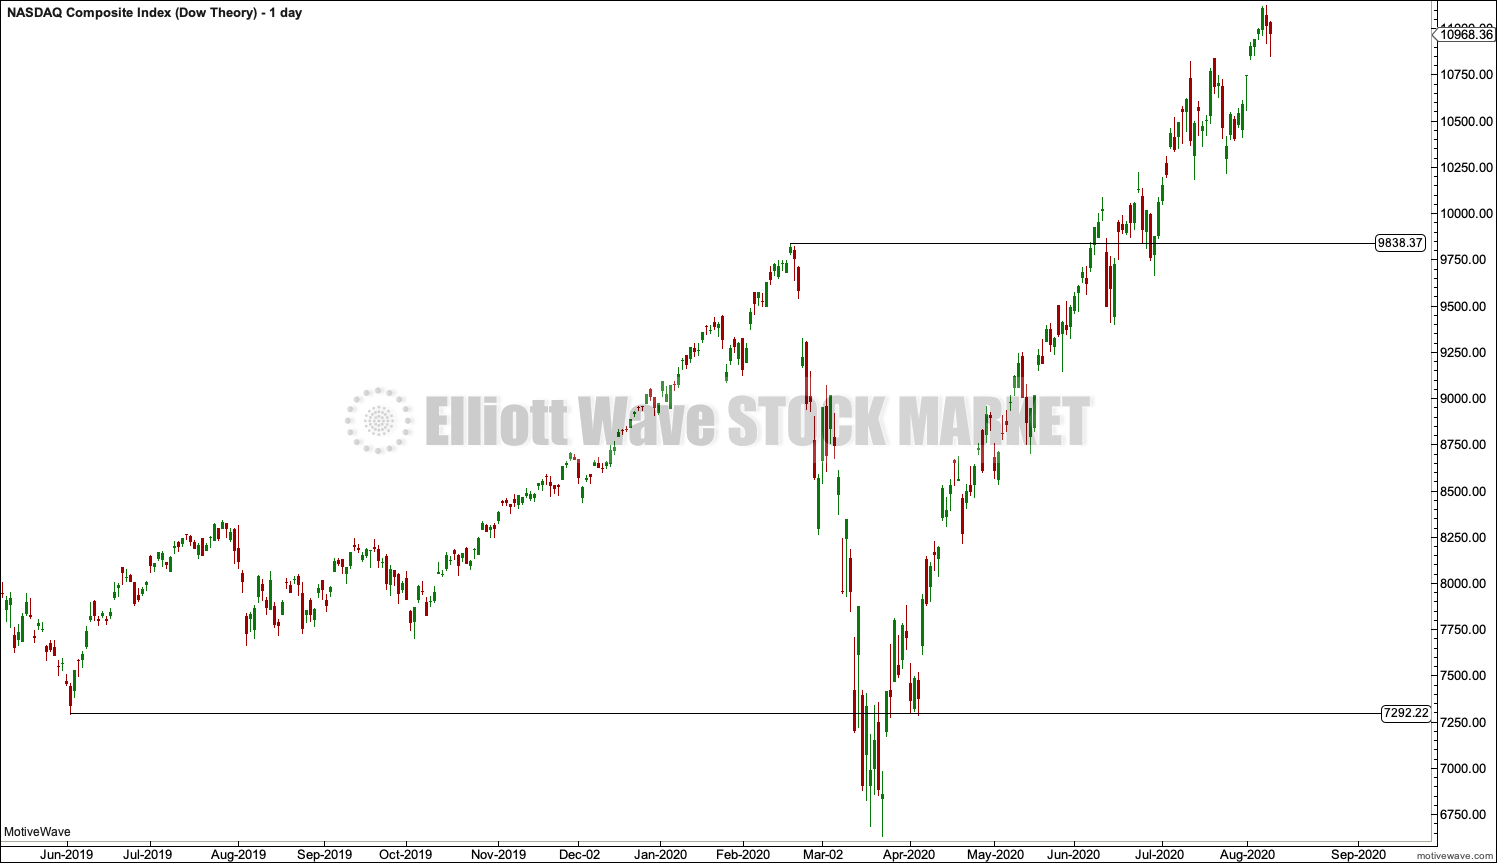
Extended Dow Theory confirmed a bear market with the following low made on a closing basis:
Nasdaq: 7,292.22 – a close below this point was made on the March 12, 2020.
At this time, to shift Dow Theory from viewing a bear market to confirmation of a new bull market would require new highs made on a closing basis:
Nasdaq: 9,838.37 – closed above on June 8, 2020.
GOLD
The week ends sideways to complete a doji for the weekly candlestick.
All three daily Elliott wave counts remain valid.
Summary: The pullback may be over. The upwards trend may resume.
The next longer-term target is now at 2,180.
Alternatively, it is possible that the pullback may continue lower to find support about 1,825.
A new low below 1,764.12 at any time frame would invalidate the first daily chart and add confidence in an alternate daily chart. At that stage, a sustainable high would be in place and either a cycle degree fourth wave or a Super Cycle degree C wave down may be underway.
Grand SuperCycle analysis is here.
Last analysis of monthly charts is here with video here.
FIRST ELLIOTT WAVE COUNT
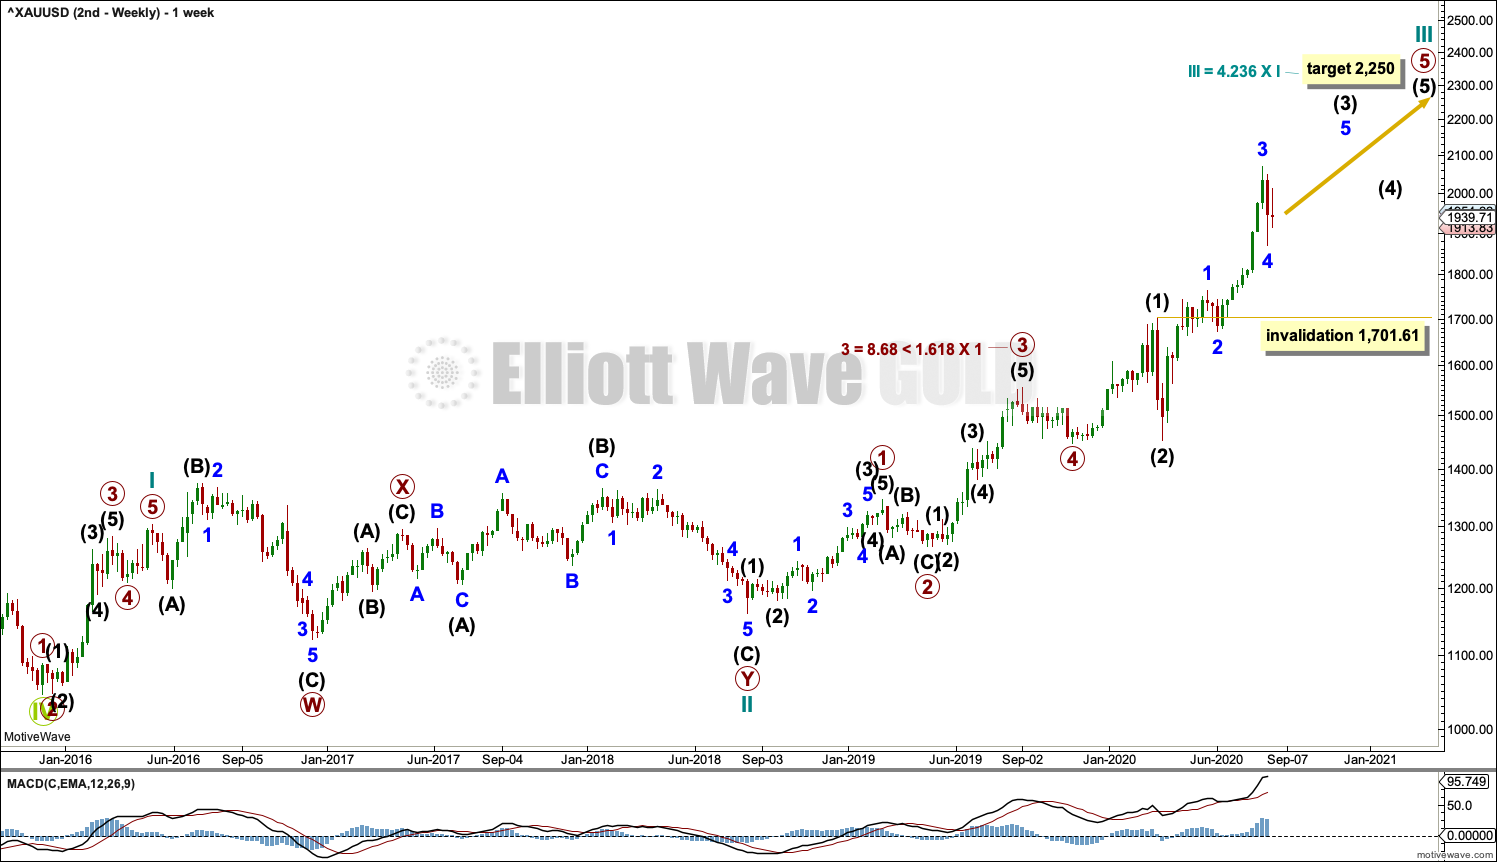
WEEKLY CHART
Click chart to enlarge.
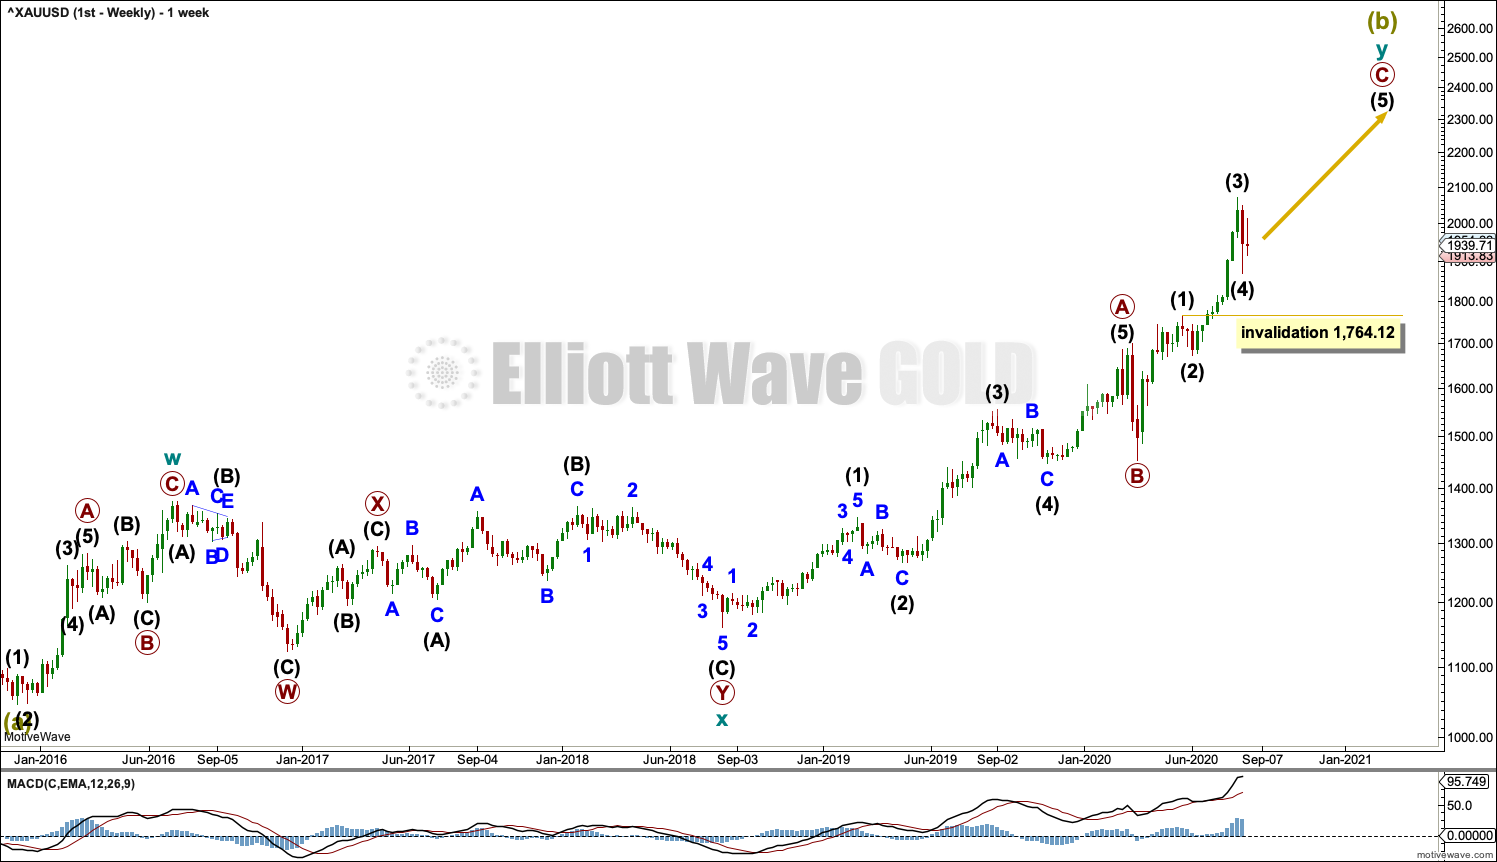
The bigger picture for this first Elliott wave count sees Gold as still within a bear market, in a three steps back pattern that is labelled Grand Super Cycle wave IV on monthly charts. The common range for Super Cycle wave (b) is from 1 to 1.38 times the length of Super cycle wave (a), giving a range from 1,920.18 to 2,252.27. The target would see Super Cycle wave (b) end within this most common range.
Super Cycle wave (b) within Grand Super Cycle wave IV may be an incomplete double zigzag. When Super Cycle wave (b) may be complete, then this wave count expects Super Cycle wave (c) to begin and to move price below the end of Super Cycle wave (a) at 1,046.27.
The first zigzag in the double is labelled cycle wave w. The double is joined by a three in the opposite direction, a combination labelled cycle wave x. The second zigzag in the double is labelled cycle wave y.
The purpose of the second zigzag in a double is to deepen the correction. Cycle wave y has achieved this purpose.
Primary wave C within cycle wave y may be subdividing as an impulse. Intermediate waves (1) through to (4) within primary wave C may be complete. If it continues any lower, then intermediate wave (4) may not move into intermediate wave (1) price territory below 1,764.12.
We should always assume the trend remains the same until proven otherwise. At this stage, Gold is in a bull market.
DAILY CHART
Click chart to enlarge.
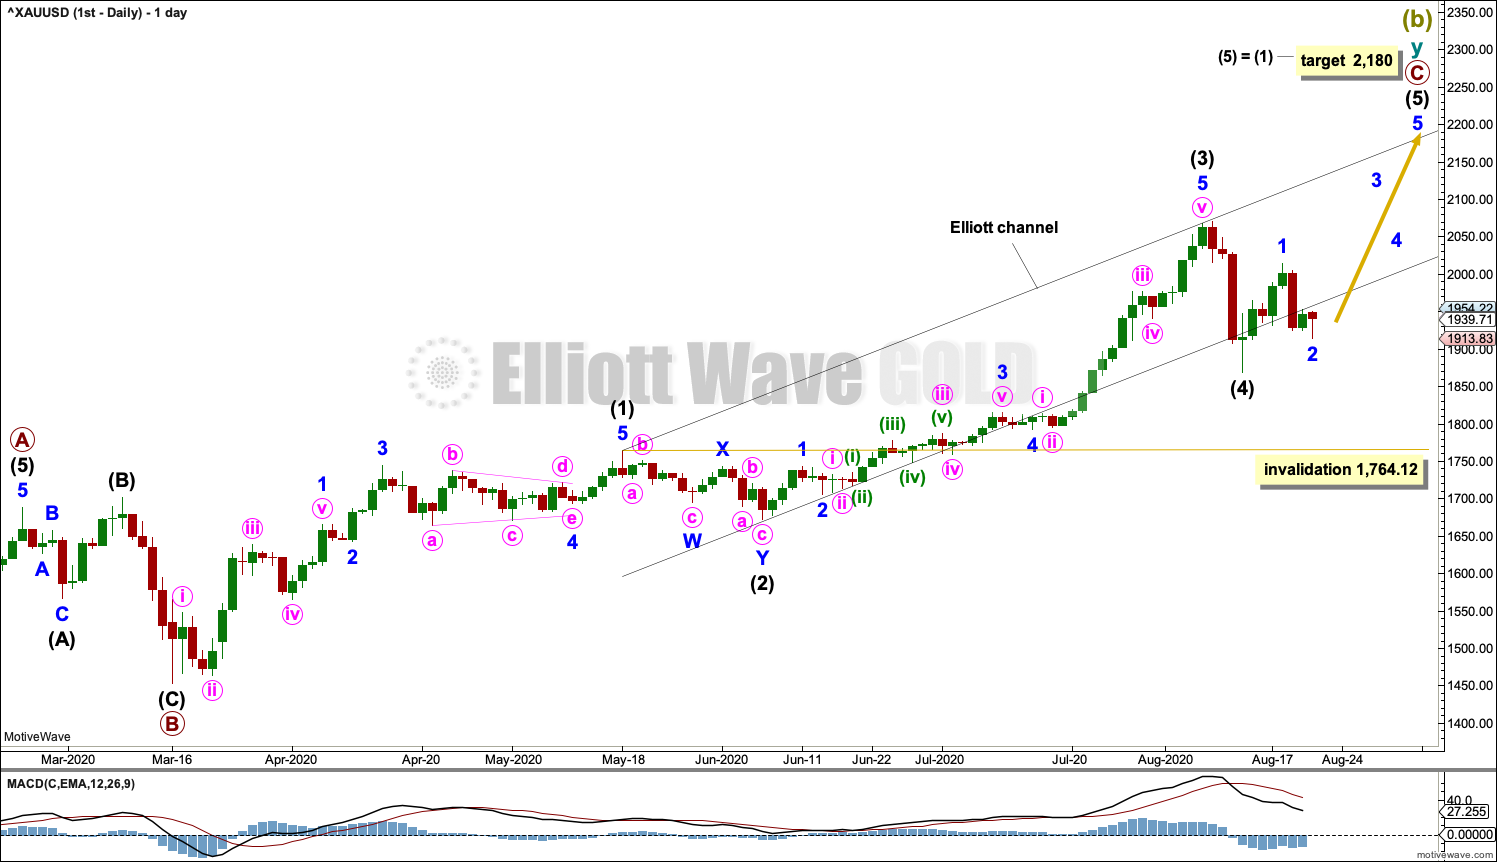
The daily chart shows detail of primary wave C as an incomplete impulse.
Intermediate waves (1) through to (4) within primary wave C may be complete.
If it continues lower, then intermediate wave (4) may not move into intermediate wave (1) price territory below 1,764.12.
Draw an Elliott channel: draw a first trend line from the end of intermediate wave (1) to the end of intermediate wave (3), then place a parallel copy on the end of intermediate wave (2). Intermediate wave (4) may have overshot the lower edge.
Intermediate wave (2) was a shallow double zigzag, lasting 15 sessions. Intermediate wave (4) may be complete as a deeper and quicker single zigzag. Fourth waves are most often more brief than their counterpart second wave corrections for this market, so it would look normal for intermediate wave (4) to be over here.
ALTERNATE DAILY CHART
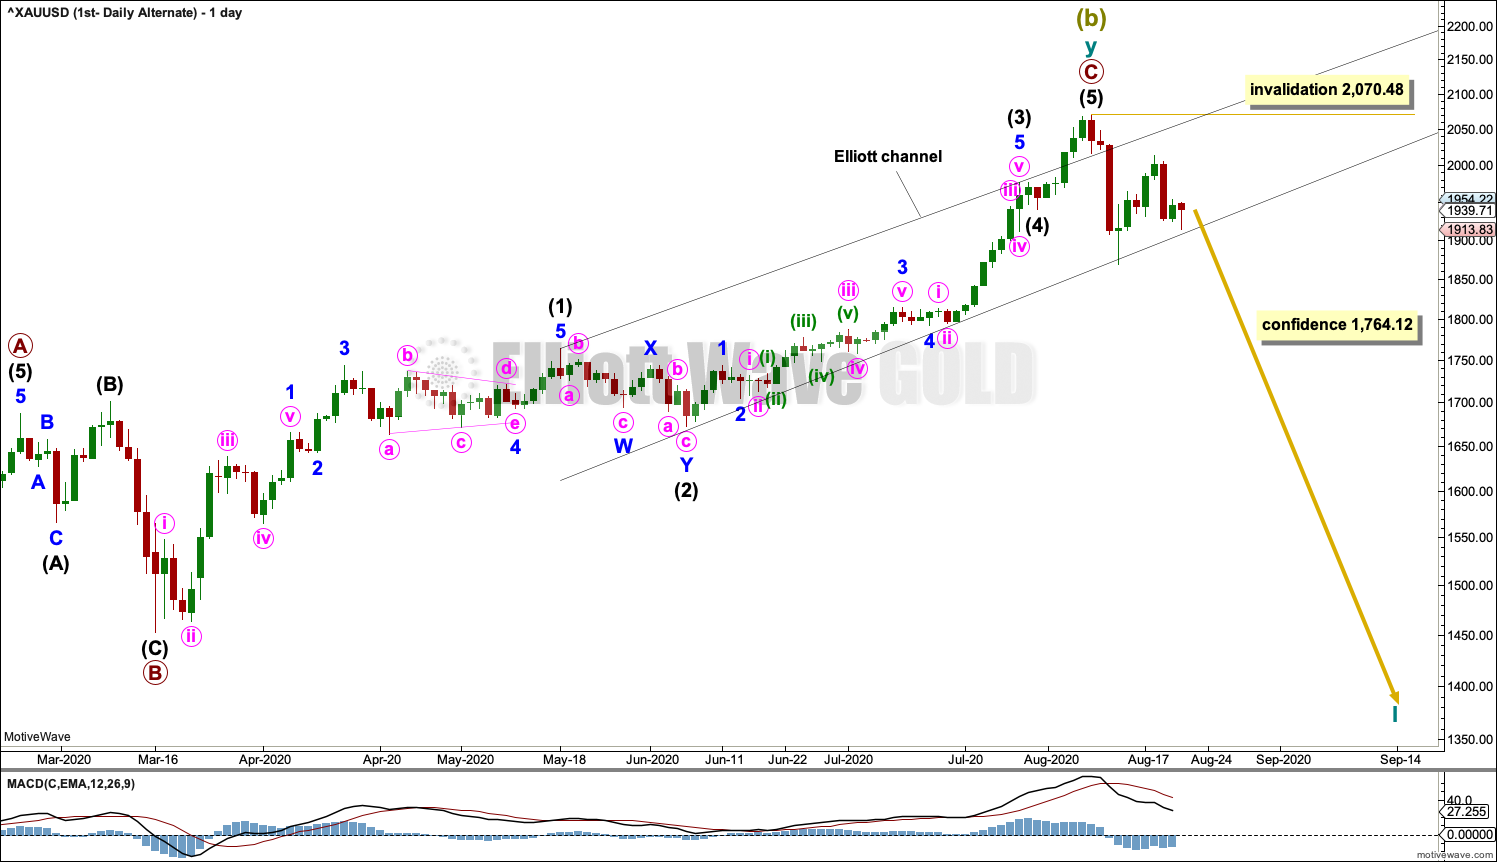
Click chart to enlarge.
It is also possible that a Super Cycle degree trend change has occurred at the last high. However, we should always assume the trend remains the same until proven otherwise. Assume the upwards trend remains in place and the main wave count is correct until the upwards trend is invalidated with a new low below 1,764.12. At that stage, this would become the main wave count.
Super Cycle wave (c) would be likely to make at least a slight new low below the end of Super Cycle wave (a) at 1,046.27 to avoid a truncation. If price provides confidence in this wave count with a new low below 1,764.12, then a target would be calculated for Super Cycle wave (c) to end.
SECOND ELLIOTT WAVE COUNT
WEEKLY CHART
Click chart to enlarge.
This wave count sees the the bear market complete at the last major low for Gold on 3 December 2015.
If Gold is in a new bull market, then it should begin with a five wave structure upwards on the weekly chart.
Cycle wave I fits as a five wave impulse with reasonably proportionate corrections for primary waves 2 and 4.
Cycle wave II fits as a double flat. However, within the first flat correction labelled primary wave W, this wave count needs to ignore what looks like an obvious triangle from July to September 2016 (this can be seen labelled as a triangle on the bear wave count above). This movement must be labelled as a series of overlapping first and second waves. Ignoring this triangle reduces the probability of this wave count in Elliott wave terms.
Within the first flat correction labelled primary wave W of the double flat of cycle wave II, intermediate wave (B) is 1.69 the length of intermediate wave (A). This is longer than the common range of up to 1.38, but within an allowable guideline of up to 2. The length of intermediate wave (B) reduces the probability of this wave count.
Cycle wave III may be incomplete. Cycle wave IV may not move into cycle wave I price territory below 1,303.51.
DAILY CHART
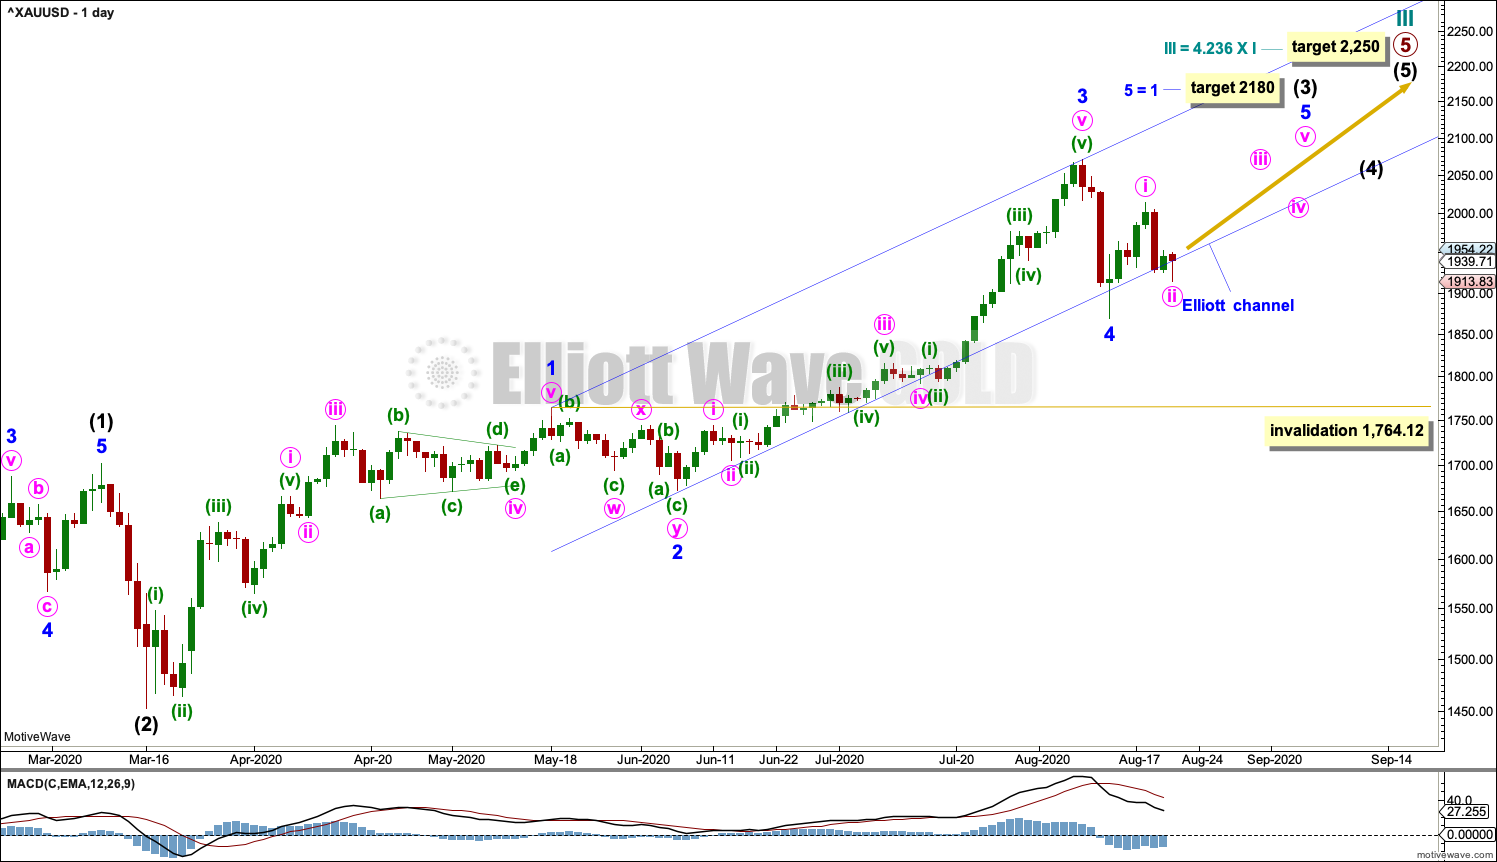
Click chart to enlarge.
Cycle wave III may be continuing higher. The daily chart focusses on primary wave 5 within cycle wave III.
Draw an Elliott channel about intermediate wave (3): draw the first trend line from the end of minor wave 1 to the end of minor wave 3, then place a parallel copy on the end of minor wave 2. Minor wave 4 may have overshot the lower edge of the channel.
If minor wave 4 continues lower, then it may not move into minor wave 1 price territory below 1,764.12.
TECHNICAL ANALYSIS
WEEKLY CHART
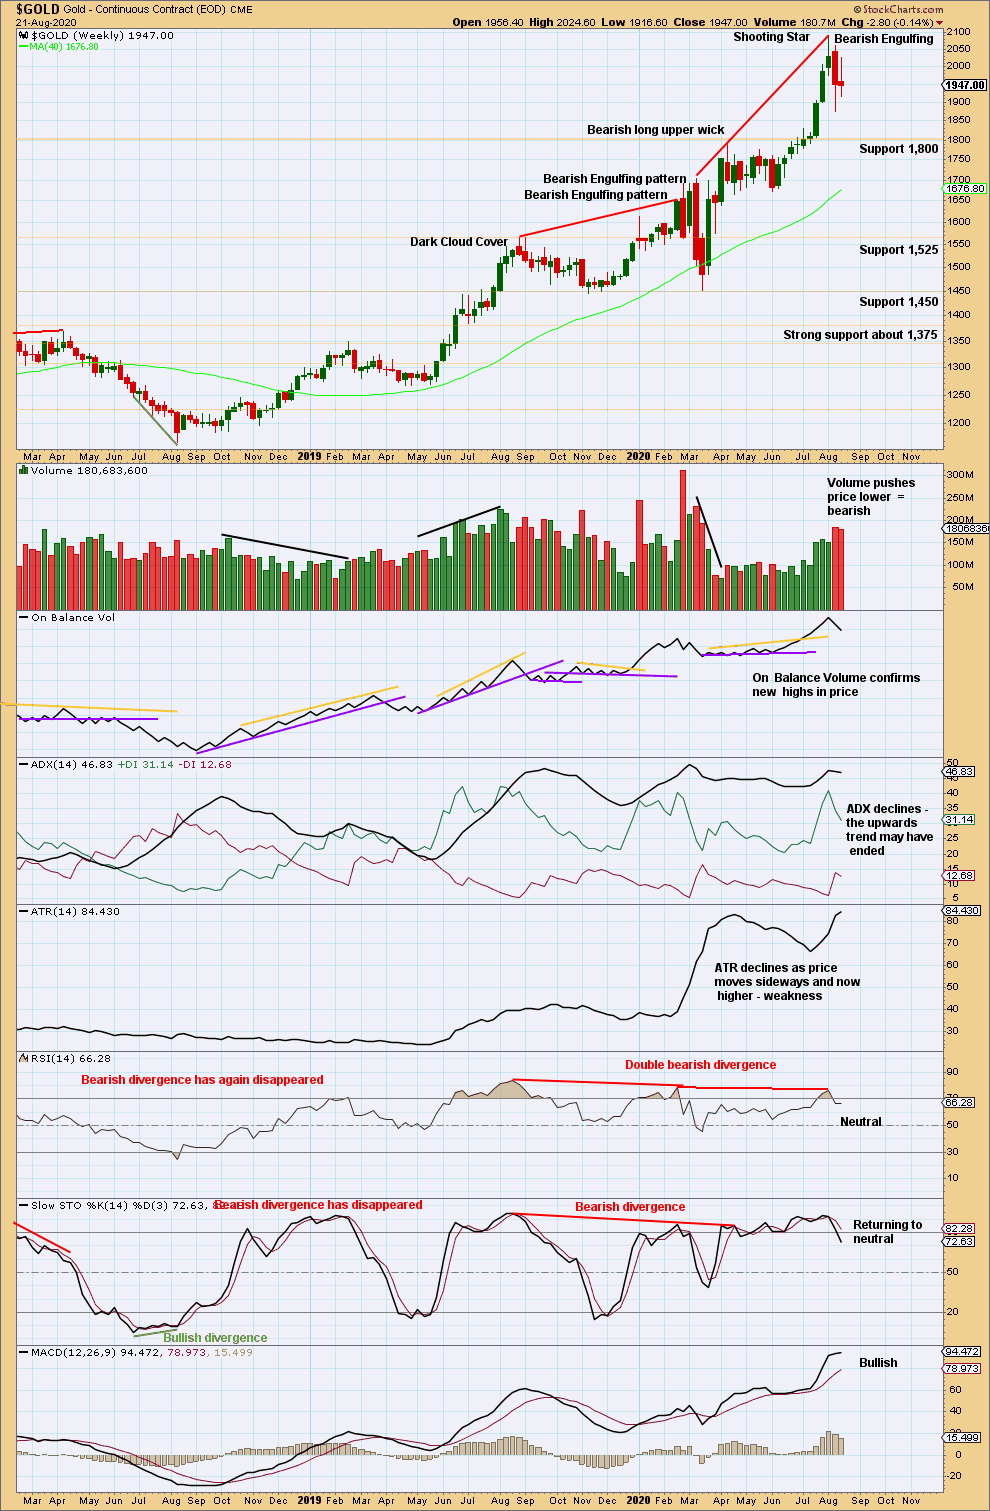
Click chart to enlarge. Chart courtesy of StockCharts.com.
The trend is very extreme and RSI is deeply overbought. A Shooting Star and a Bearish Engulfing candlestick pattern appear at the high. Given extreme conditions, these bearish reversal patterns should be given weight; this would support the alternate daily chart. However, it is still possible that further highs may be made before a more time consuming pullback or a 180° trend change may occur.
The doji this week represents a pause. Doji most frequently occur within consolidations but may also appear within trends, particularly downwards trends.
DAILY CHART
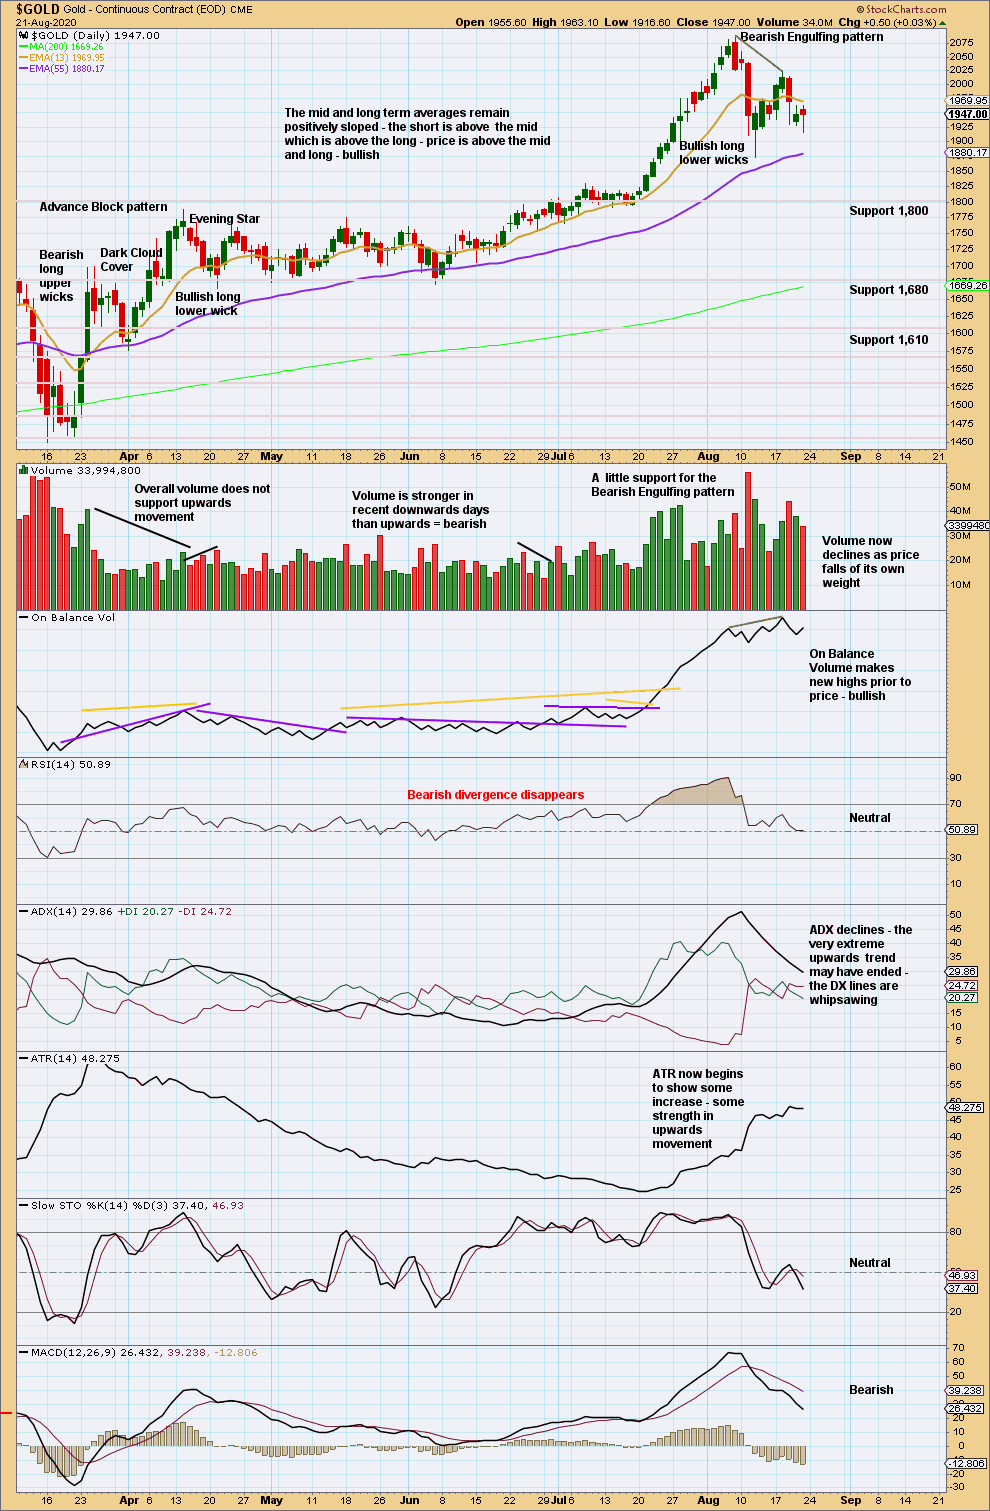
Click chart to enlarge. Chart courtesy of StockCharts.com.
Sideways movement of the last two weeks has brought ADX and RSI down from extreme. There is again room for a trend to develop.
Sideways movement of the last few days looks now like a consolidation to relieve extreme conditions before the old trend may continue. If a pullback continues here, then look for support about 1,800.
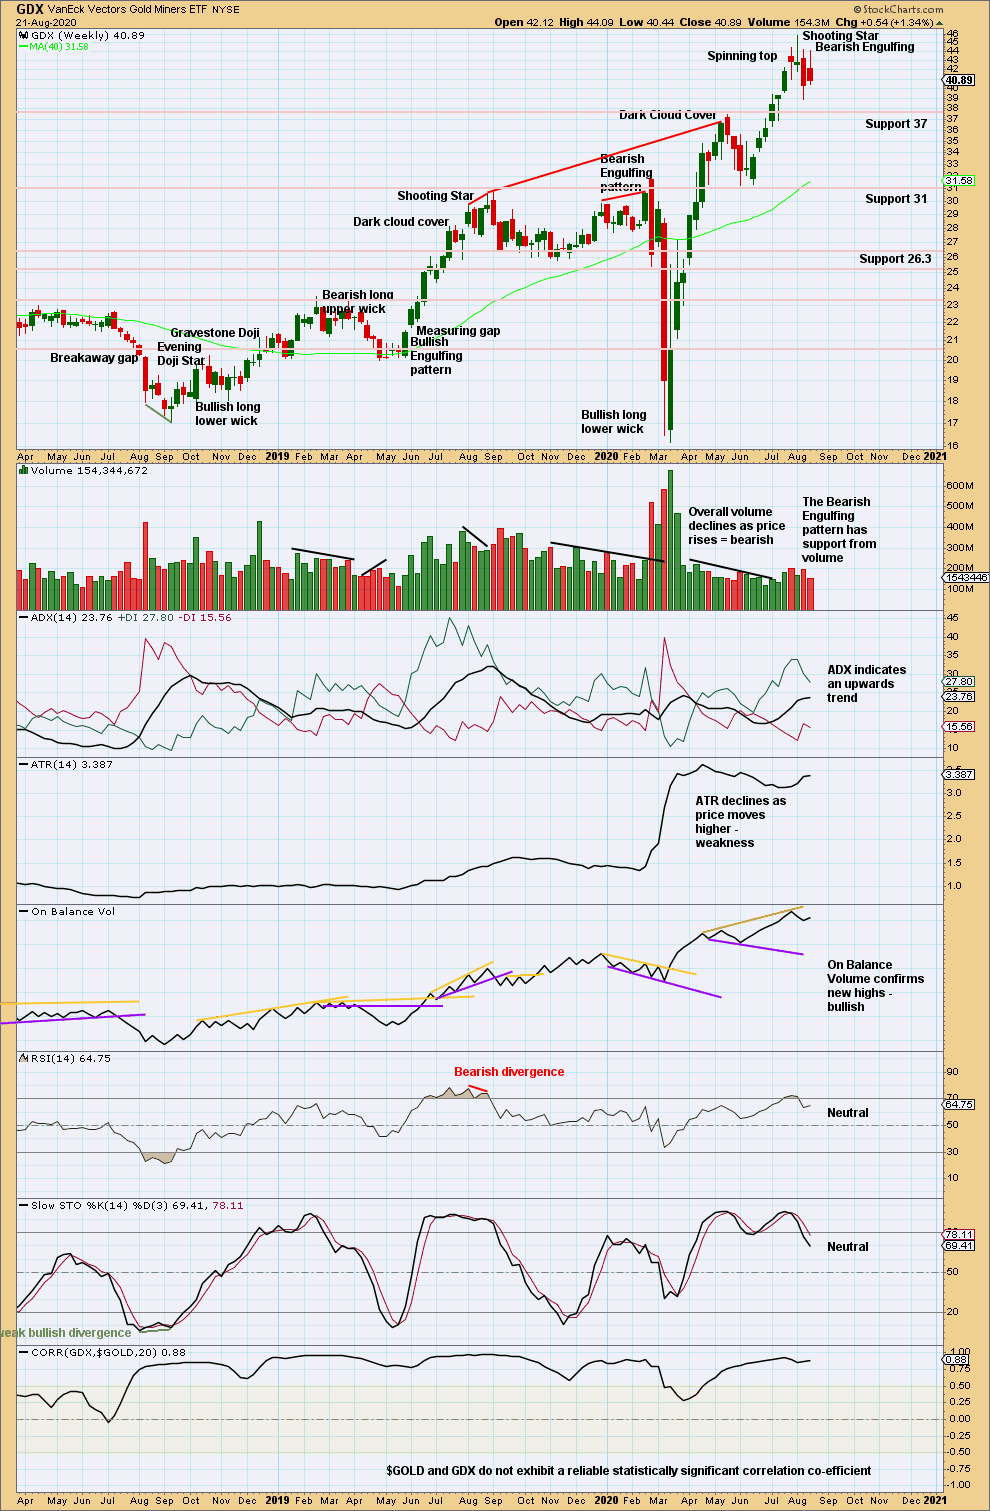
GDX WEEKLY CHART
Click chart to enlarge. Chart courtesy of StockCharts.com.
Now two bearish candlestick reversal patterns in a Shooting Star and a Bearish Engulfing pattern indicate a trend change. With RSI reaching overbought at the high, these signals should be given weight. A trend change may be either a 180° change or a change to a sideways consolidation. The last week has a bearish long upper wick, reinforcing the bearish signals from this weekly chart.
GDX DAILY CHART
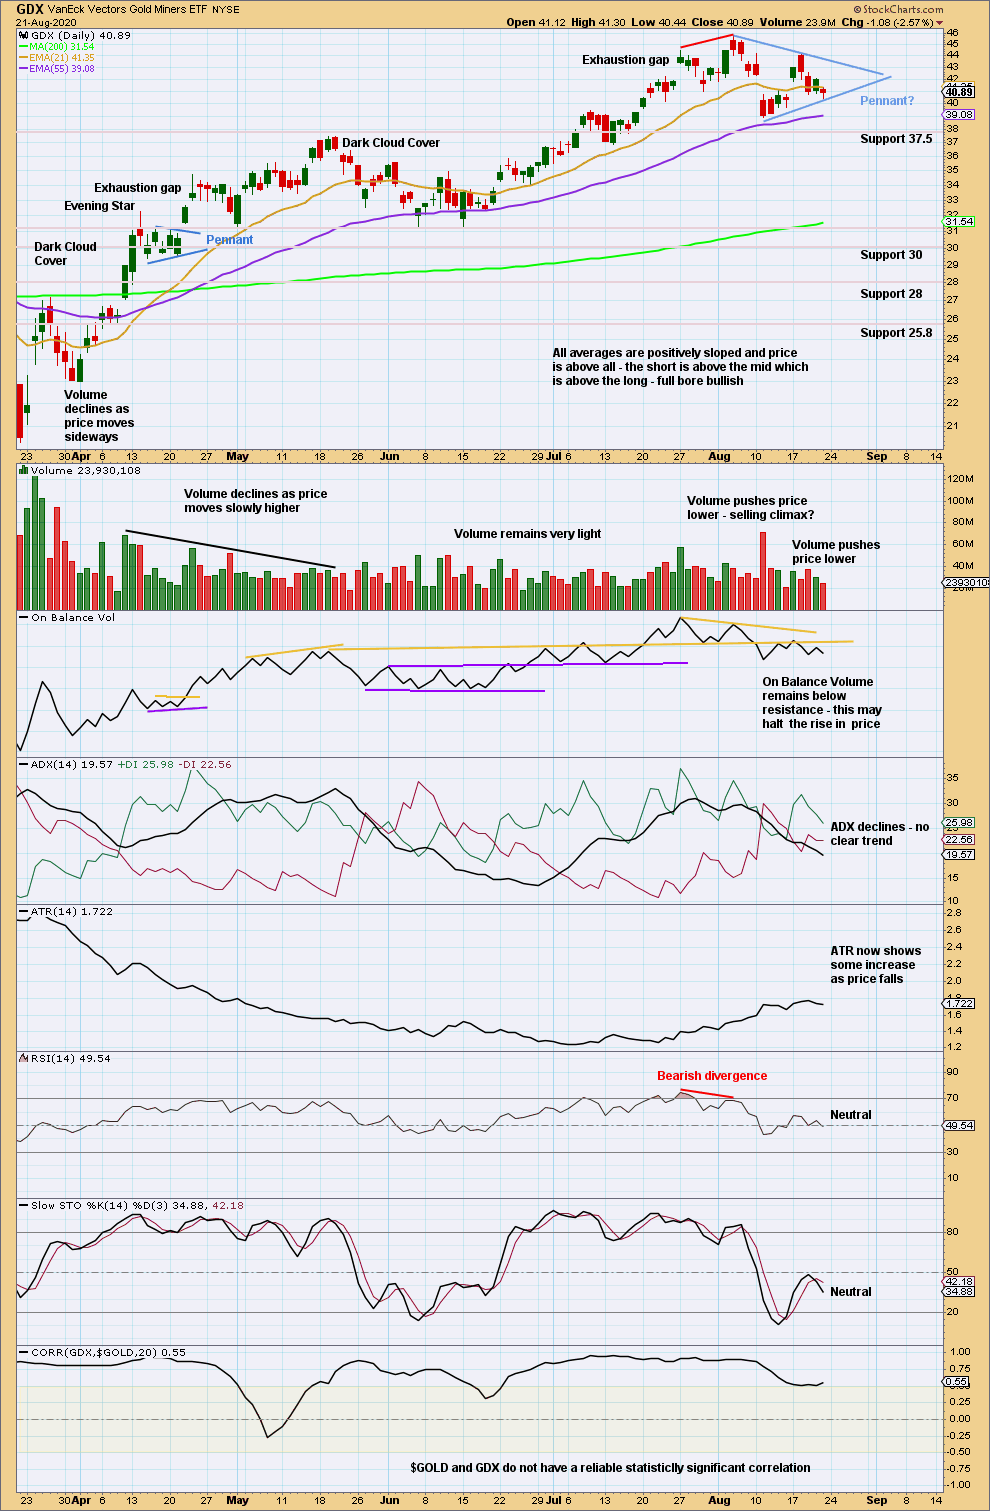
Click chart to enlarge. Chart courtesy of StockCharts.com.
The last two gaps are both closed. They should now be viewed as pattern gaps.
A small pennant pattern may have formed. These are continuation patterns. This disagrees with the conclusion on the weekly chart.
If price breaks above the upper trend line of the pennant by closing above that line on an upwards day with support from volume, then a target from the pennant would be about 57.
US OIL
A very small range week moved price higher, which did not make a new swing high.
Both Elliott wave counts remain valid.
Summary: Oil may have found a major sustainable low.
A slow rounded top may still be forming. The rounded top may take a few more weeks of sideways and slowly lower movement before it gathers any strength.
A pullback is still expected. The pullback may end about 27.59. It is possible the pullback may be deeper than this though; the first major correction within a new trend for Oil tends to be very deep.
When this pullback may be complete, then an upwards trend should resume with increased strength.
ELLIOTT WAVE COUNT
MONTHLY CHART
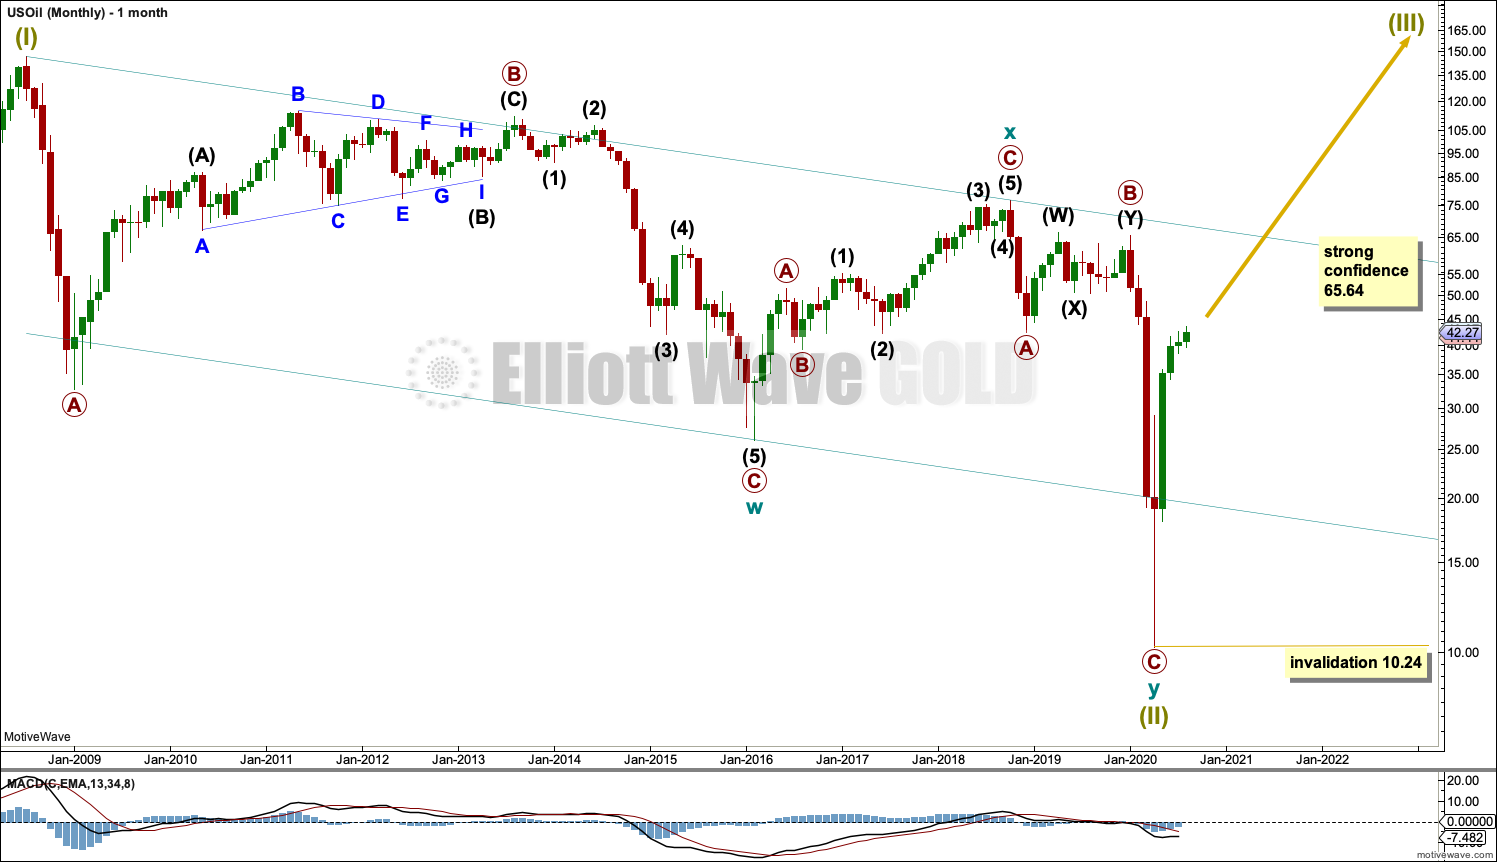
Click chart to enlarge.
The basic Elliott wave structure is five steps forward and three steps back. This Elliott wave count expects that US Oil has completed a three steps back pattern, which began in July 2008. The Elliott wave count expects that the bear market for US Oil may now be over.
A channel is drawn about Super Cycle wave (II): draw the first trend line from the start of cycle wave w to the end of cycle wave x, then place a parallel copy on the end of cycle wave w. Price has bounced up off the channel. This trend line is breached, which is a typical look for the end of a movement for a commodity.
The upper edge of the channel may provide resistance.
Following five waves up and three steps back should be another five steps up; this is labelled Super Cycle wave (III), which may only have just begun. Super Cycle wave (III) may last a generation and must make a new high above the end of Super Cycle wave (I) at 146.73.
Super Cycle wave (III) may only subdivide as a five wave impulse. New trends for Oil usually start out very slowly with short first waves and deep time consuming second wave corrections. Basing action over a few years may now have begun.
WEEKLY CHART
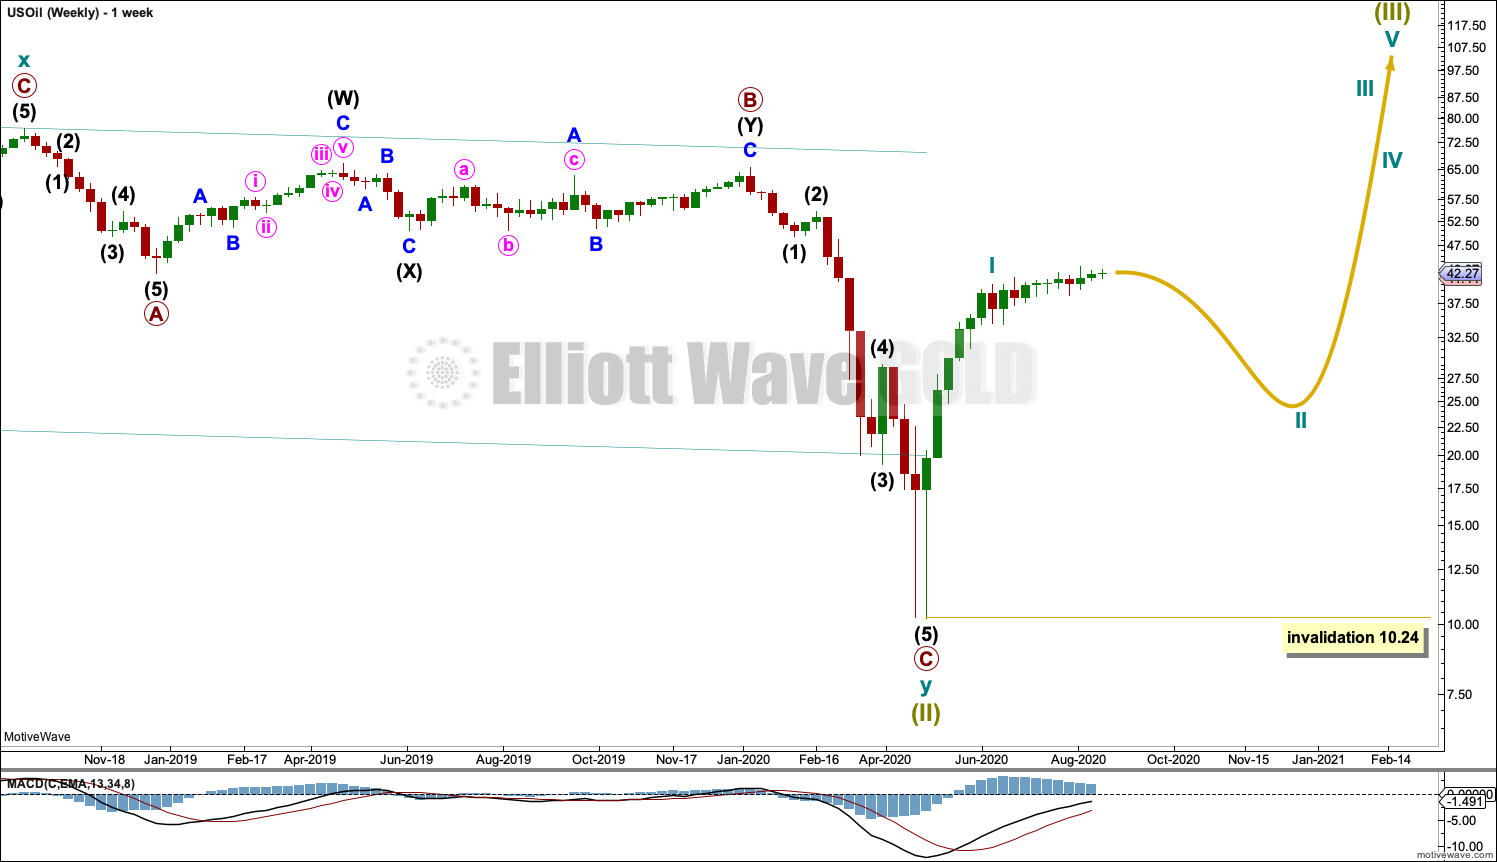
Click chart to enlarge.
This week the degree of labelling within the new upwards trend is moved up one degree.
Super Cycle wave (III) must subdivide as an impulse. Cycle wave I within the impulse may be complete. Cycle wave II may not move beyond the start of cycle wave I below 10.24.
FIRST DAILY CHART
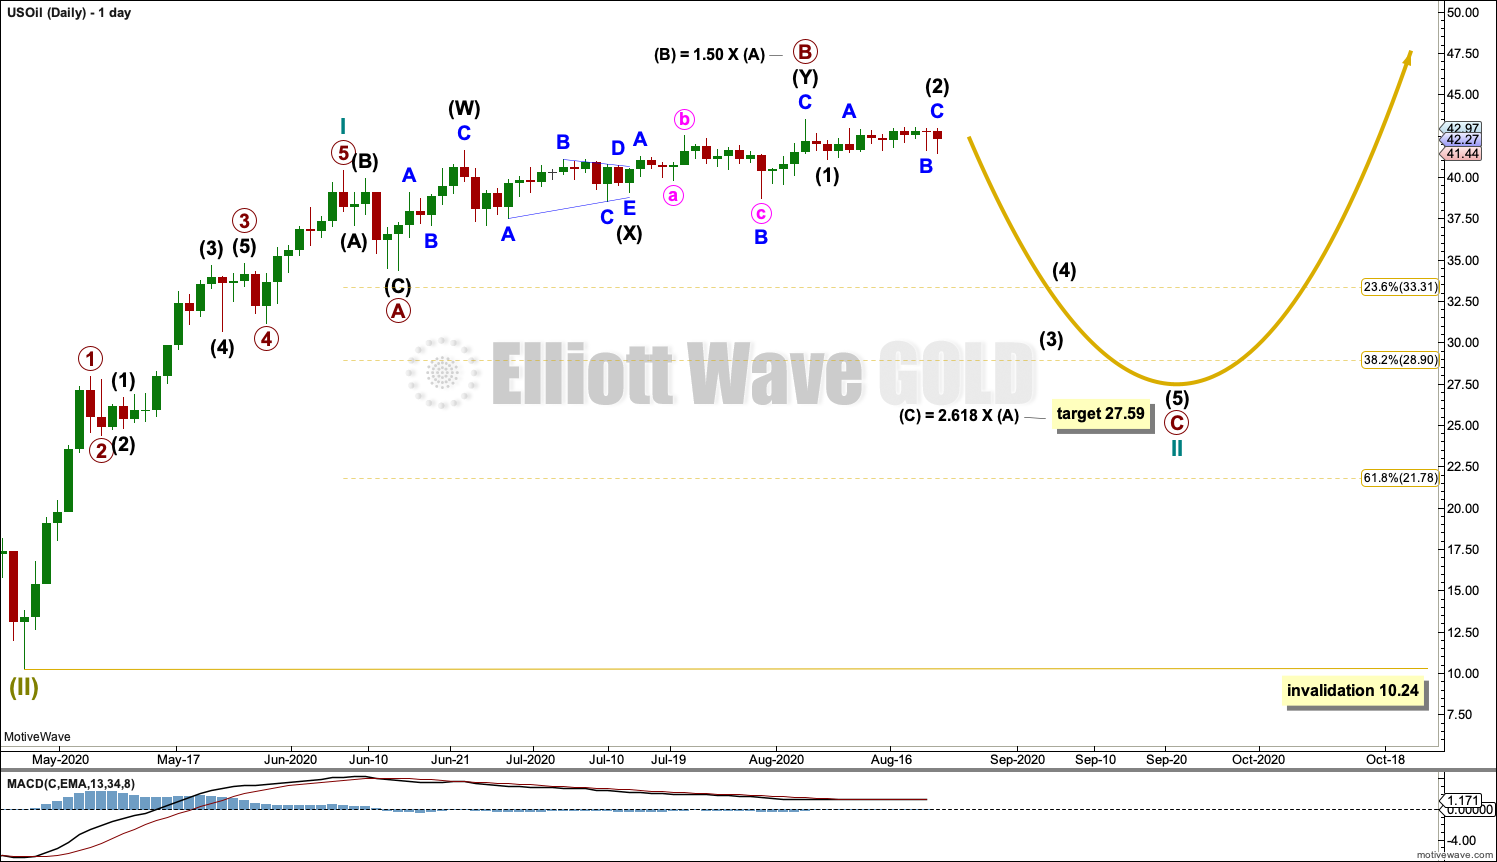
Click chart to enlarge.
Cycle wave I within an impulse for Super Cycle wave (III) may now be complete.
Cycle wave II may be unfolding as an expanded flat correction. Primary wave A within the flat may be a complete zigzag. Primary wave B may have continued higher as a double zigzag. It would now be 1.50 times the length of primary wave A, which is a little beyond the common range for primary wave B within a flat from 1 to 1.38 times the length of primary wave A, but within an allowable limit of 2. This reduces the probability of this wave count to about even with the second.
Primary wave C may only subdivide as a five wave motive structure, most likely an impulse. If the target is wrong, then it may not be low enough.
A target is calculated for cycle wave II that expects a common Fibonacci ratio between primary waves A and C.
Cycle wave II may not move beyond the start of cycle wave I below 10.24.
SECOND DAILY CHART
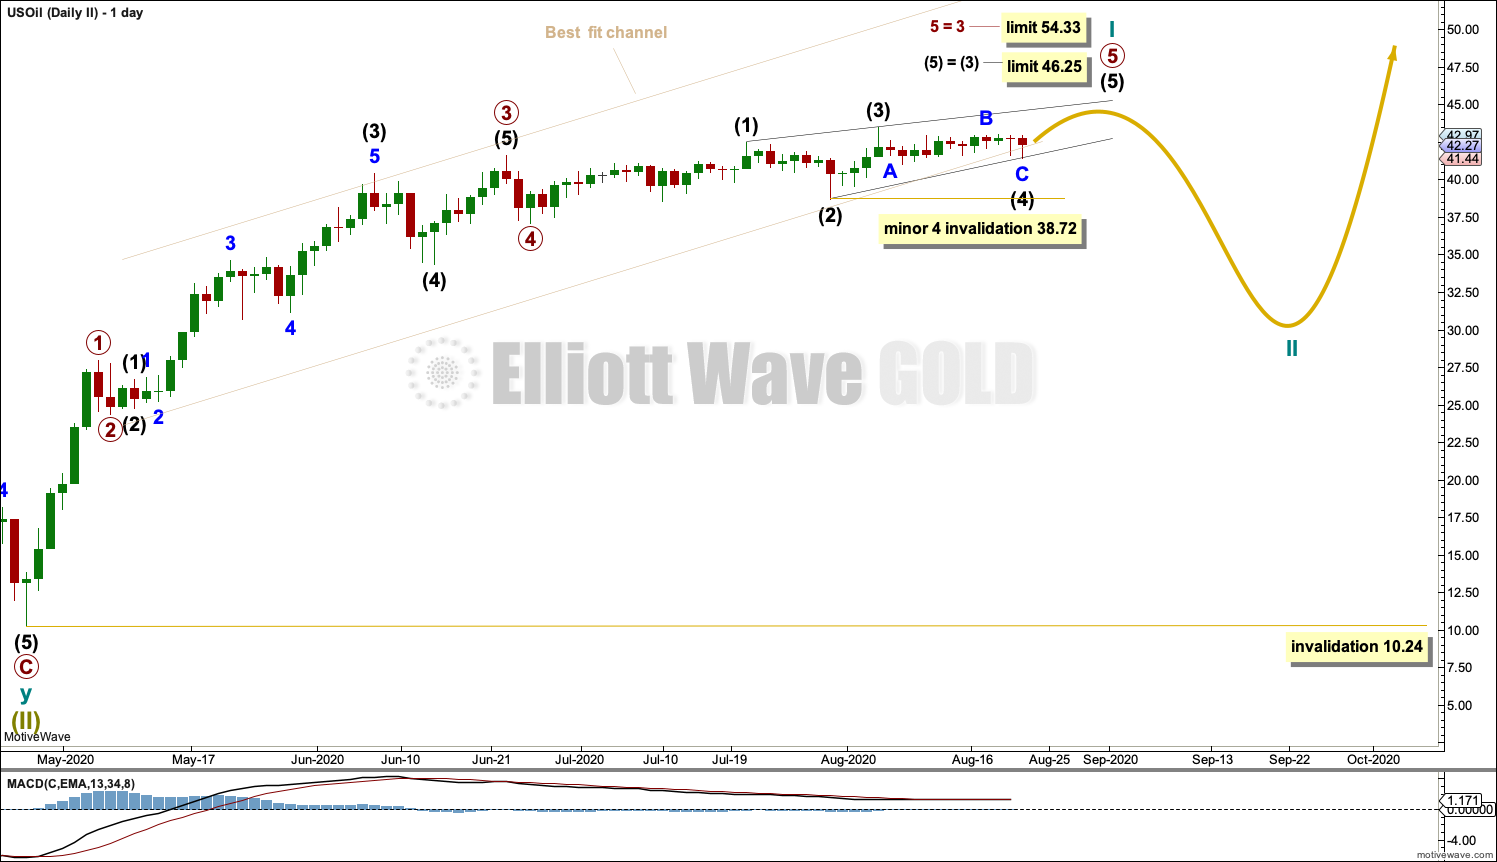
Click chart to enlarge.
It is possible that cycle wave I is continuing higher.
Primary wave 5 may be an ending contracting diagonal. Within the diagonal: intermediate wave (3) is shorter than intermediate wave (1), intermediate wave (4) is shorter than intermediate wave (2), and intermediate wave (5) must be shorter than intermediate wave (3) (it must end before the limit at 46.25).
Intermediate wave (4) within the diagonal may not move beyond the end of intermediate wave (2) below 38.72.
TECHNICAL ANALYSIS
WEEKLY CHART
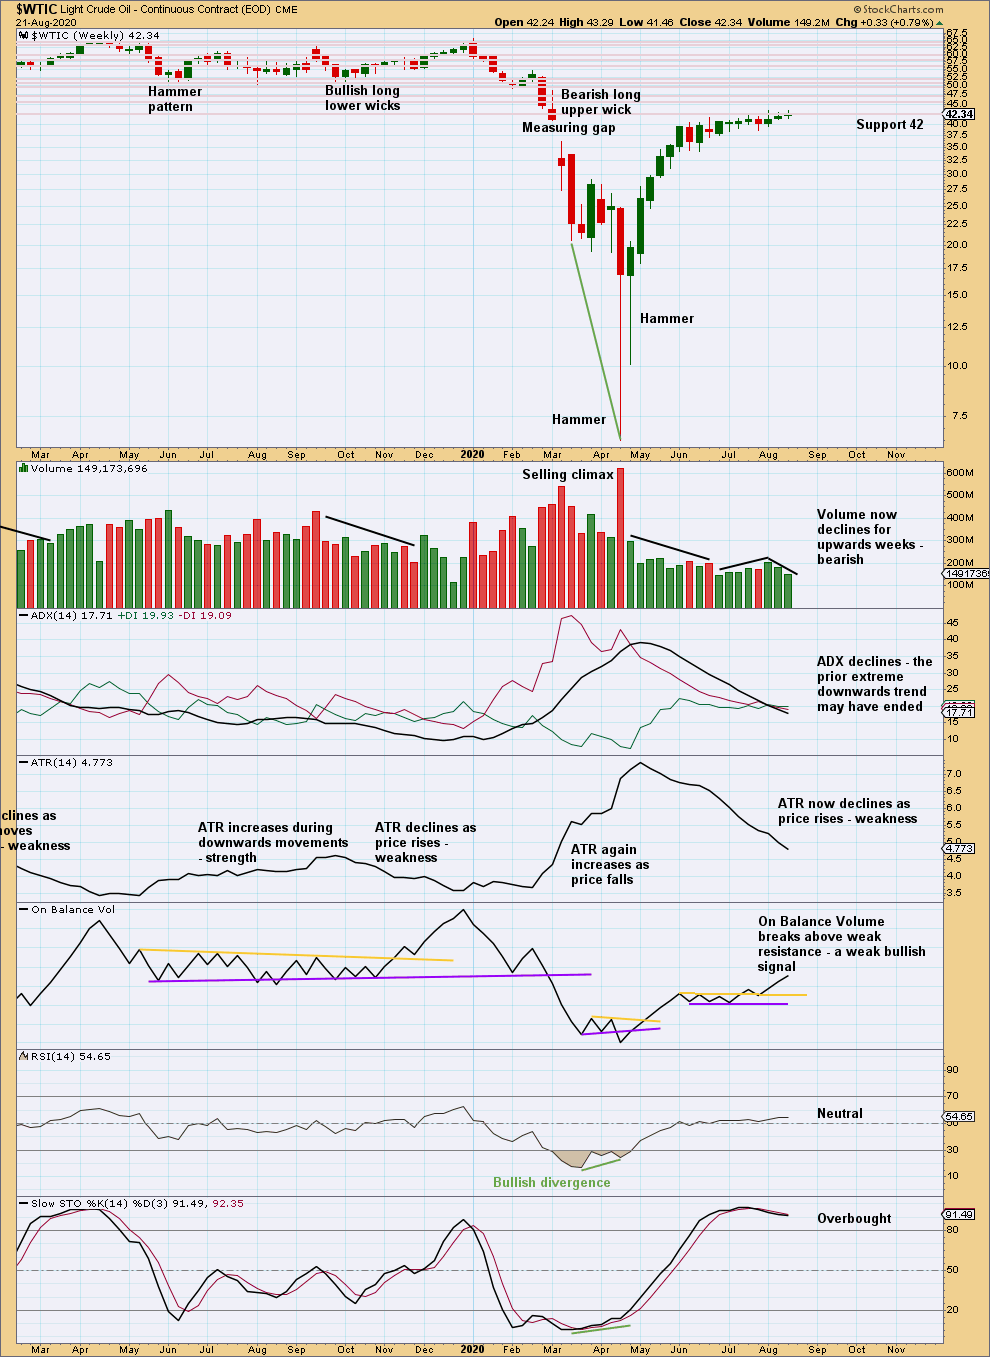
Click chart to enlarge. Chart courtesy of StockCharts.com.
Support about 42 has held this week. There is a strong cluster of resistance above; it would still be reasonable to expect a pullback to develop about here.
DAILY CHART
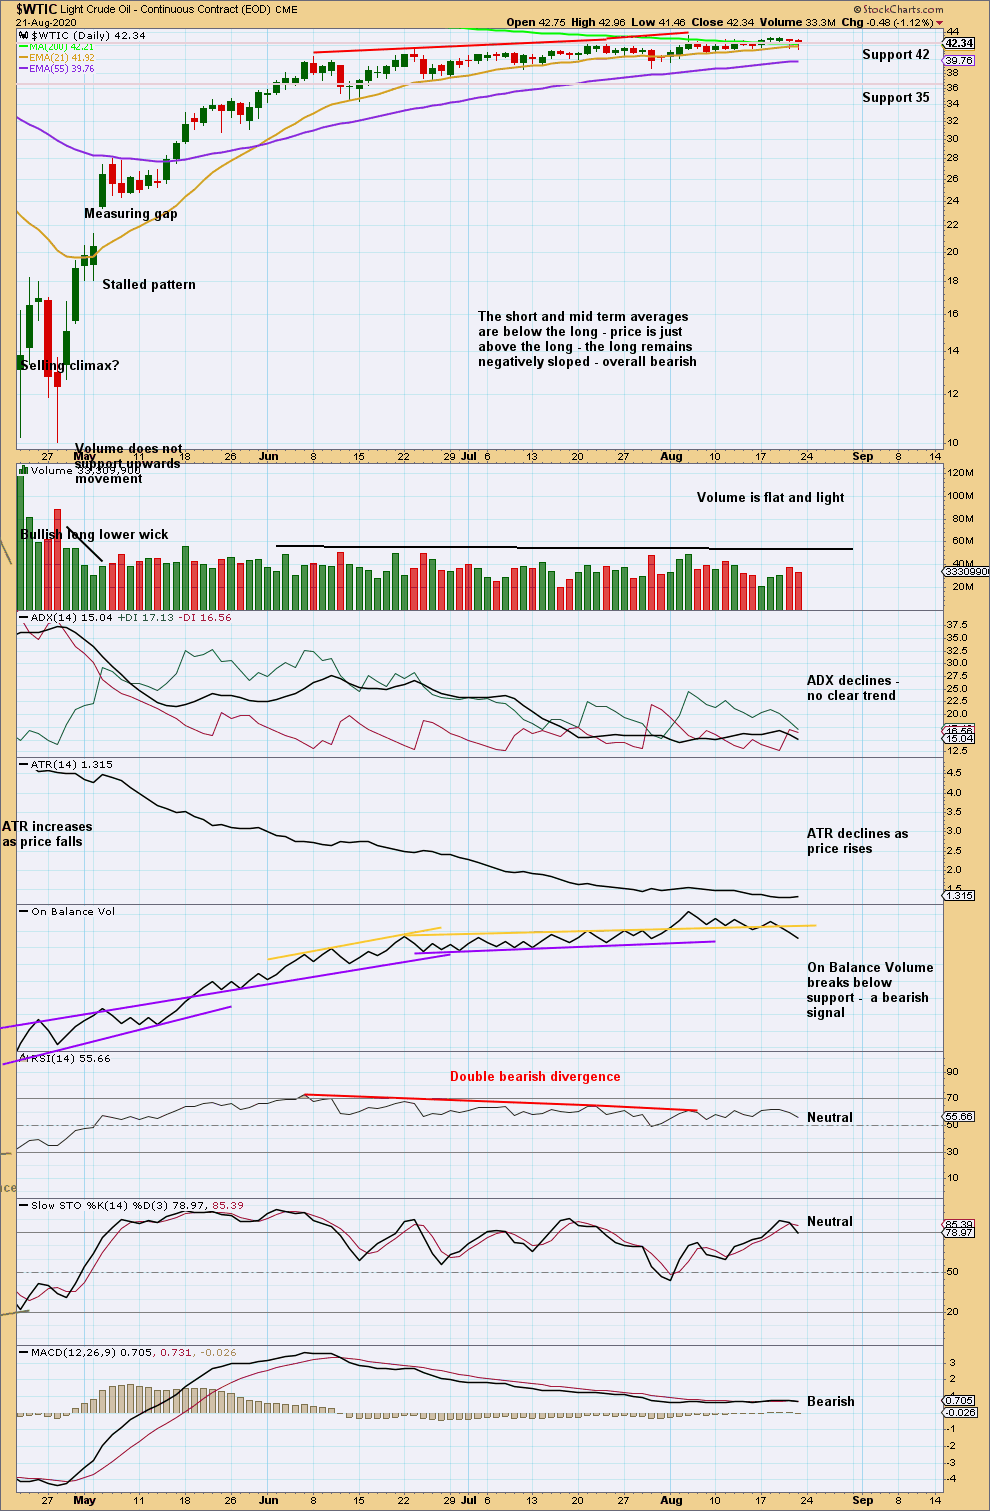
Click chart to enlarge. Chart courtesy of StockCharts.com.
There is still double bearish divergence between price and RSI. The probability of a multi-week pullback remains high.
A bearish signal from On Balance Volume favours the first daily chart.
The last two daily candlesticks look like small hanging men; these are bearish reversal patterns, but they require confirmation with a bearish candlestick to follow.
—
Always practice good risk management as the most important aspect of trading. Always trade with stops and invest only 1-5% of equity on any one trade. Failure to manage risk is the most common mistake new traders make.