
Lara’s Weekly: Elliott Wave and Technical Analysis of S&P500 and Gold and US Oil | Charts – September 25, 2020

S&P 500
Price remains below a short-term invalidation point. Upwards movement ended exactly at the upper edge of a channel.
Alternate Elliott wave counts are used to navigate price movement next week.
Summary: The first wave count expects that a pullback or consolidation may continue next week. It may find support about 3,055 (most likely) or 2,725.
For the short term, a new high now above 3,428.92 would indicate the pullback may be over.
The second wave count considers the possibility that a once in multi-generations trend change may have occurred. Some confidence in this wave count would come with invalidation of the first wave count below 2,191.86.
At this stage, a new high above 3,330.30 would be bullish.
The biggest picture, Grand Super Cycle analysis, is here.
Last monthly charts are here. Video is here.
ELLIOTT WAVE COUNTS
FIRST WAVE COUNT
WEEKLY CHART
Click chart to enlarge.
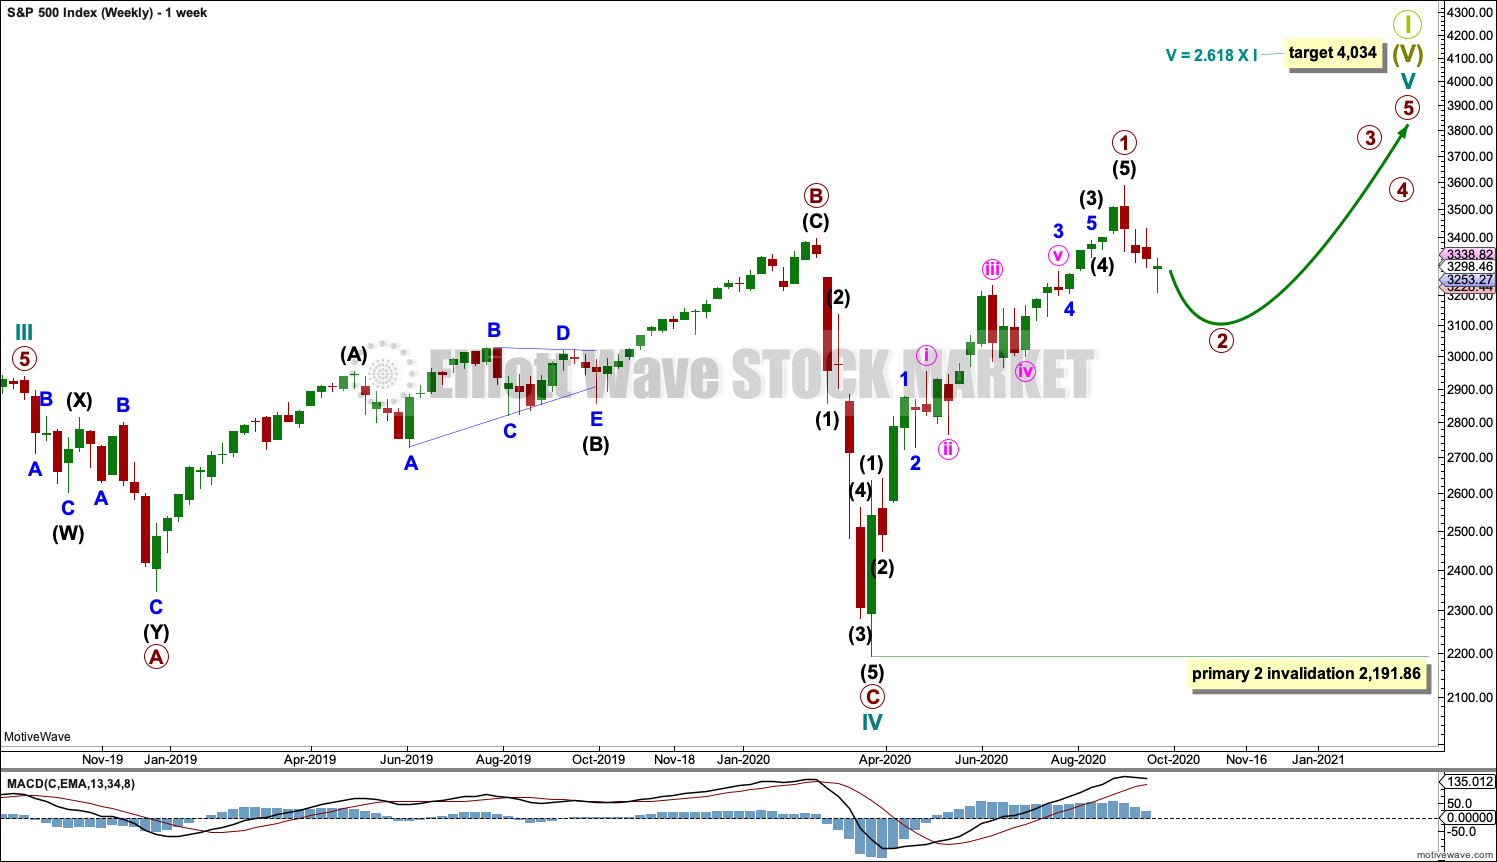
Cycle wave V may last from one to several years. So far it has lasted 6 months.
Cycle wave V would most likely subdivide as an impulse. But if overlapping develops, then an ending diagonal should be considered. This chart considers the more common impulse.
Primary wave 1 may be complete. Primary wave 2 may not move beyond the start of primary wave 1 below 2,191.86.
There is already a Fibonacci ratio between cycle waves I and III within Super Cycle wave (V). The S&P500 often exhibits a Fibonacci ratio between two of its actionary waves but rarely between all three; it is less likely that cycle wave V would exhibit a Fibonacci ratio. The target for Super Cycle wave (V) to end would best be calculated at primary degree, but that cannot be done until all of primary waves 1, 2, 3 and 4 are complete. The target at 4,034 is provisional, so it may change.
DAILY CHART
Click chart to enlarge.
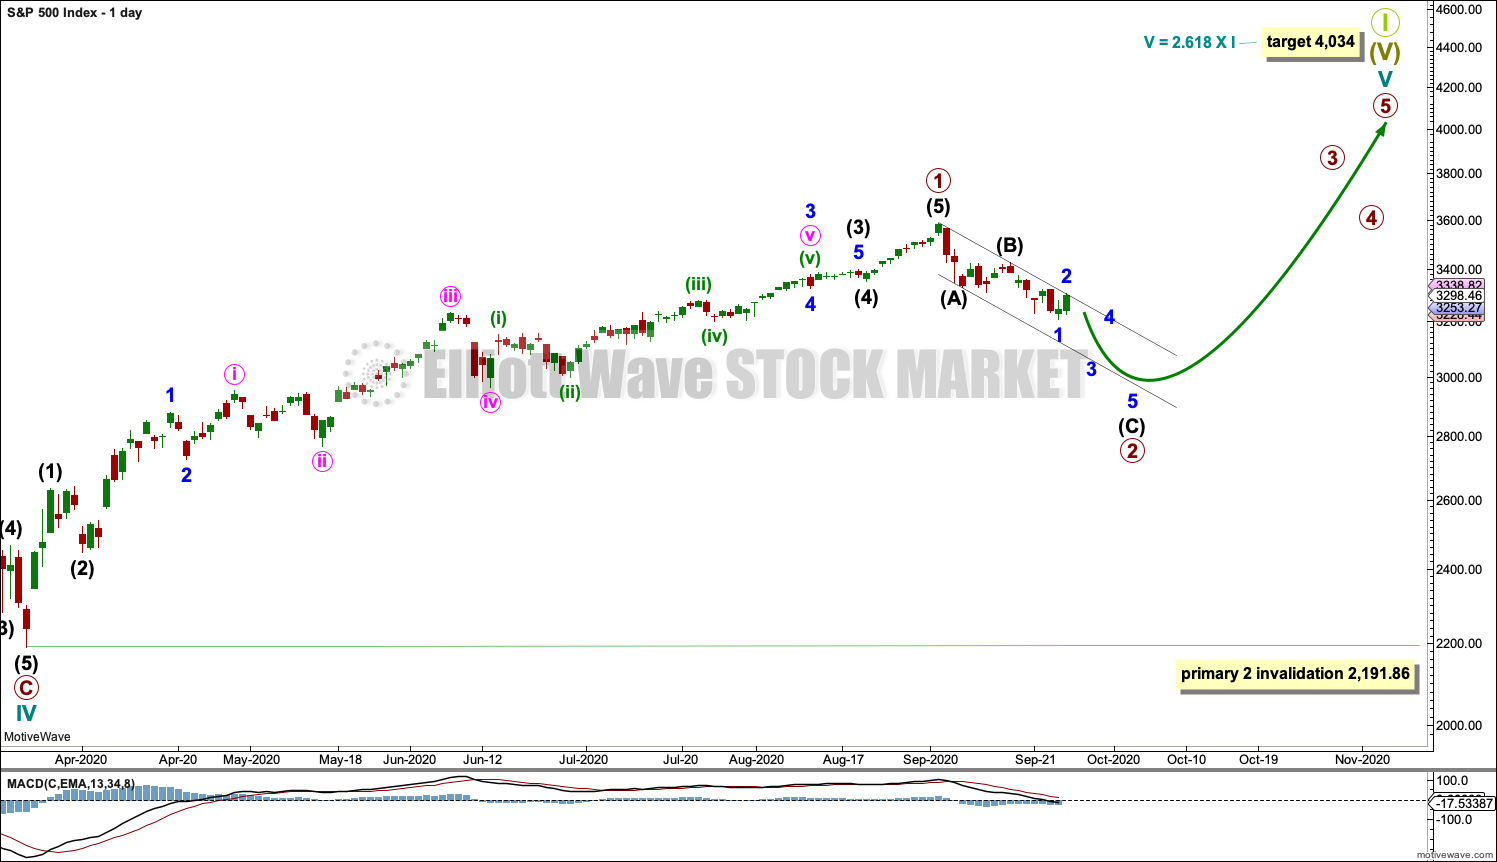
Primary wave 1 may be over and primary wave 2 may have begun.
Primary wave 2 may be a multi-week pullback or consolidation. Primary wave 2 may not move beyond the start of primary wave 1 below 2,191.86.
For the S&P500, the first multi-week second wave correction within a new trend is not always very deep. Two examples from prior bull markets: after the bear market of October 1987, the first multi-week second wave in the following bull market ended in September 1990 and was only a 0.49 correction of its corresponding first wave, and more recently the last bull market beginning in March 2009 saw its first multi-week second wave correction end in June 2009, which was only a 0.30 correction of its corresponding first wave.
The 0.236 Fibonacci ratio of primary wave 1 at 3,258.59 has been passed. The next target is now the 0.382 Fibonacci ratio at 3,054.74. If price falls through that preferred target, then the 0.618 Fibonacci ratio at 2,725.23 would be the next target.
Primary wave 2 is labelled as a zigzag, which is the most likely structure to unfold. However, it may also unfold as a double zigzag, double combination or flat correction. Labelling within primary wave 2 may yet need to be changed.
If primary wave 2 is unfolding as a zigzag, then within it intermediate waves (A) and (B) may be complete. Intermediate wave (C) may continue lower next week as an impulse. Minor wave 2 within intermediate wave (C) may not move beyond the start of minor wave 1 above 3,428.92. A new high in the short term above 3,428.92 may indicate an end to primary wave 2. At that stage, technical analysis would look for bullish indications that a low may be in place.
A breach of the small channel drawn about primary wave 2 by a full daily candlestick above and not touching the upper edge would add confidence that primary wave 2 may be over.
SECOND WAVE COUNT
DAILY CHART
Click chart to enlarge.
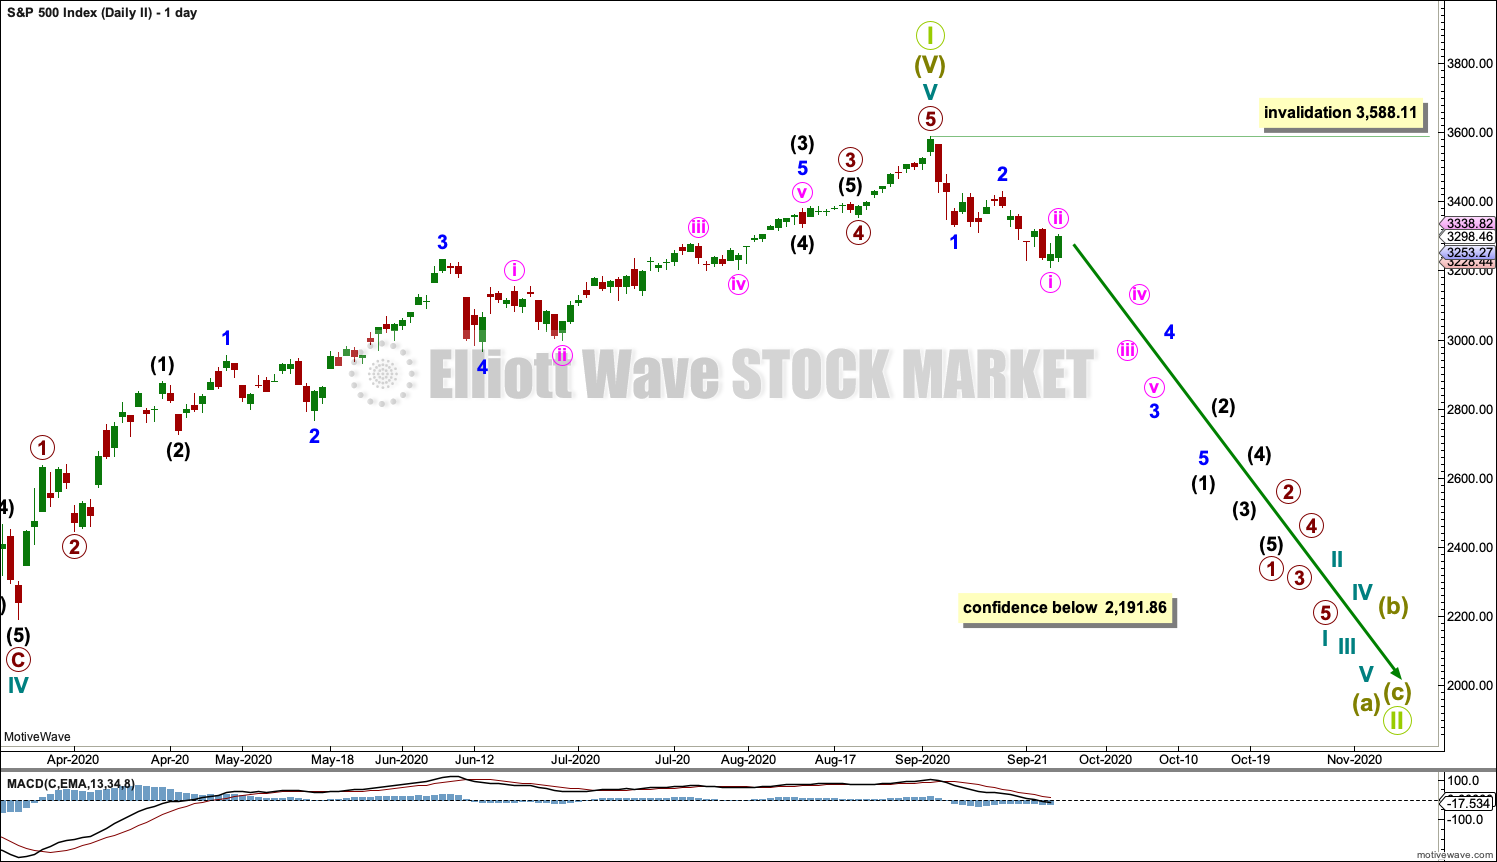
This wave count is the same as the first wave count with the exception of the degree of labelling within cycle wave V. If the degree of labelling is moved up one degree, then it is possible that cycle wave V to end Super cycle wave (V) to end Grand Super Cycle wave I is complete.
A new low below 2,191.86 would add confidence in this wave count. At that stage, the first wave count would be invalidated.
A new bear market at Grand Super Cycle degree may be expected to last over a decade. It may take price below the start of Super Cycle wave (V) at 666.79 in March 2009.
TECHNICAL ANALYSIS
WEEKLY CHART
Click chart to enlarge. Chart courtesy of StockCharts.com.
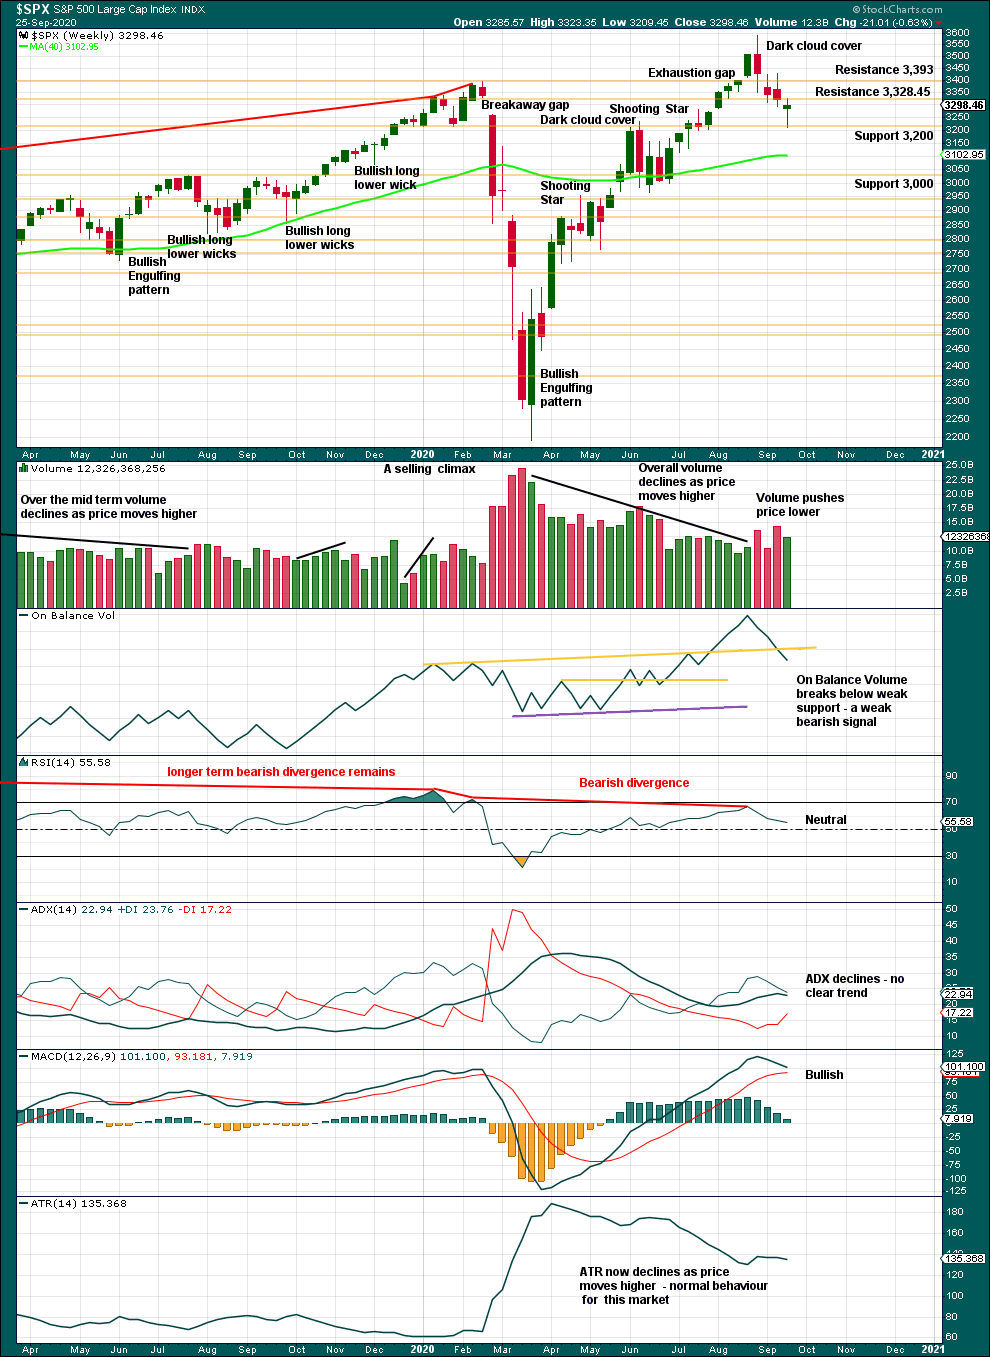
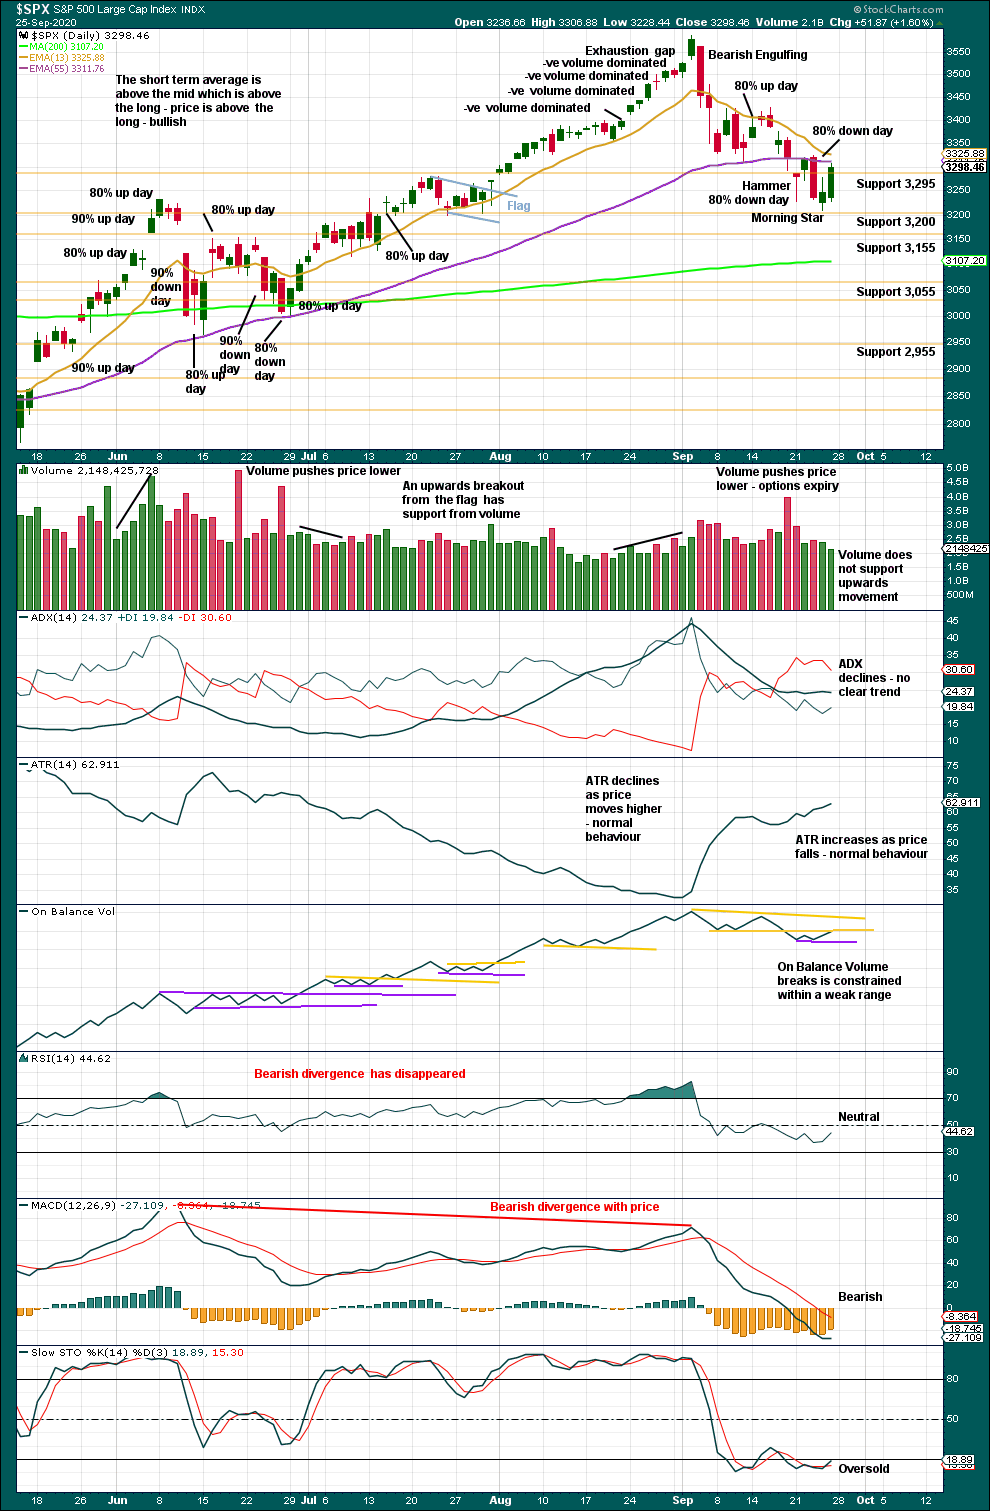
A doji this week represents a pause and is not on its own a reversal pattern. Doji in down trends do not hold as much significance as when they occur in up trends.
This week the bearish signal from On Balance Volume supports the view that price may continue to fall next week.
DAILY CHART
Click chart to enlarge. Chart courtesy of StockCharts.com.
Selling normally intensifies near lows. Two 80% down days (both near 90% down days but not quite) within the last five sessions suggests selling is intensifying. With Stochastics oversold and price bouncing up off support about 3,200, it is possible that a low may be in place here.
However, the return of strength in buying is absent. Although Friday saw a strong green candlestick to complete a Morning Star pattern, it lacks support from volume which significantly weakens the reversal pattern.
If one 90% upwards day or two back to back 80% upwards days complete next week, then confidence that a low is in place may be had. That has not happened yet, so it may be wisest to expect the pullback to continue lower.
BREADTH – AD LINE
WEEKLY CHART
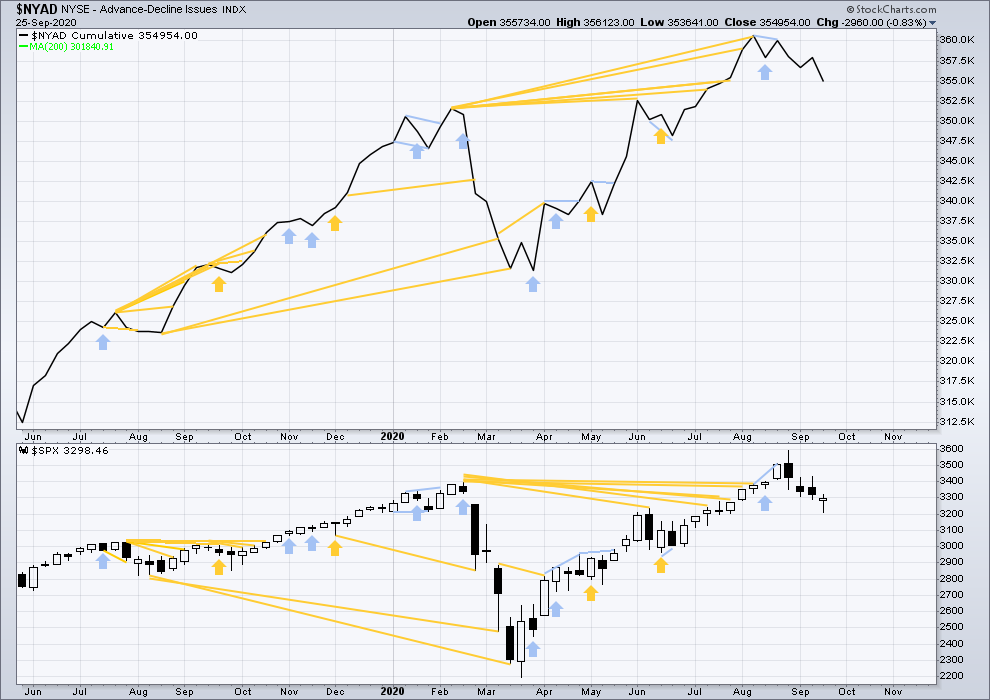
Click chart to enlarge. Chart courtesy of StockCharts.com. So that colour blind members are included, bearish signals will be noted with blue and bullish signals with yellow.
Breadth should be read as a leading indicator.
Lowry’s Operating Companies Only AD line has still not made new all time highs. The last high for the OCO AD line was in the week beginning January 13, 2020. There was 7 and a half months of bearish divergence between price and the OCO AD line at the September high. This may now support the more bearish second wave count. It is possible now that a major trend change may have ocurred.
The NYSE All Issues AD line made new highs in the week beginning 1st of June.
This week both price and the AD line have declined. There is no new divergence.
Large caps all time high: 3,588.11 on September 2, 2020.
Mid caps all time high: 2,109.43 on February 20, 2020.
Small caps all time high: 1,100.58 on August 27, 2018.
This rise has been led by large caps, which is a feature of an aged bull market. Only large caps have made new highs above the last swing high of the 11th of August.
DAILY CHART
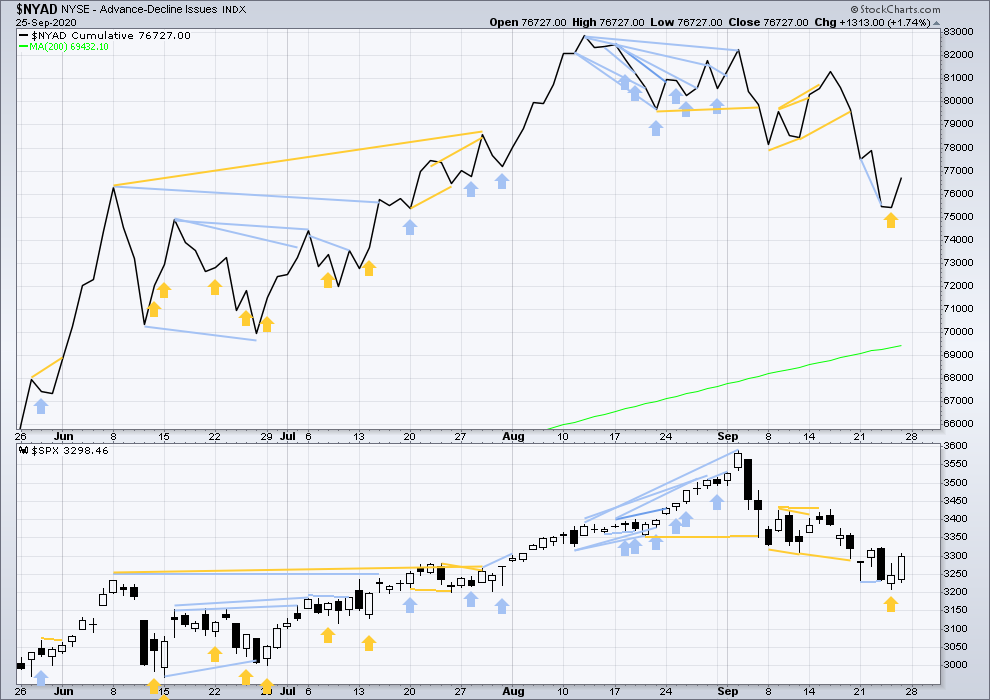
Click chart to enlarge. Chart courtesy of StockCharts.com. So that colour blind members are included, bearish signals will be noted with blue and bullish signals with yellow.
Bullish divergence noted in last analysis has been followed by some upwards movement, so it may be resolved.
On Friday both price and the AD line have moved higher. There is no new divergence.
VOLATILITY – INVERTED VIX CHART
WEEKLY CHART
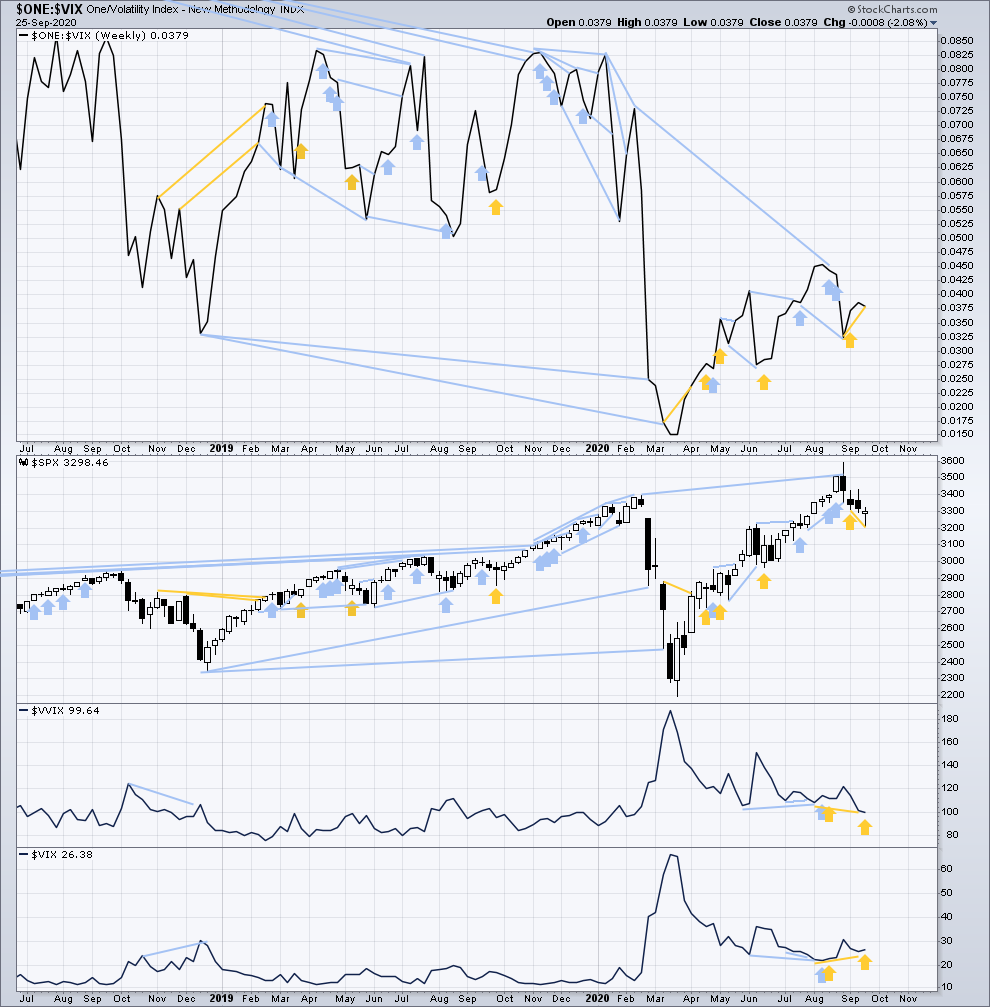
Click chart to enlarge. Chart courtesy of StockCharts.com. So that colour blind members are included, bearish signals will be noted with blue and bullish signals with yellow.
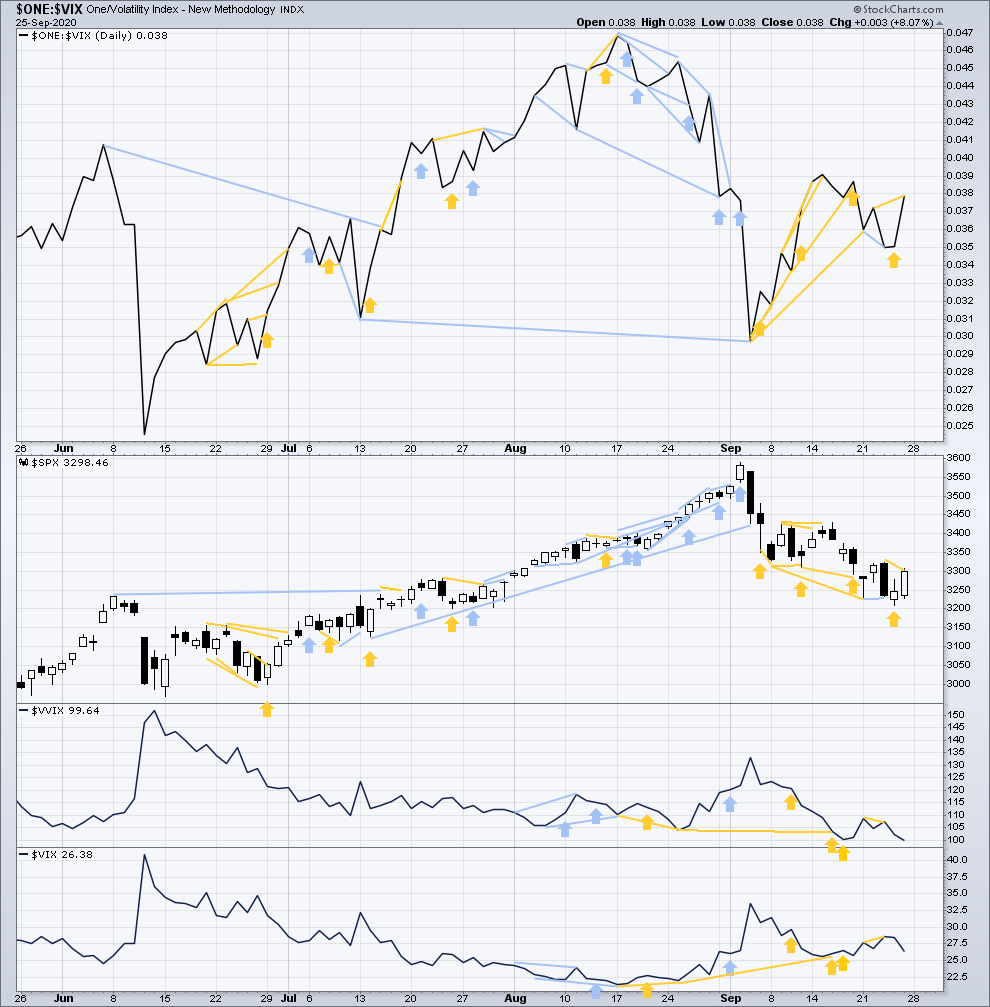
Inverted VIX remains well below all time highs. The all time high for inverted VIX was in the week beginning October 30, 2017. There is nearly 3 years of bearish divergence between price and inverted VIX. There is all of long, mid and short-term bearish divergence.
This week price has moved lower to make a new short-term low below the low of two weeks prior, but inverted VIX has not made a corresponding new low. This divergence is bullish for the short term.
Comparing VIX and VVIX: This week VIX has increased, but VVIX has declined. This divergence is bullish for price in the very short term.
DAILY CHART
Click chart to enlarge. Chart courtesy of StockCharts.com. So that colour blind members are included, bearish signals will be noted with blue and bullish signals with yellow.
Bullish divergence noted in last analysis has been followed by upwards movement, so it may be resolved.
On Friday inverted VIX made a new short-term swing high, but price has not. This divergence is bullish for the short term.
Inverted VIX remains well above lows of the 3rd to 8th of September, but price is below. This divergence remains bullish.
Comparing VIX and VVIX at the daily chart level: VVIX is declining faster than VIX for the short term. This is bullish for price in the short term.
DOW THEORY
Dow Theory still concludes a bear market is in place.
Dow Theory confirmed a bear market with the following lows made on a closing basis:
DJIA: 21,712.53 – a close below this point was been made on the March 12, 2020.
DJT: 8,636.79 – a close below this point was been made on March 9, 2020.
Adding in the S&P and Nasdaq for an extended Dow Theory, a bear market was confirmed:
S&P500: 2,346.58 – a close below this point was made on March 20, 2020.
Nasdaq: 7,292.22 – a close below this point was made on the March 12, 2020.
At this time, to shift Dow Theory from viewing a bear market to confirmation of a new bull market would require new highs made on a closing basis:
DJIA: 29,568.57
DJT: 11,623.58
Adding in the S&P and Nasdaq for an extended Dow Theory, confirmation of a bull market would require new highs made on a closing basis:
S&P500: 3,393.52 – closed above on 21st August 2020.
Nasdaq: 9,838.37 – closed above on June 8, 2020.
GOLD
A small inside day leaves all three Elliott wave counts the same.
Summary: The first Elliott wave count now expects upwards movement to 2,160.
A target calculated from the classic symmetrical triangle pattern is at 1,712. Classic technical analysis expects price to keep moving lower here for another one to few weeks.
The alternate Elliott wave count now expects a downwards trend is underway. The next short-term target is at 1,837, and the invalidation point is at 1,908.38.
A new low below 1,764.12 at any time frame would invalidate the first daily chart and add confidence in an alternate daily chart. At that stage, a sustainable high would be in place and a new downwards trend to last months may be underway.
Grand SuperCycle analysis is here.
Last analysis of monthly charts is here with video here.
FIRST ELLIOTT WAVE COUNT
WEEKLY CHART
Click chart to enlarge.
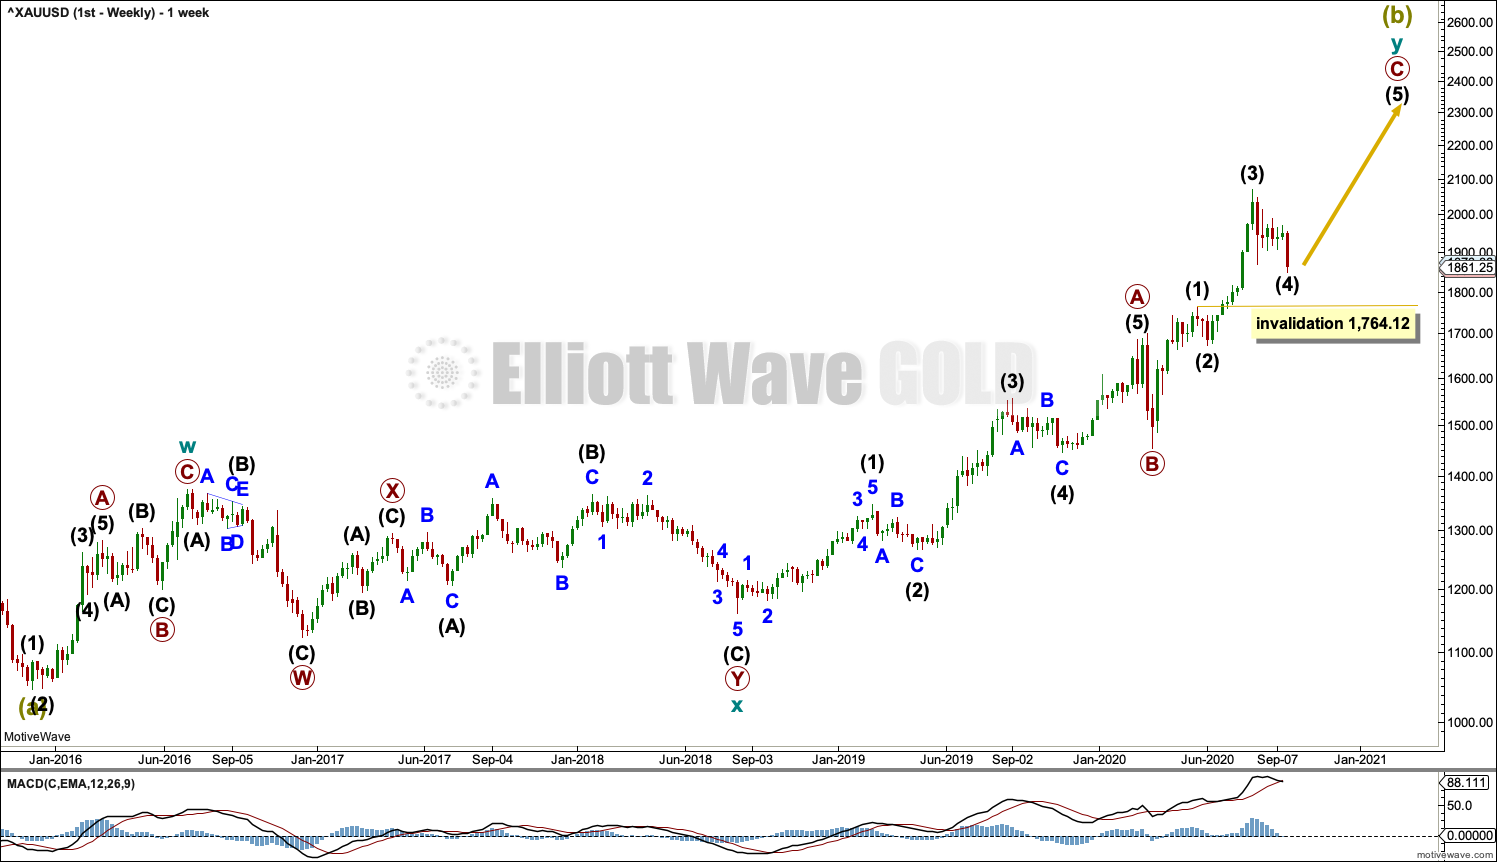
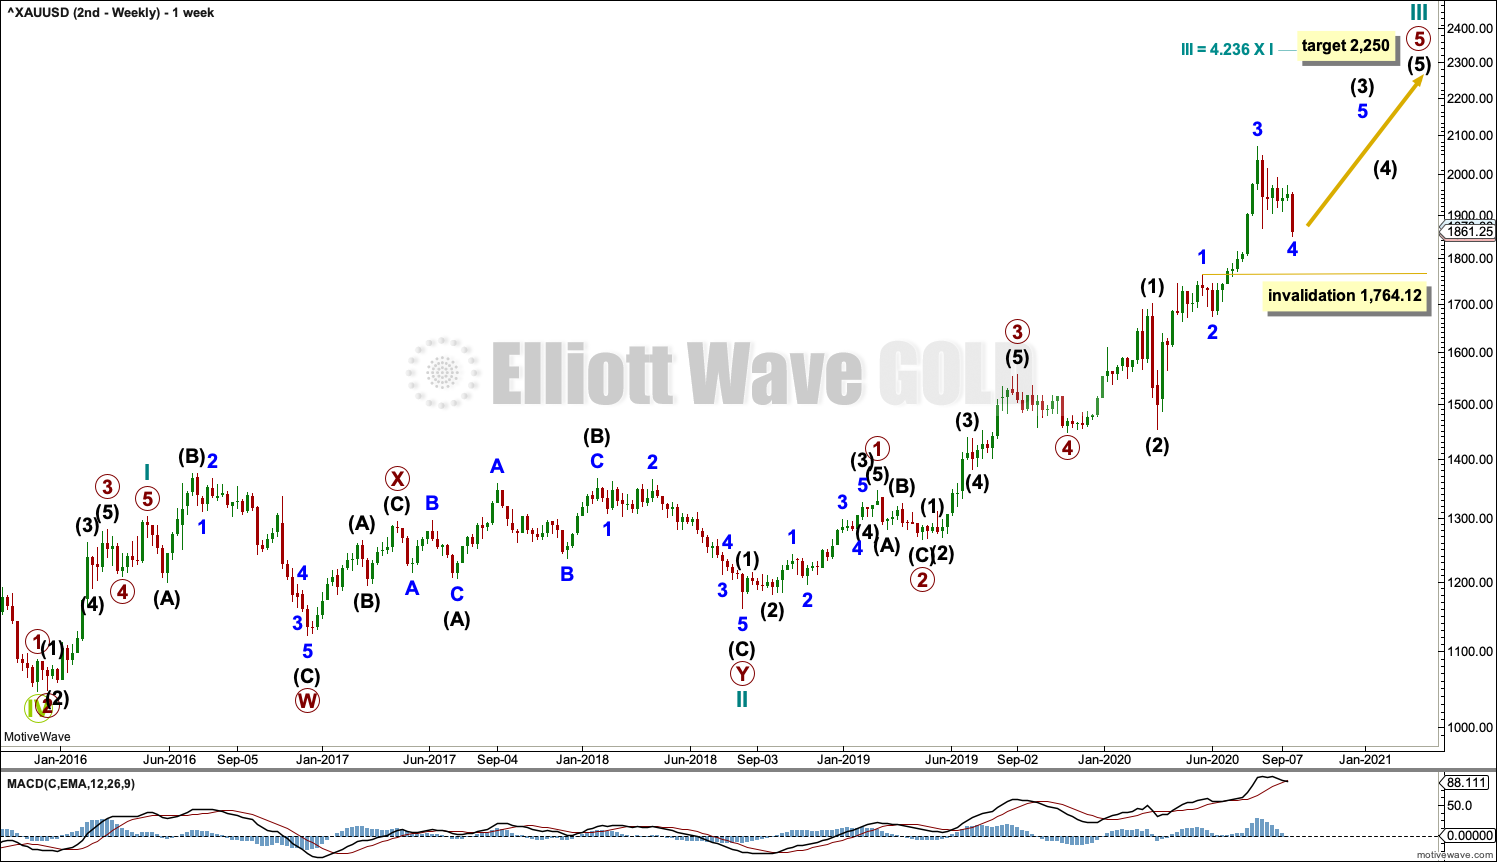
The bigger picture for this first Elliott wave count sees Gold as still within a bear market, in a three steps back pattern that is labelled Grand Super Cycle wave IV on monthly charts. Grand Super Cycle wave IV may be subdividing as an expanded flat pattern. The common range for Super Cycle wave (b) within a flat is from 1 to 1.38 times the length of Super cycle wave (a), giving a range from 1,920.18 to 2,252.27. The target would see Super Cycle wave (b) end within this most common range.
Super Cycle wave (b) within Grand Super Cycle wave IV may be an incomplete double zigzag. When Super Cycle wave (b) may be complete, then this wave count expects Super Cycle wave (c) to begin and to move price below the end of Super Cycle wave (a) at 1,046.27.
The first zigzag in the double is labelled cycle wave w. The double is joined by a three in the opposite direction, a combination labelled cycle wave x. The second zigzag in the double is labelled cycle wave y.
The purpose of the second zigzag in a double is to deepen the correction. Cycle wave y has achieved this purpose.
Primary wave C within cycle wave y may be subdividing as an impulse. Intermediate waves (1) through to (4) within primary wave C may be complete. If it continues any lower, then intermediate wave (4) may not move into intermediate wave (1) price territory below 1,764.12.
We should always assume the trend remains the same until proven otherwise. At this stage, Gold is in a bull market.
DAILY CHART
Click chart to enlarge.
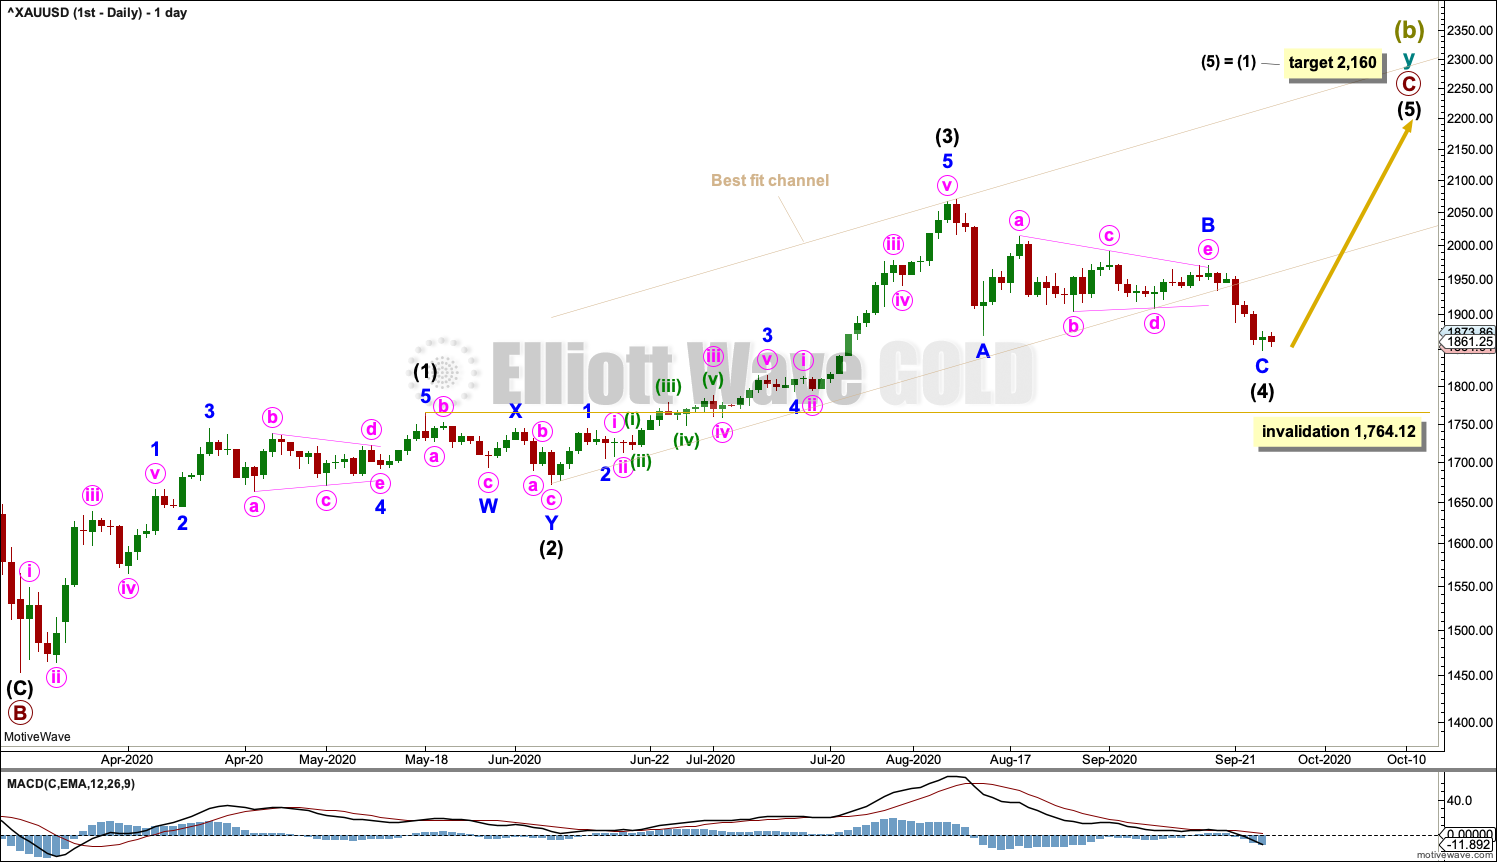
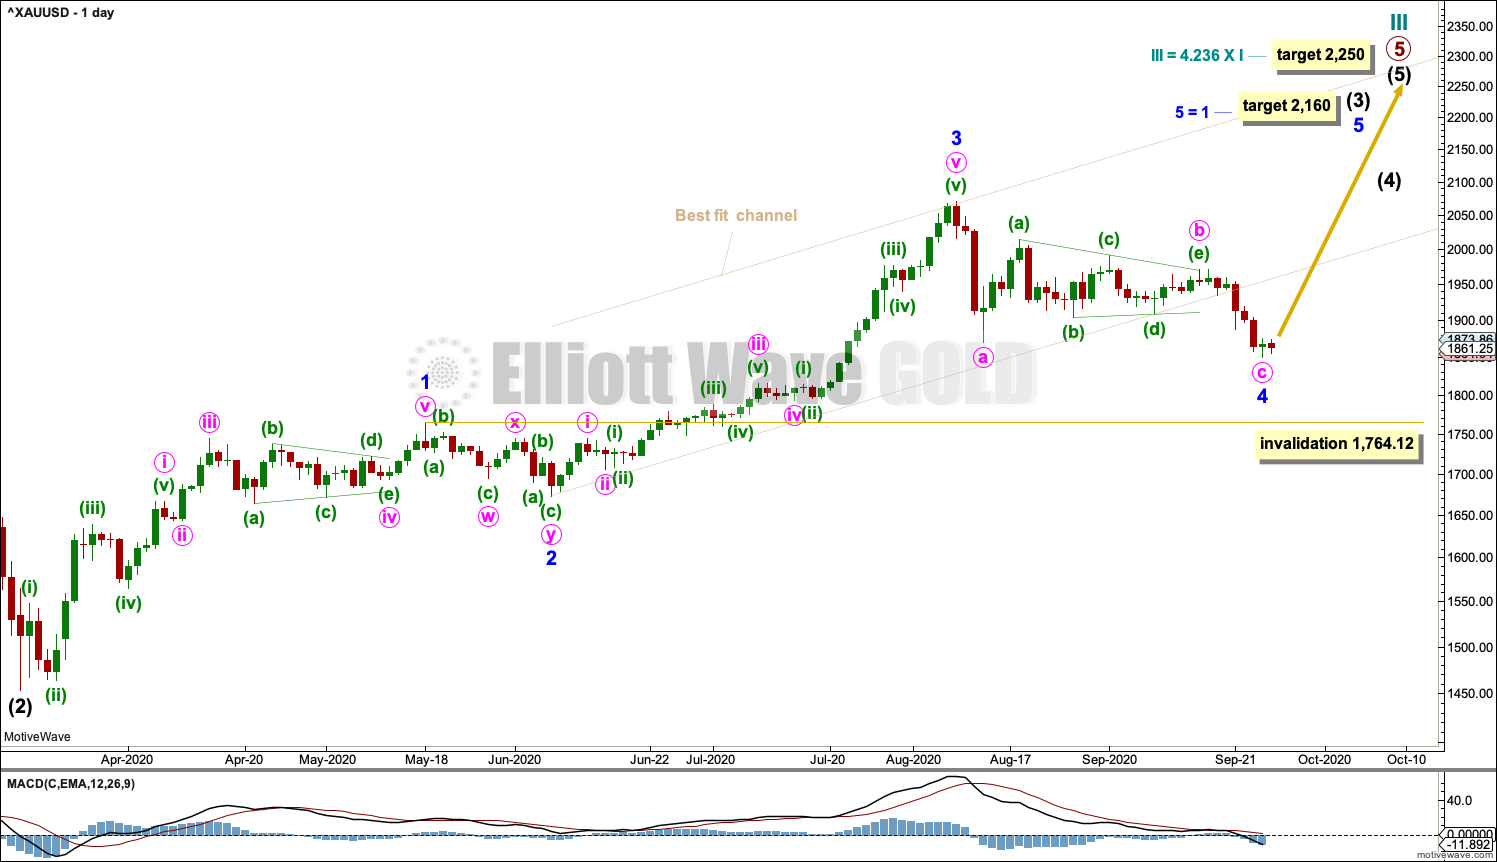
The daily chart shows detail of primary wave C as an incomplete impulse.
Intermediate waves (1) through to (4) within primary wave C may be complete. Intermediate wave (4) may be a complete zigzag.
The channel is drawn as a best fit. The lower edge is breached by downwards movement, suggesting a trend change. The first alternate wave count below should be now more seriously considered.
Intermediate wave (2) was a shallow double zigzag, lasting 15 sessions. Intermediate wave (4) may be an incomplete zigzag. Minor wave B within intermediate wave (4) may have been a triangle. Intermediate wave (4) may not move into intermediate wave (1) price territory below 1,764.12.
A new target is calculated for intermediate wave (5) that expects it to exhibit the most common Fibonacci ratio to intermediate wave (1).
ALTERNATE DAILY CHART
Click chart to enlarge.
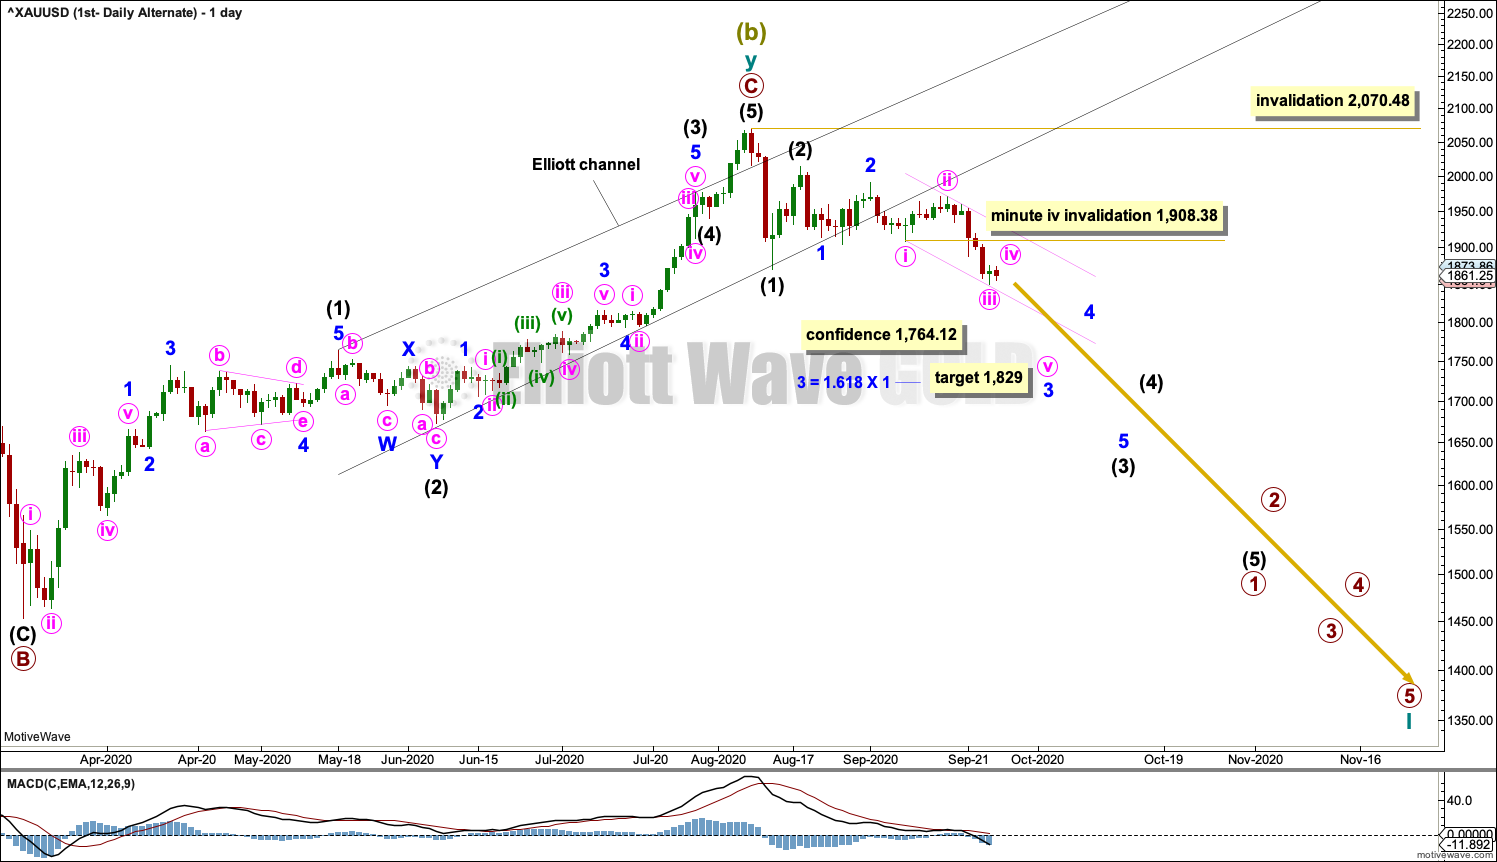
It is also possible that a Super Cycle degree trend change has occurred at the last high. However, we should always assume the trend remains the same until proven otherwise. Assume the upwards trend remains in place and the main wave count is correct until the upwards trend is invalidated with a new low below 1,764.12. At that stage, this would become the main wave count.
Intermediate wave (2) may be a complete zigzag. Intermediate wave (3) may have begun.
There may be a series of three overlapping first and second waves to begin the new downwards trend. Price may now be moving to the end of minute wave iii.
Fifth waves to end third waves one degree higher for Gold fairly often end with strength. This wave count may see strong downwards momentum and volume at the end of one or both of minute wave v to end minor wave 3, and minor wave 5 to end intermediate wave (3).
For the short term, minute wave iv may not move into minute wave i price territory above 1,908.38.
A target is now calculated for minor wave 3 to end. If this target is wrong, then it may not be low enough.
When it arrives, primary wave 2 may not move beyond the start of primary wave 1 above 2,070.48.
Super Cycle wave (c) would be likely to make at least a slight new low below the end of Super Cycle wave (a) at 1,046.27 to avoid a truncation. If price provides confidence in this wave count with a new low below 1,764.12, then a target would be calculated for Super Cycle wave (c) to end.
SECOND ELLIOTT WAVE COUNT
WEEKLY CHART
Click chart to enlarge.
This wave count sees the the bear market complete at the last major low for Gold on 3 December 2015.
If Gold is in a new bull market, then it should begin with a five wave structure upwards on the weekly chart.
Cycle wave I fits as a five wave impulse with reasonably proportionate corrections for primary waves 2 and 4.
Cycle wave II fits as a double flat. However, within the first flat correction labelled primary wave W, this wave count needs to ignore what looks like an obvious triangle from July to September 2016 (this can be seen labelled as a triangle on the first wave count above). This movement must be labelled as a series of overlapping first and second waves. Ignoring this triangle reduces the probability of this wave count in Elliott wave terms.
Cycle wave III may be incomplete. Minor wave 4 within primary wave 5 may not move into minor wave 1 price territory below 1,764.12.
DAILY CHART
Click chart to enlarge.
Cycle wave III may be continuing higher. The daily chart focusses on primary wave 5 within cycle wave III.
Minor wave 4 may be a complete zigzag. Minute wave b within the zigzag may be a complete triangle.
If minor wave 4 continues lower, then it may not move into minor wave 1 price territory below 1,764.12.
TECHNICAL ANALYSIS
WEEKLY CHART
Click chart to enlarge. Chart courtesy of StockCharts.com.
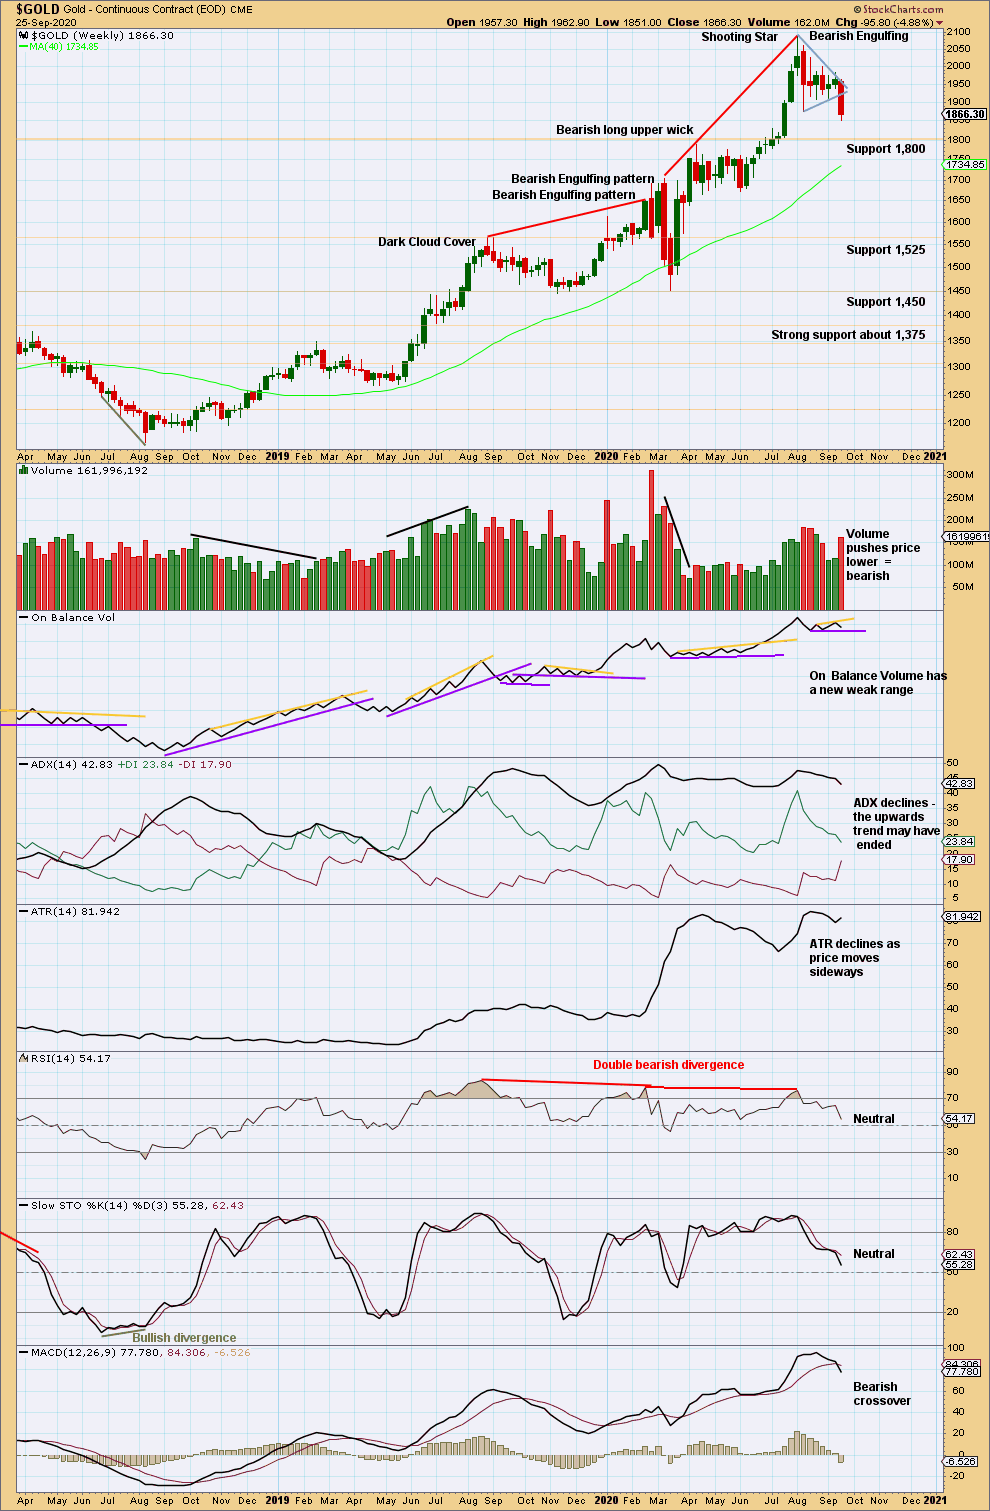
Price has broken out downwards from a small triangle this week. Look for next support about 1,800.
At the last high were two bearish candlestick patterns with overbought RSI exhibiting double bearish divergence. It is possible there may have been a 180° trend change at the high. A new swing low below 1,671.70 would add confidence in that view.
DAILY CHART
Click chart to enlarge. Chart courtesy of StockCharts.com.
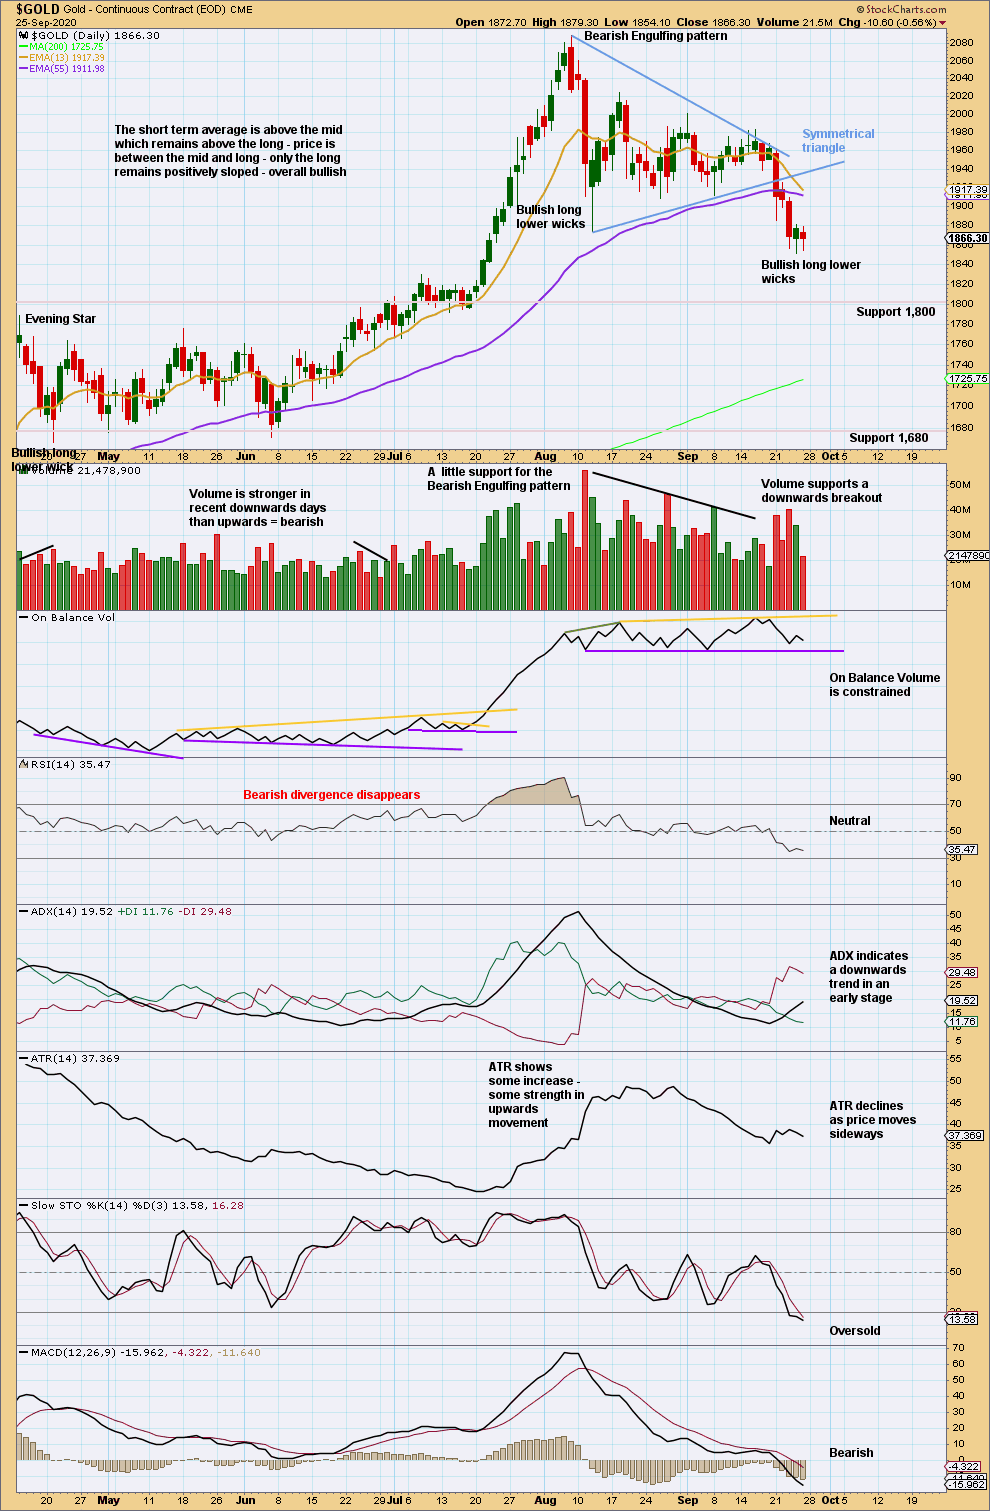
There is a strong downwards breakout from the symmetrical triangle. A target calculated from the width of the base of the triangle is at 1,712.
From Kirkpatrick and Dhalquist regarding symmetrical triangles:
“Symmetrical triangles have many false breakouts and must be watched carefully…
Throwbacks… occur 37%… of the time, and, as in most patterns, when they occur, they detract from eventual performance. This implies that for actual investment or trading, the initial breakout should be acted upon, and if a pullback or throwback occurs, the protective stop should be tightened. It does not imply that a pullback or throwback should be ignored, but that instead, performance expectations should be less than if no pullback or throwback had occurred.
High volume on breakouts, both upward and downward, adds considerably to the performance of the formation and is something to look for. Overall performance is slightly below the mean for classic patterns.”
– Kirkpatrick, Charles D., II. Technical Analysis: The Complete Resource for Financial Market Technicians (p. 350). Pearson Education.
The small quick throwback on 22nd September may detract a little from the performance of this triangle, but this may be outweighed by the strong support from volume on the downwards breakout.
GDX WEEKLY CHART
Click chart to enlarge. Chart courtesy of StockCharts.com.
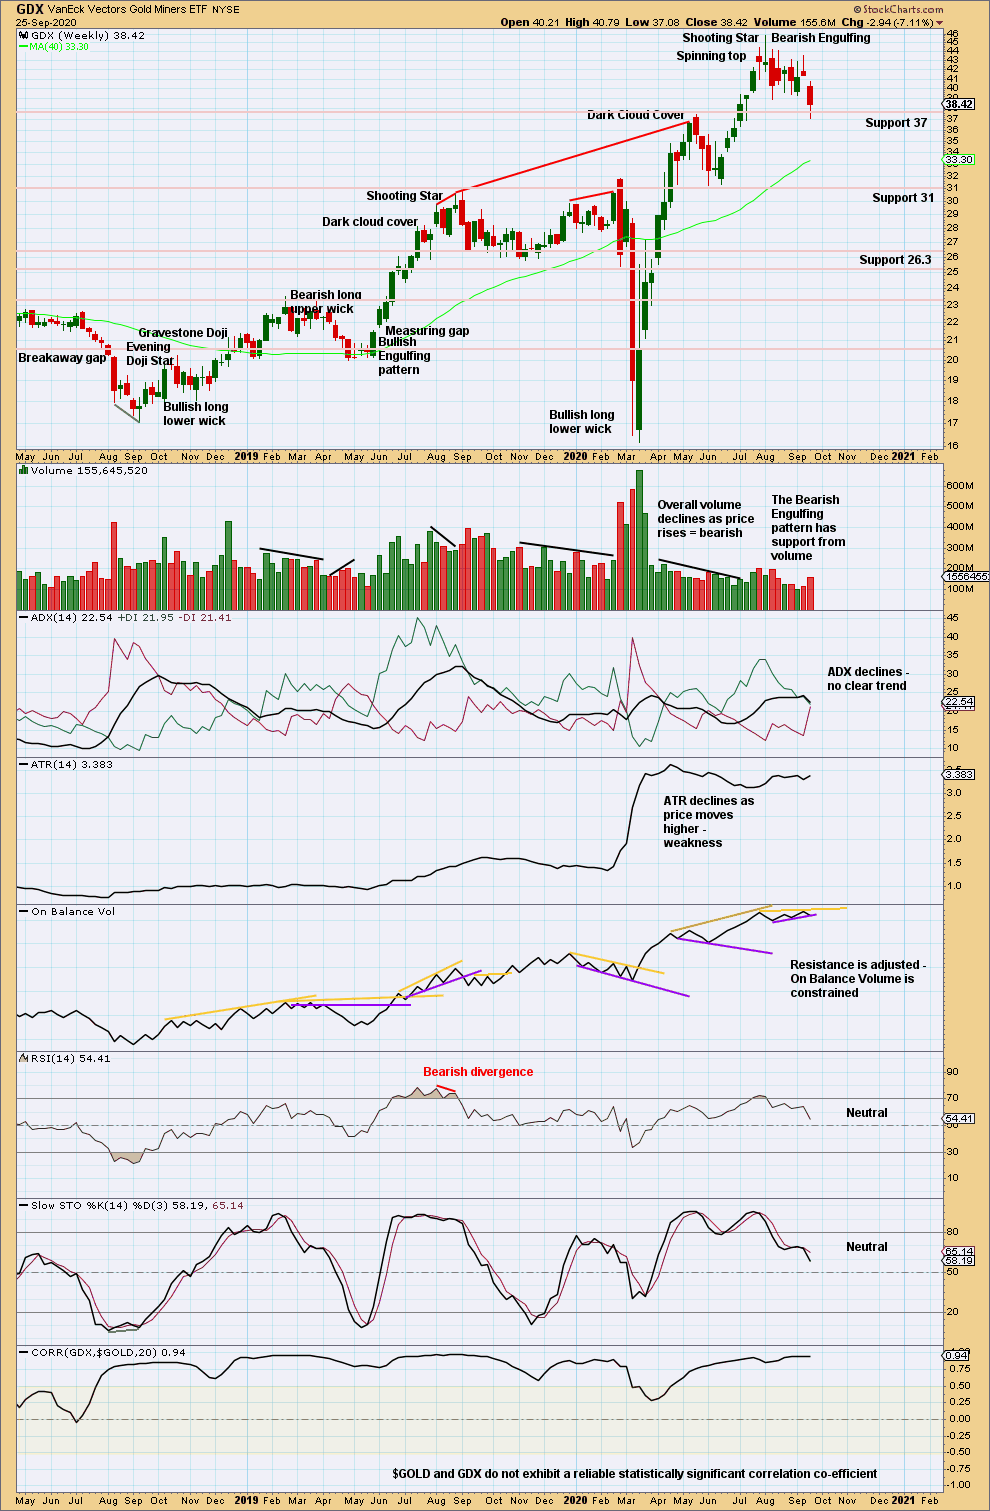
Now two bearish candlestick reversal patterns in a Shooting Star and a Bearish Engulfing pattern indicate a trend change. With RSI reaching overbought at the high, these signals should be given weight. A trend change may be either a 180° change or a change to a sideways consolidation. With a downwards breakout this week from a small sideways pattern, the probability here of a 180° reversal and a new downwards trend has increased.
GDX DAILY CHART
Click chart to enlarge. Chart courtesy of StockCharts.com.
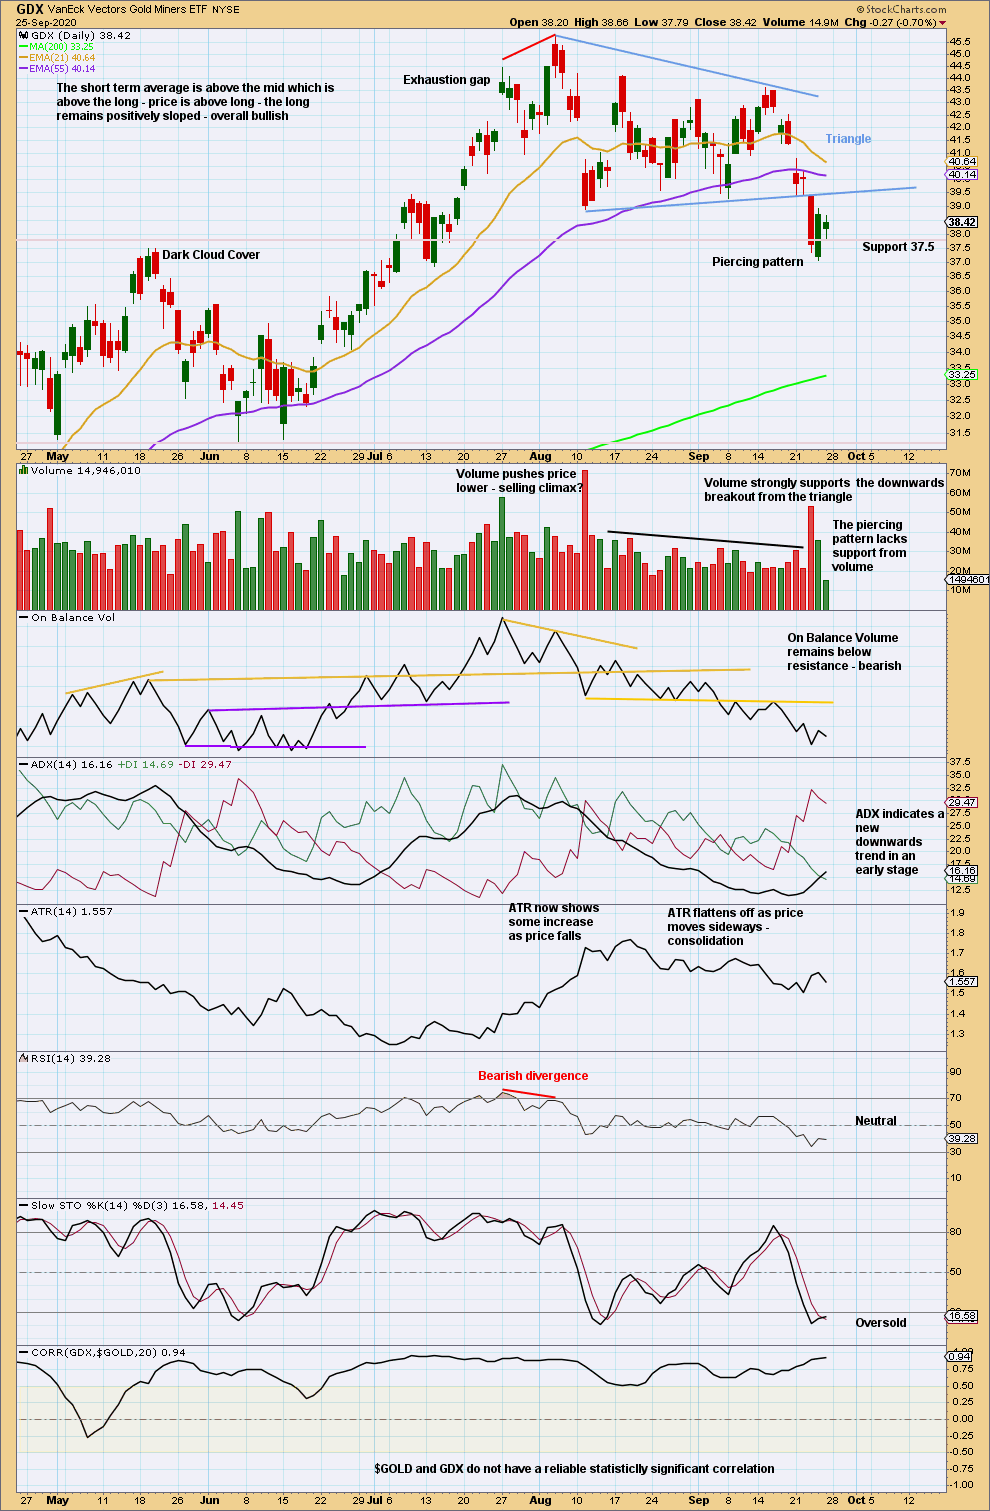
There is a downwards breakout from the triangle. A target is calculated from the width of the triangle at 32.55. The piercing pattern may indicate a throw back may have just begun.
US OIL
Sideways movement this week remains below the short-term invalidation point. All three daily Elliott wave counts remain the same.
Summary: Oil may have found a major sustainable low.
A multi-week pullback is expected to end about 23.05. It is possible the pullback may be deeper than this though; the first major correction within a new trend for Oil tends to be very deep.
When this pullback may be complete, then an upwards trend should resume with increased strength.
ELLIOTT WAVE COUNT
MONTHLY CHART
Click chart to enlarge.
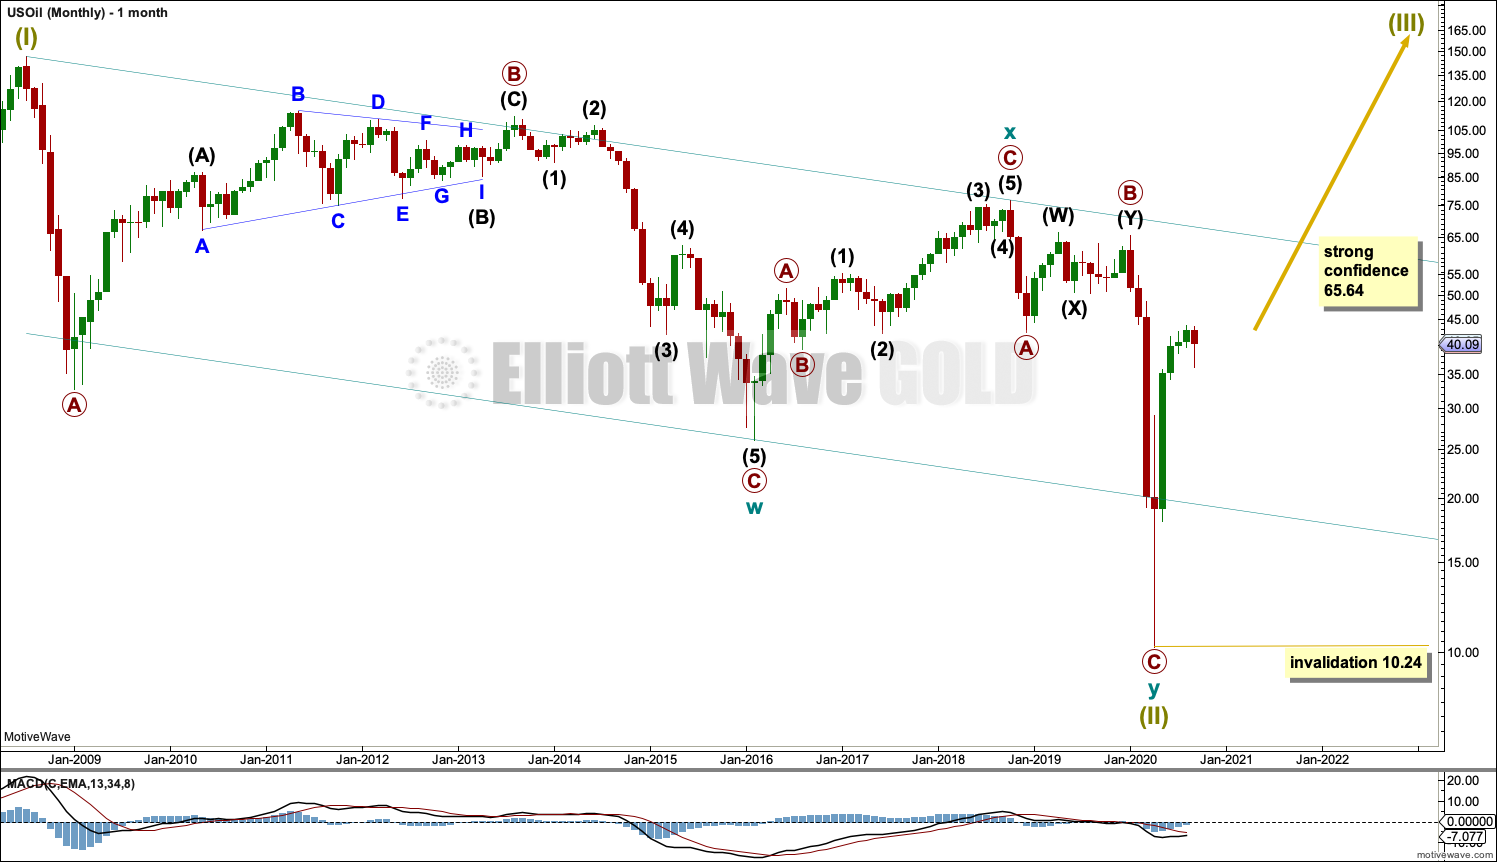
The basic Elliott wave structure is five steps forward and three steps back. This Elliott wave count expects that US Oil has completed a three steps back pattern, which began in July 2008. The Elliott wave count expects that the bear market for US Oil may now be over.
A channel is drawn about Super Cycle wave (II): draw the first trend line from the start of cycle wave w to the end of cycle wave x, then place a parallel copy on the end of cycle wave w. Price has bounced up off the channel. This trend line is breached, which is a typical look for the end of a movement for a commodity.
The upper edge of the channel may provide resistance.
Following five waves up and three steps back should be another five steps up; this is labelled Super Cycle wave (III), which may only have just begun. Super Cycle wave (III) may last a generation and must make a new high above the end of Super Cycle wave (I) at 146.73.
Super Cycle wave (III) may only subdivide as a five wave impulse. New trends for Oil usually start out very slowly with short first waves and deep time consuming second wave corrections. Basing action over a few years may now have begun.
WEEKLY CHART
Click chart to enlarge.
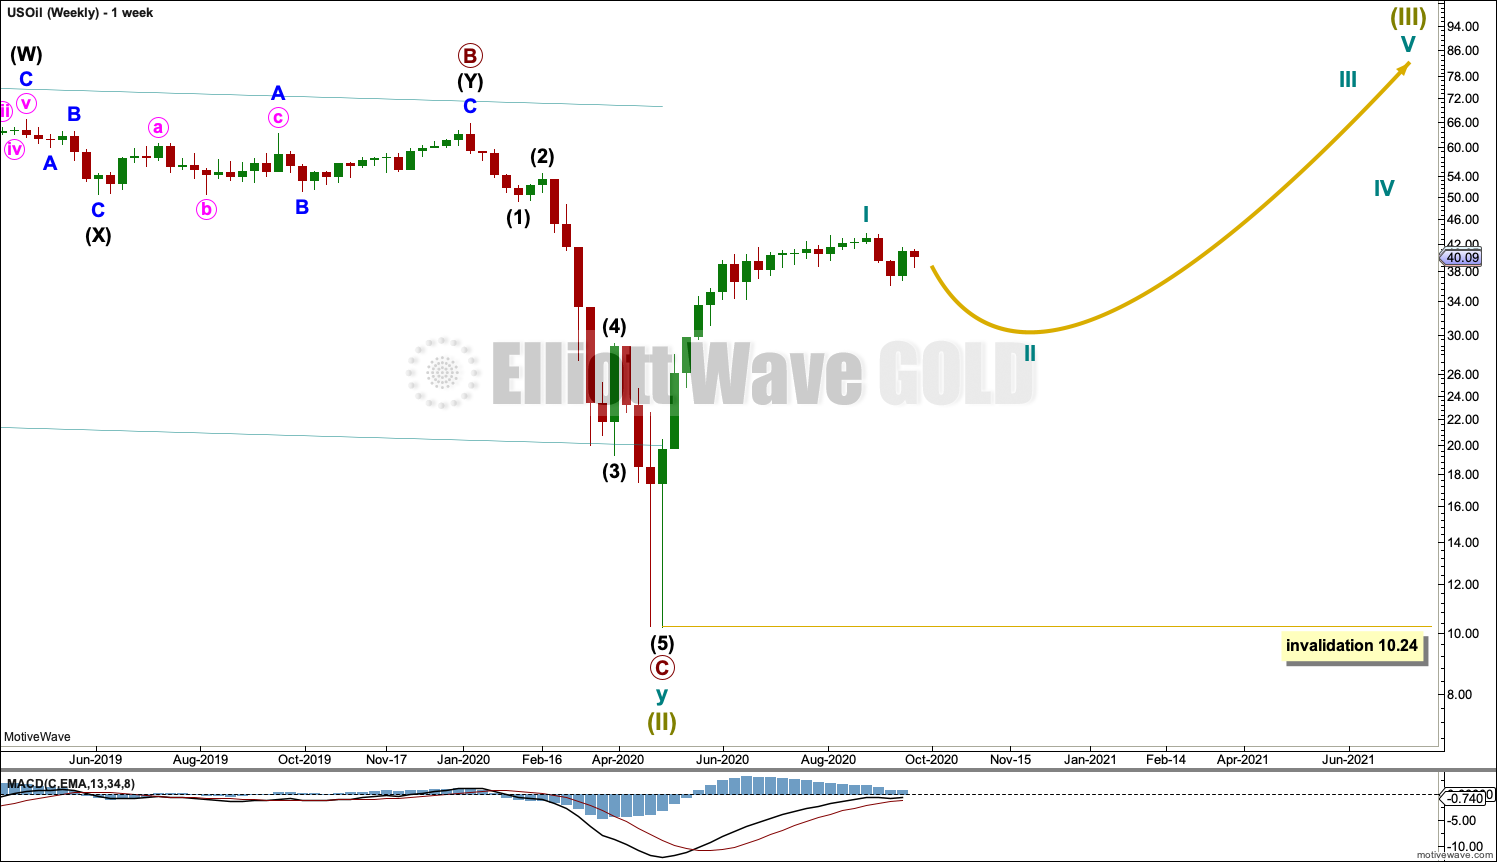
Super Cycle wave (III) must subdivide as an impulse. Cycle wave I within the impulse may be complete. Cycle wave II may not move beyond the start of cycle wave I below 10.24.
DAILY CHART
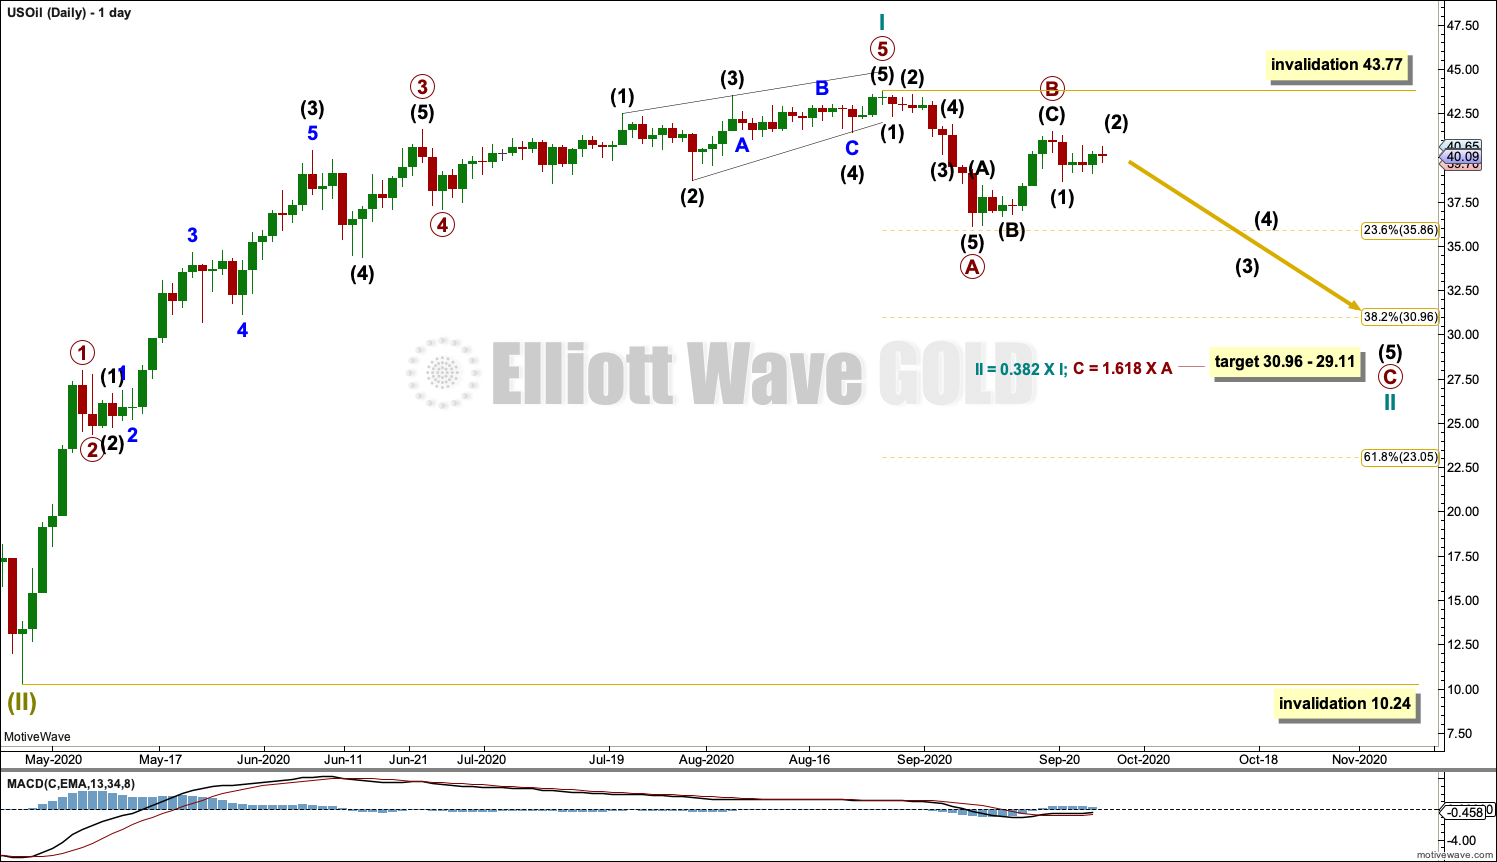
Click chart to enlarge.
Cycle wave I now looks very likely to be over.
Cycle wave II may subdivide as any corrective Elliott wave structure except a triangle. At this stage, cycle wave II may be an incomplete zigzag that may end close to the 0.382 Fibonaccci ratio. If it continues higher, then primary wave B within the zigzag may not move beyond the start of primary wave A above 43.77.
Cycle wave II may not move beyond the start of cycle wave I below 10.24.
FIRST ALTERNATE DAILY CHART
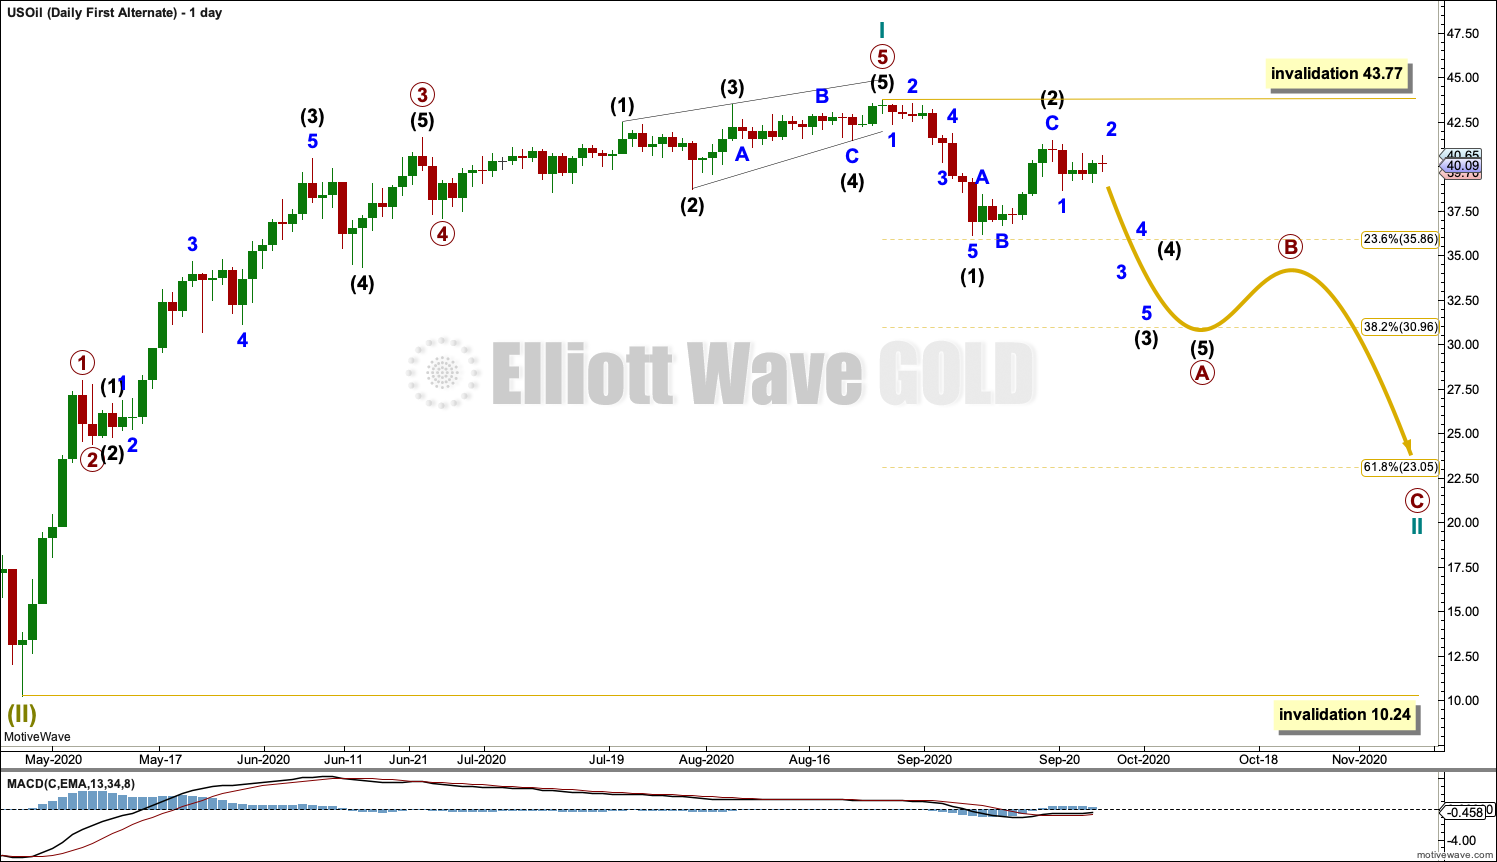
Click chart to enlarge.
This first alternate wave count moves the degree of labelling within cycle wave II down one degree.
Cycle wave II may be subdividing as a zigzag. Primary wave A within cycle wave II may be an incomplete impulse.
If it continues higher, then intermediate wave (2) within primary wave A may not move beyond the start of intermediate wave (1) above 43.77.
The 0.618 Fibonacci ratio of cycle wave I at 23.05 is a preferred target, but it is possible that cycle wave II may be deeper than this.
Although this wave count is named an alternate, it has about an even probability with the main wave count above.
SECOND ALTERNATE DAILY CHART
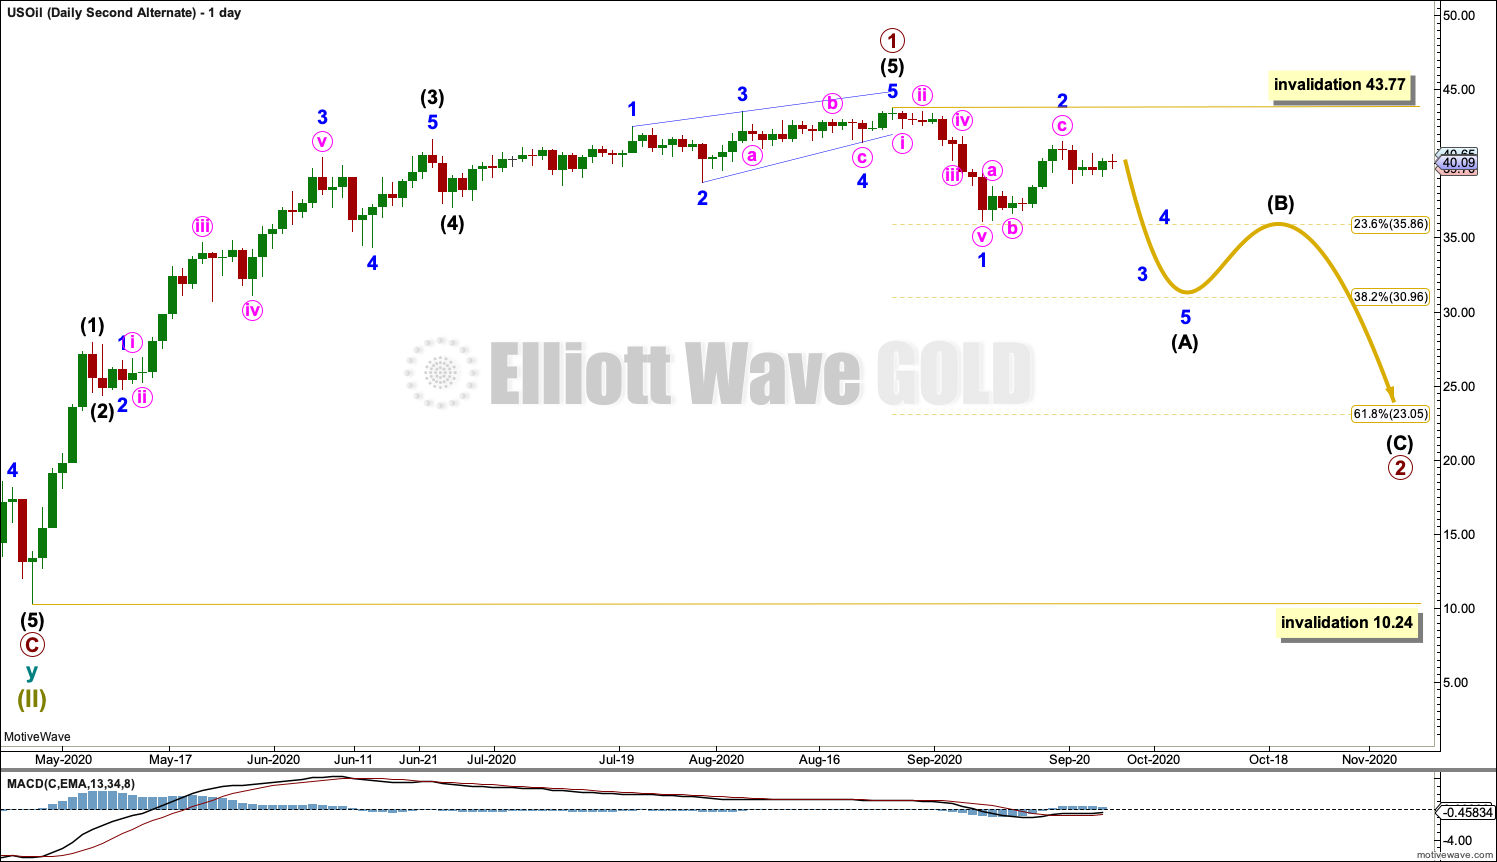
Click chart to enlarge.
It is also possible that the degree of labelling at the daily chart level may need to be changed back down one degree. It may be that only primary wave 1 is complete within cycle wave I and the current pullback may be primary wave 2.
Primary wave 2 may last several weeks to a few months.
TECHNICAL ANALYSIS
WEEKLY CHART
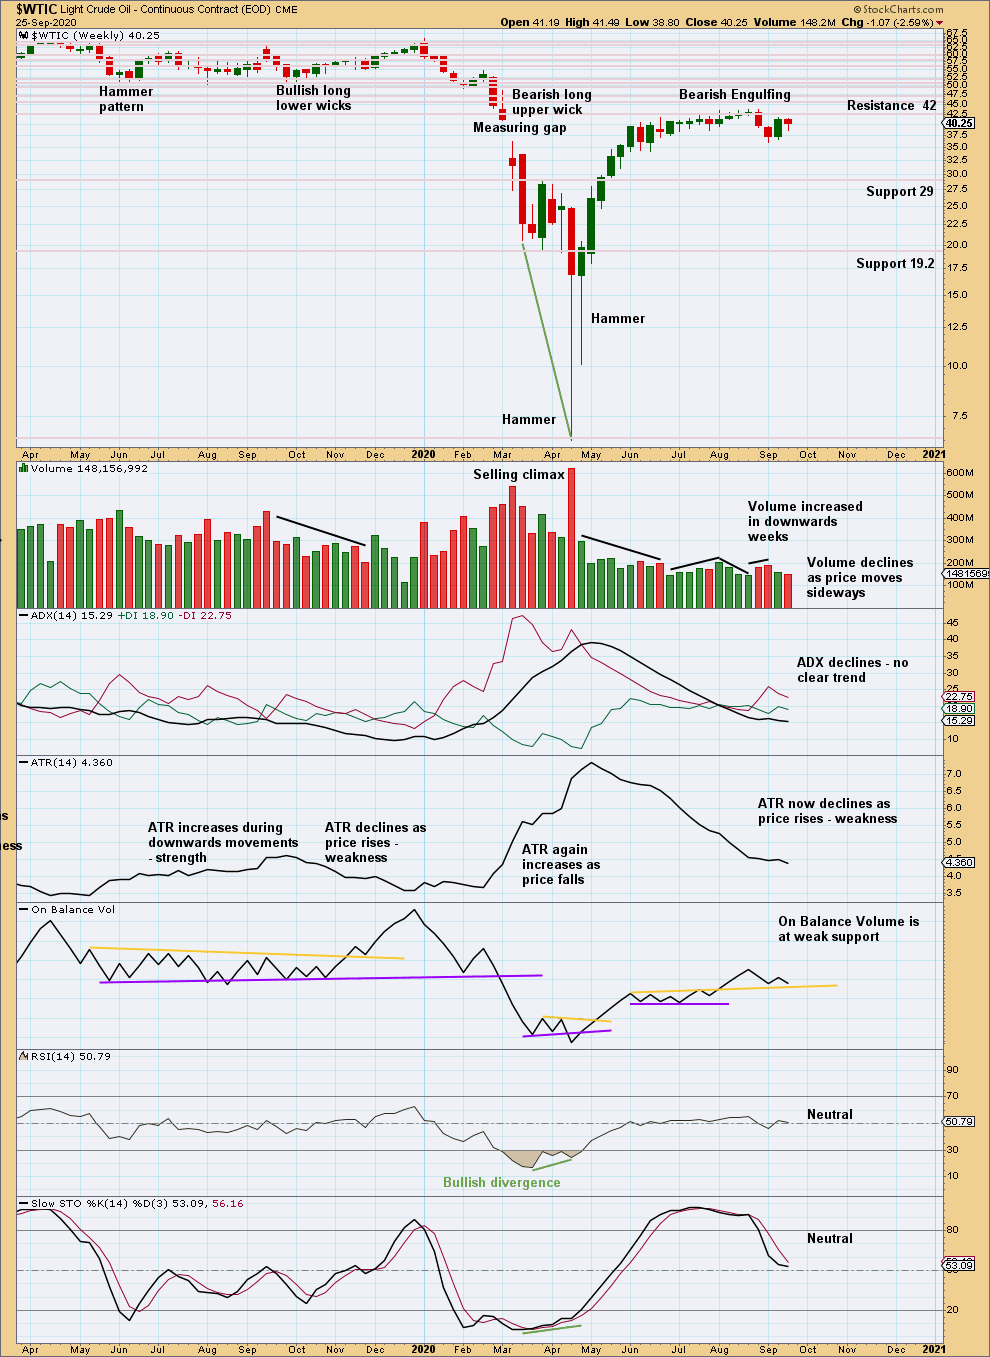
Click chart to enlarge. Chart courtesy of StockCharts.com.
Price has not yet reached support. Stochastics is not yet oversold. There is room for more downwards movement.
DAILY CHART
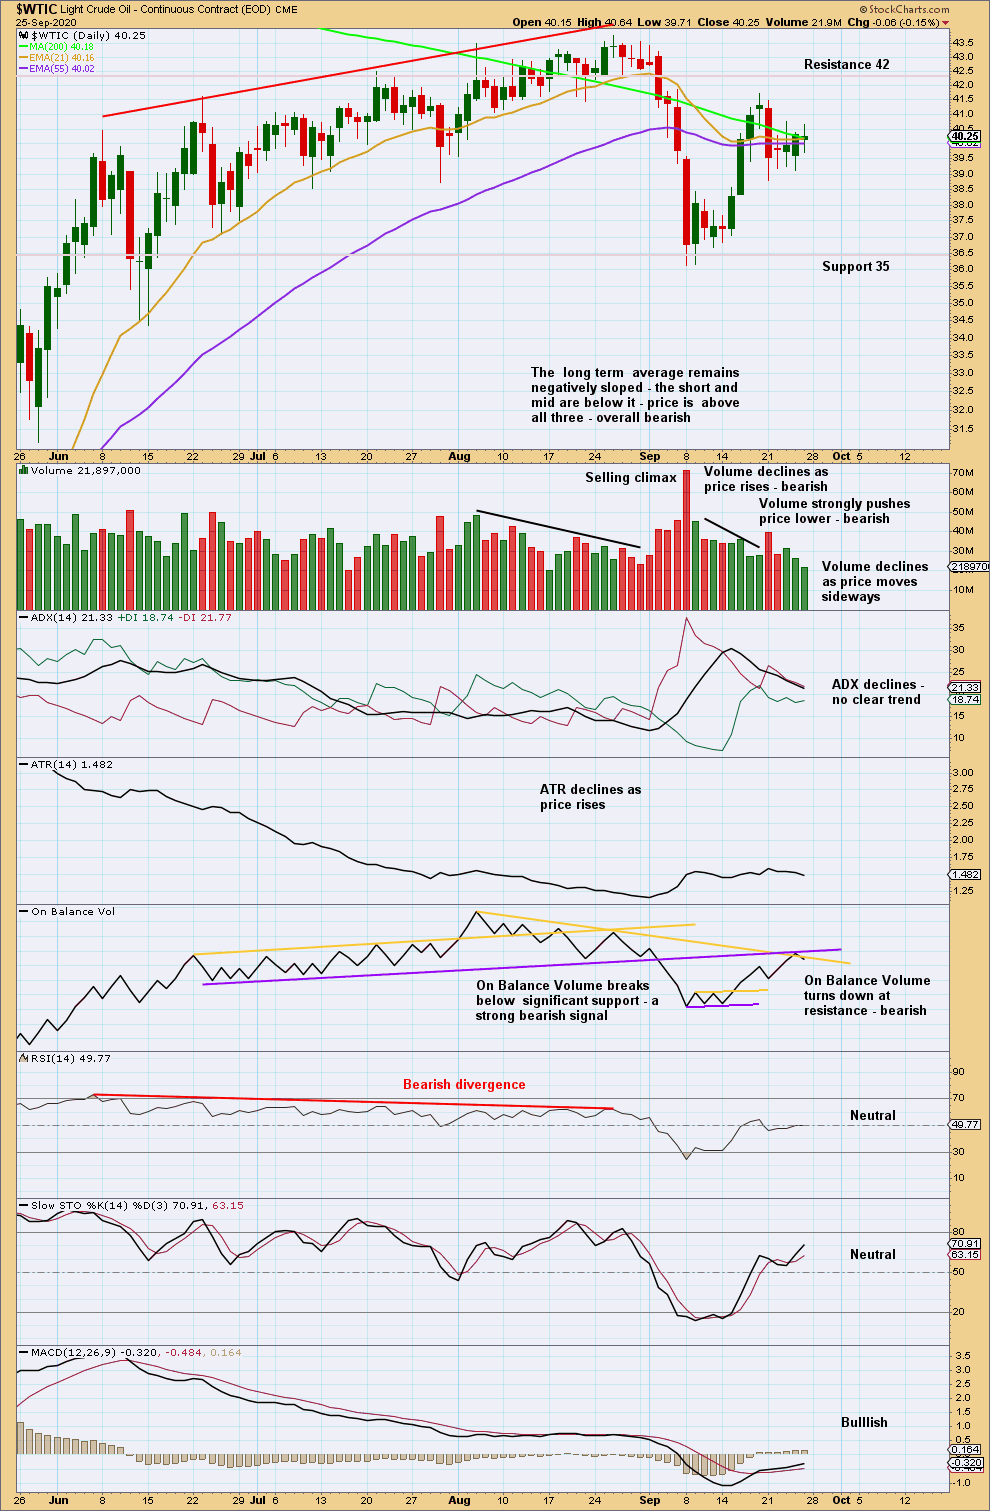
Click chart to enlarge. Chart courtesy of StockCharts.com.
This bounce may be a test of resistance after a break below support.
There is a bullish Piercing pattern at the low, but it is weak and lacks support from volume, so it is not convincing.
Conditions did not reach oversold and price did not reach next support on this pullback.
The short-term volume profile is bearish. On Balance Volume is bearish. This supports the Elliott wave counts.
—
Always practice good risk management as the most important aspect of trading. Always trade with stops and invest only 1-5% of equity on any one trade. Failure to manage risk is the most common mistake new traders make.