
Lara’s Weekly: Elliott Wave and Technical Analysis of S&P500 and Gold and US Oil | Charts – June 26, 2020

S&P 500
Downwards movement overall has been expected for the week and overall this is how the week ended.
Summary: The bounce may be over. Downwards movement may resume. A mid-term target is at 2,723. The gap that forms the new Abandoned Baby pattern may provide resistance at 3,127.12.
For the long term, a sustainable high may now be in place on June 8th. The main wave count has two final targets at 2,031 and 1,708. The daily alternate wave count has a target at 1,289 for a third wave down.
A new low below 2,954.86 would invalidate the third alternate wave count and provide confidence in downwards targets.
The third alternate wave count outlines a bullish scenario. A new high above 3,233.13 would be required for confidence in this wave count.
The biggest picture, Grand Super Cycle analysis, is here.
Last monthly charts are here. Video is here.
ELLIOTT WAVE COUNTS
MAIN WEEKLY CHART
Click chart to enlarge.
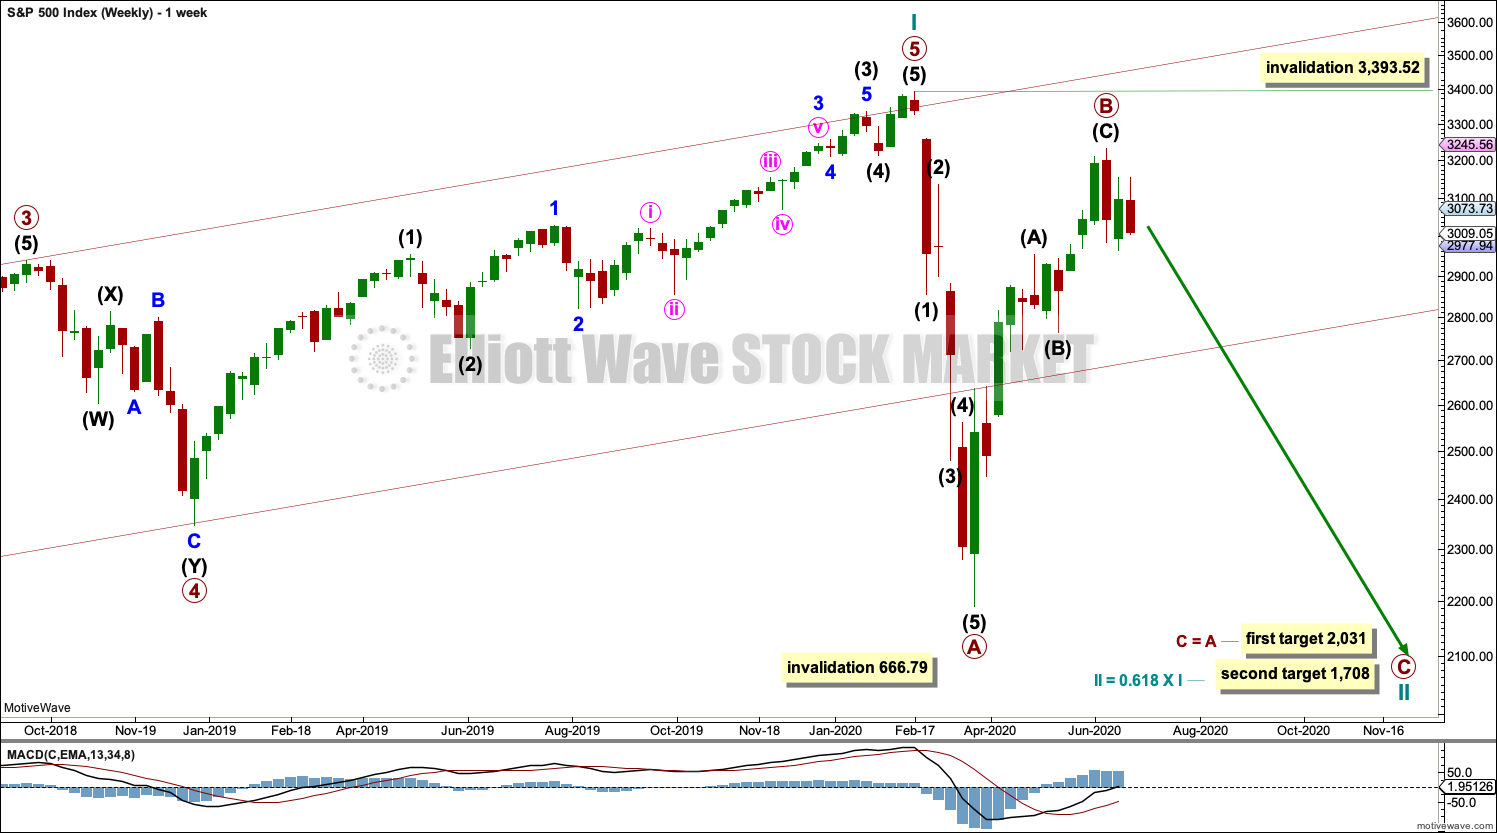
This main Elliott wave count expects that the bull market beginning in March 2009 was cycle wave I of Super Cycle wave (V). The trend change in February 2020 may have been only at cycle degree. Cycle wave II may last from one to a few years.
Cycle wave II would most likely subdivide as a zigzag; thus far that looks like what is unfolding. Primary waves A and B may both be complete. A second target is calculated at primary degree.
Cycle wave II may not move beyond the start of cycle wave I below 666.79.
MAIN DAILY CHART
Click chart to enlarge.
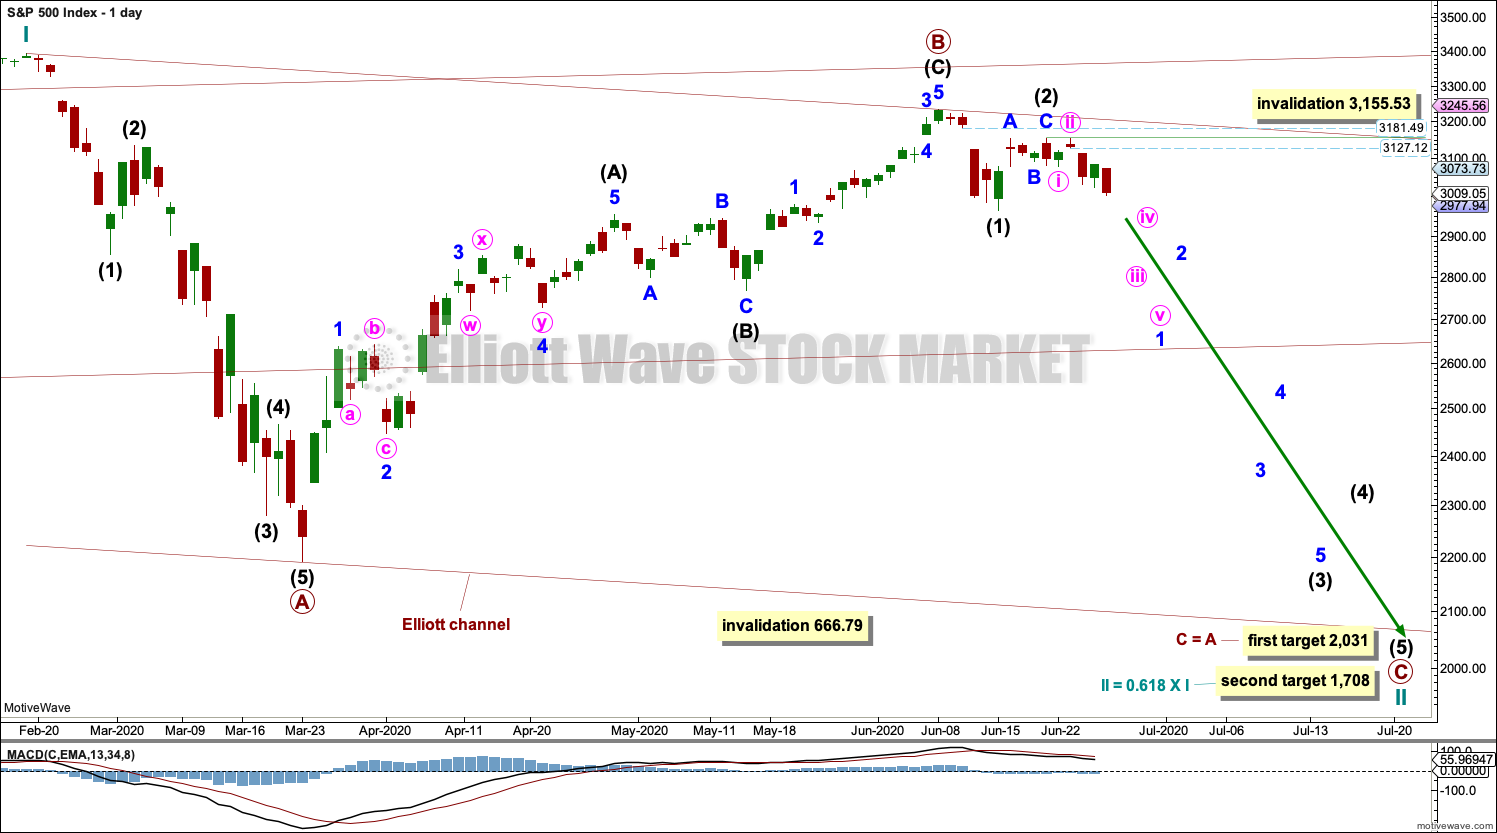
Draw the wide maroon trend channel carefully: draw the first trend line from the end of primary wave 1 at 2,093.55 (December 26, 2014), to the end of primary wave 3 at 2,940.91 (September 21, 2018), then place a parallel copy on the end of primary wave 2 at 1,810.10 (February 11, 2016). The channel was fully breached in March 2020 indicating a trend change from the multi-year bull trend to a new bear trend. Resistance at the lower edge has been overcome; price has closed above this trend line. During the next downwards wave this line may offer some support.
Cycle wave II may subdivide as any Elliott wave corrective structure except a triangle. It would most likely be a zigzag (zigzags subdivide 5-3-5). It may now be complete.
Draw a channel about cycle wave II using Elliott’s technique for a correction. Draw the first trend line from the start of primary wave A to the end of primary wave B, then place a parallel copy on the end of primary wave A. Primary wave C may find support about the lower edge of this channel.
Intermediate waves (1) and (2) within primary wave C may now be complete. Intermediate wave (3) downwards may have begun. Minor wave 2 within intermediate wave (3) may not move beyond the start of minor wave 1 above 3,155.53.
Two targets are calculated now for primary wave C. If price approaches the first target and either the structure of primary wave C is incomplete or price keeps falling, then attention would turn to the second target.
The last two gaps which may provide resistance are noted on this chart. At this time, the lower price point at 3,127.12 may now provide resistance.
FIRST ALTERNATE DAILY CHART
Click chart to enlarge.
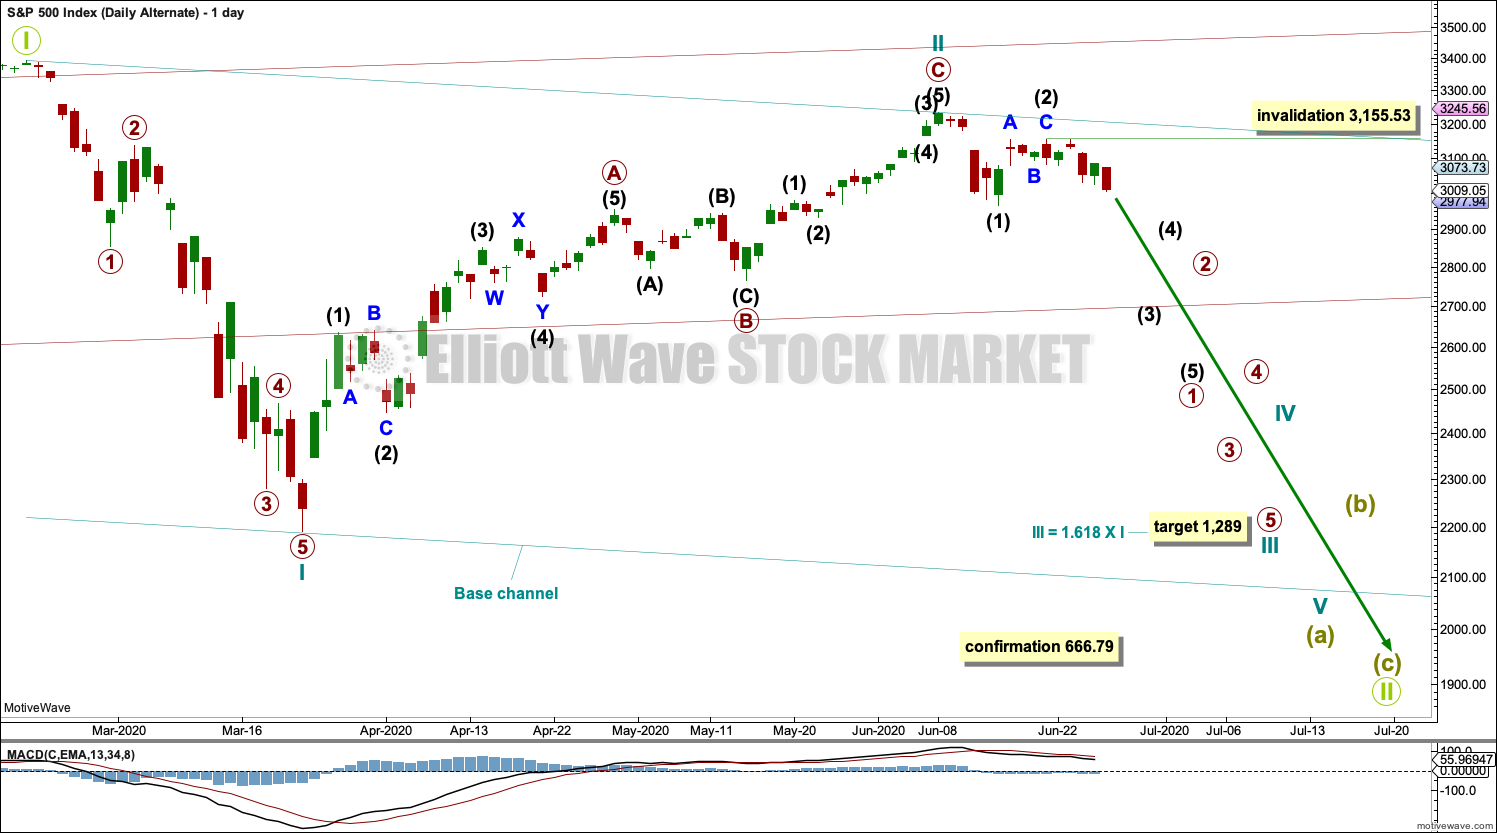
This alternate daily chart follows the First Alternate Monthly chart.
By simply moving the degree of labelling in the bull market beginning March 2009 up one degree, it is possible that a Grand Super Cycle trend change occurred on February 19, 2020. The bull market from March 2009 to February 2020 may have been a complete fifth wave labelled Super Cycle wave (V).
A bear market at Grand Super Cycle degree may be expected to last at least a decade, possibly longer. Corrections for this market tend to be much quicker than bullish moves, and so a fair amount of flexibility is required in expectations for duration of the different degrees.
Grand Super Cycle II would most likely subdivide as a zigzag, although it may be any corrective structure except a triangle. It should begin with a five down at the weekly chart time frame, which would be incomplete.
The first wave down on the daily chart is labelled cycle wave I. If this degree of labelling is wrong, it may be too high; it may need to be moved down one degree.
Following cycle wave I, cycle wave II may be a complete zigzag. A target for cycle wave III is now calculated.
No second wave correction within intermediate wave (3) may move beyond its start above 3,155.53.
THIRD ALTERNATE DAILY CHART
Click chart to enlarge.
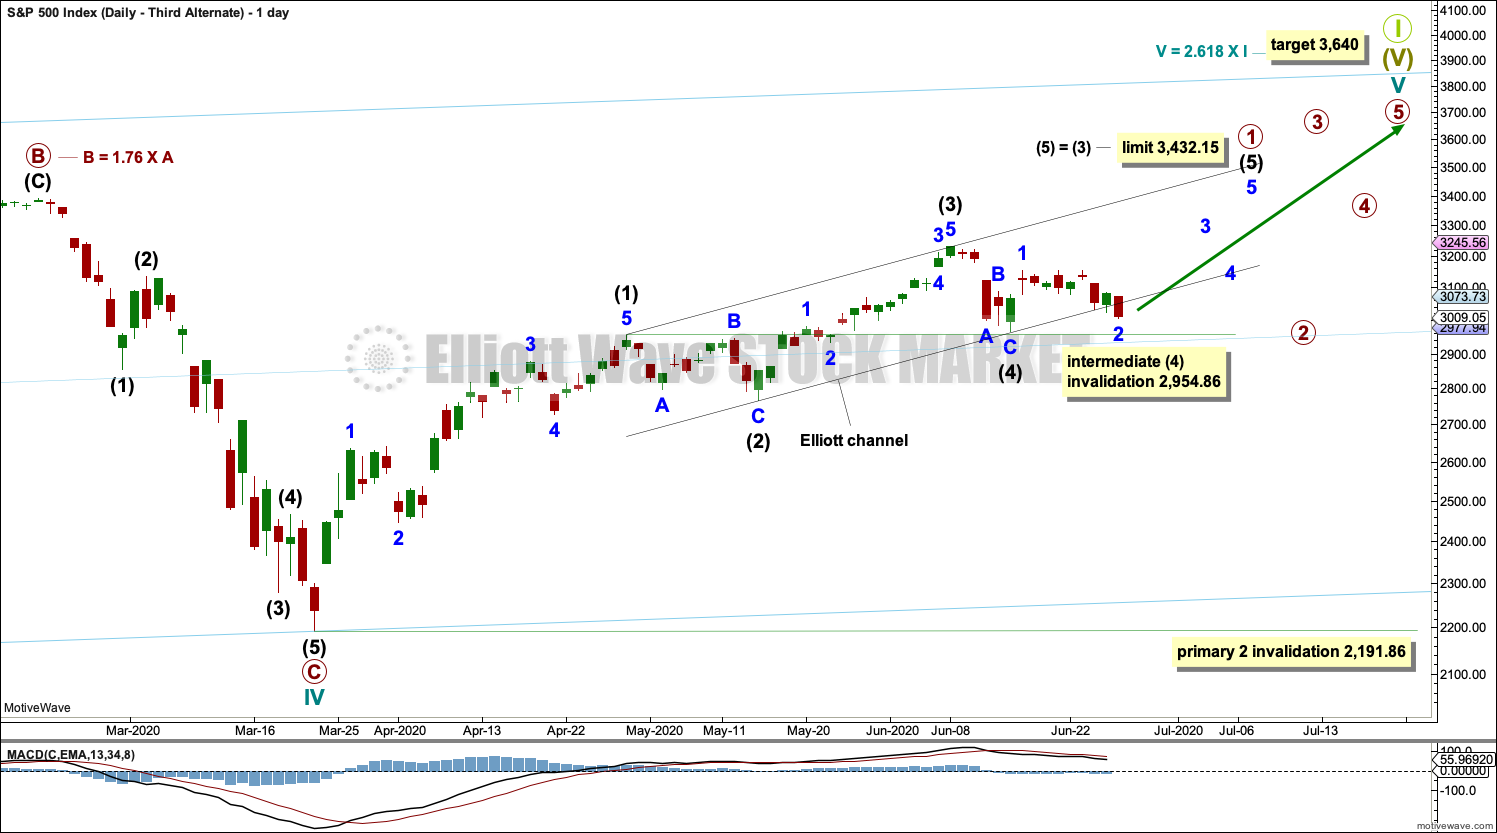
This alternate daily chart follows the third alternate monthly chart. It will be published daily because the structure of the current upwards wave is different and so the invalidation point is different. This alternate chart labels the subdivisions of the long bull market differently. The channel is a best fit.
The target for the end of this bull market is provisional. It would best be calculated at primary degree, but that cannot be done until all of primary waves 1 through to 4 are complete. At that stage, the target will be recalculated and will very likely change.
Cycle wave V must subdivide as a five wave motive structure, most likely an impulse. Primary wave 1 within cycle wave V may be nearing completion.
Within primary wave 1: intermediate waves (1) through to (3) may be complete and intermediate wave (4) may not move into intermediate wave (1) price territory below 2,954.86.
Use Elliott’s first technique to draw a channel about primary wave 1. Draw the first trend line from the ends of intermediate waves (1) to (3), then place a parallel copy on the end of intermediate wave (2). Intermediate wave (4) remains within the channel and may have found support about the lower edge.
When primary wave 1 may be a complete five wave structure, then primary wave 2 should then unfold as a multi-week pullback and may not move beyond the start of primary wave 1 below 2,191.86.
In the short term, invalidation of this wave count by a new low below 2,954.86 would add confidence to the first two wave counts.
This alternate wave count is bullish.
Cycle wave V may last from one to several years.
TECHNICAL ANALYSIS
WEEKLY CHART
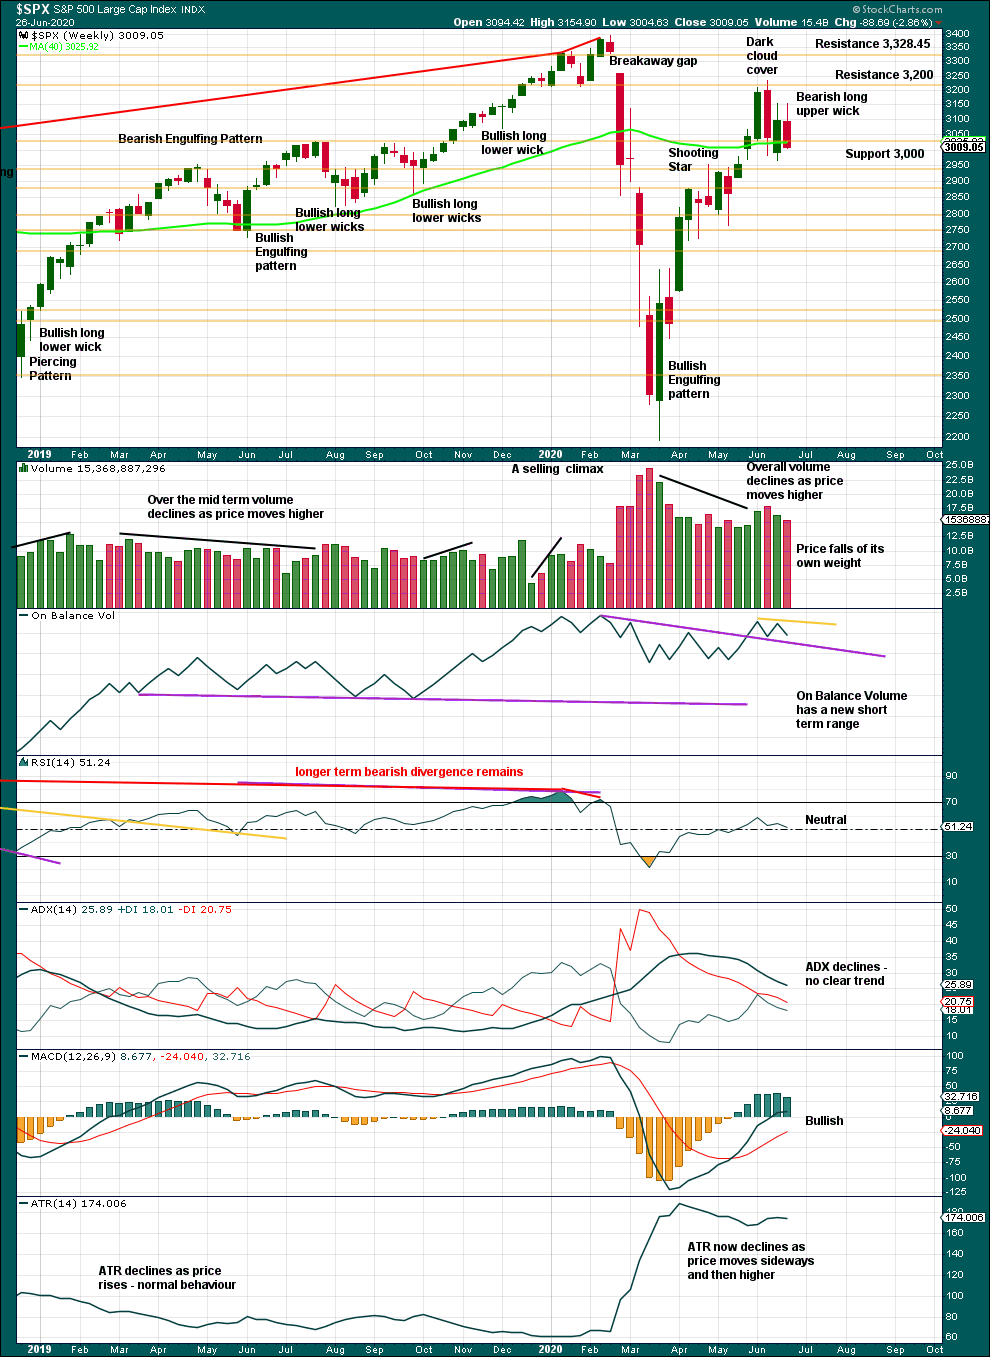
Click chart to enlarge. Chart courtesy of StockCharts.com.
The long upper wick and close near lows for this last week suggest more downwards movement immediately ahead.
DAILY CHART
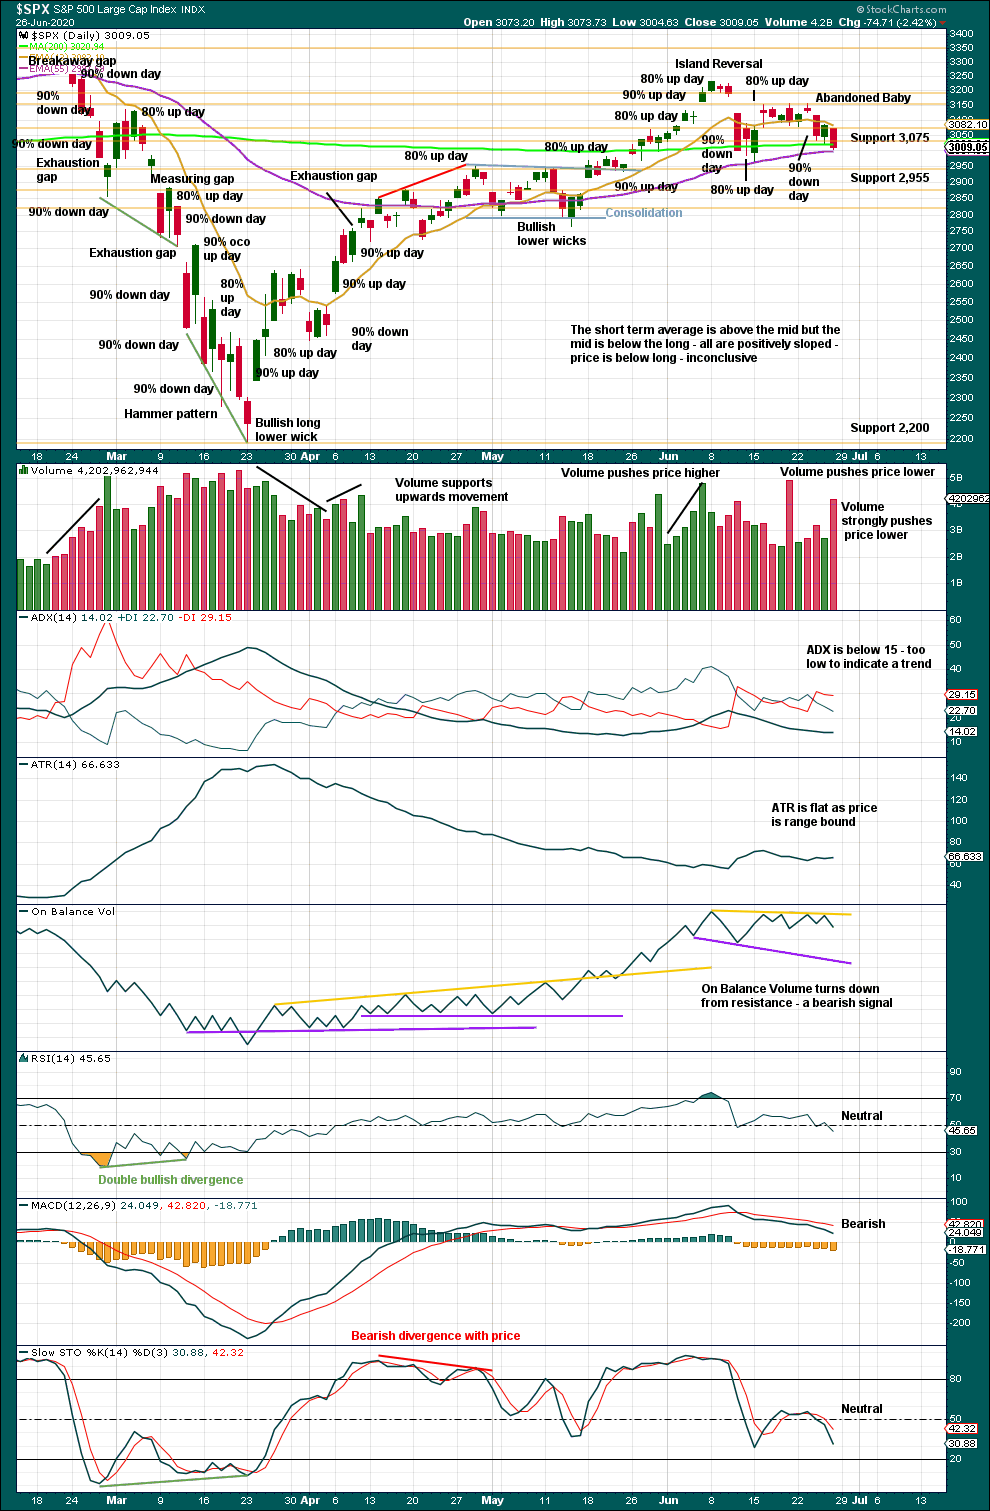
Click chart to enlarge. Chart courtesy of StockCharts.com.
The breakaway gap of 24th February has its upper edge at 3,328.45. A bearish analysis remains reasonable while this gap remains open. If this gap is closed, then a more bullish analysis that would expect new all time highs would increase in probability.
Towards the high of 8th of June were a 90% and an 80% up day. Those have now been followed by a very strong 90% down day (98.4% of volume was down and 99.6% of points were down) within three sessions. This represents a 180° reversal in sentiment from bullish to bearish, supporting the view of a sustainable high in place.
The island reversal is comprised of an exhaustion gap created on June 5th and now a possible breakaway gap created on June 11th.
Now another candlestick reversal pattern is complete almost at the same high. An Abandoned Baby pattern is formed when the 24th of June gaped down upon the open; this is a very rare pattern. The gap may offer resistance at 3,127.12.
Wednesday’s session was a 90% down day.
Now Friday completes a downwards day that closes near lows for the session on very heavy volume. Mid caps saw particularly heavy volume during this session. This suggests more downwards movement immediately ahead.
Data from Lowry’s for % of up / down volume and points gained / lost will not be available until Monday, so the internal strength of this last session is unknown.
BREADTH – AD LINE
WEEKLY CHART
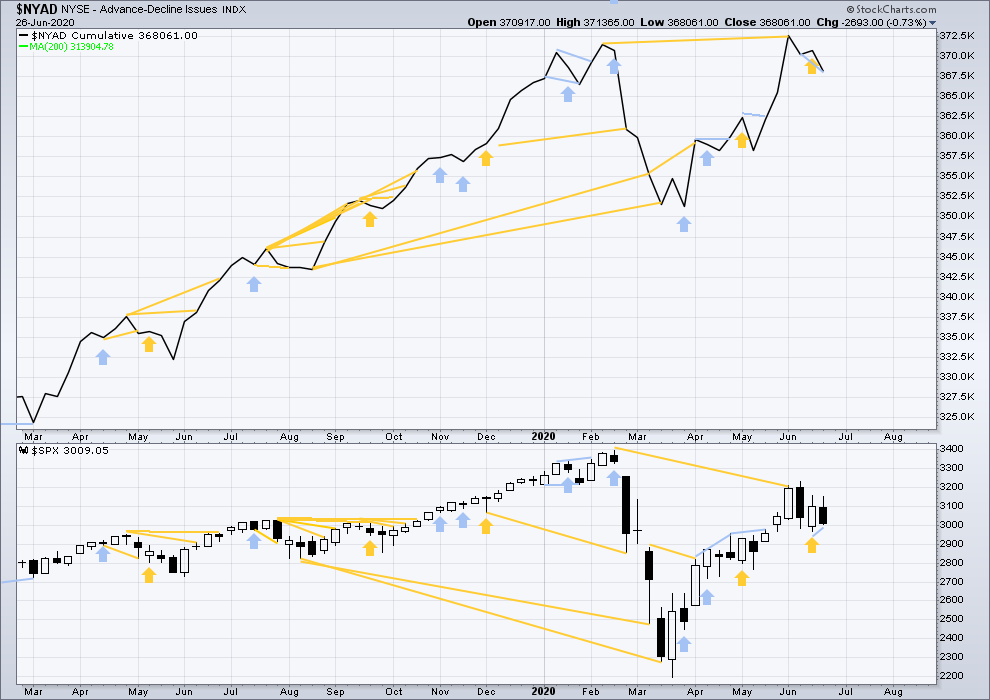
Click chart to enlarge. Chart courtesy of StockCharts.com. So that colour blind members are included, bearish signals will be noted with blue and bullish signals with yellow.
Breadth should be read as a leading indicator.
Bullish divergence noted four weeks ago remains.
This week the AD line has made a new short-term low, but price has not. This divergence is bearish.
Large caps all time high: 3,393.52 on 19th February 2020.
Mid caps all time high: 2,109.43 on 20th February 2020.
Small caps all time high: 1,100.58 on 27th August 2018.
Of all large, mid and small caps, it is small caps that are furthest off their all time highs and large caps that are closest. This rise is led by large caps, which is normally a feature of an aged bull market and not a new bull market.
DAILY CHART
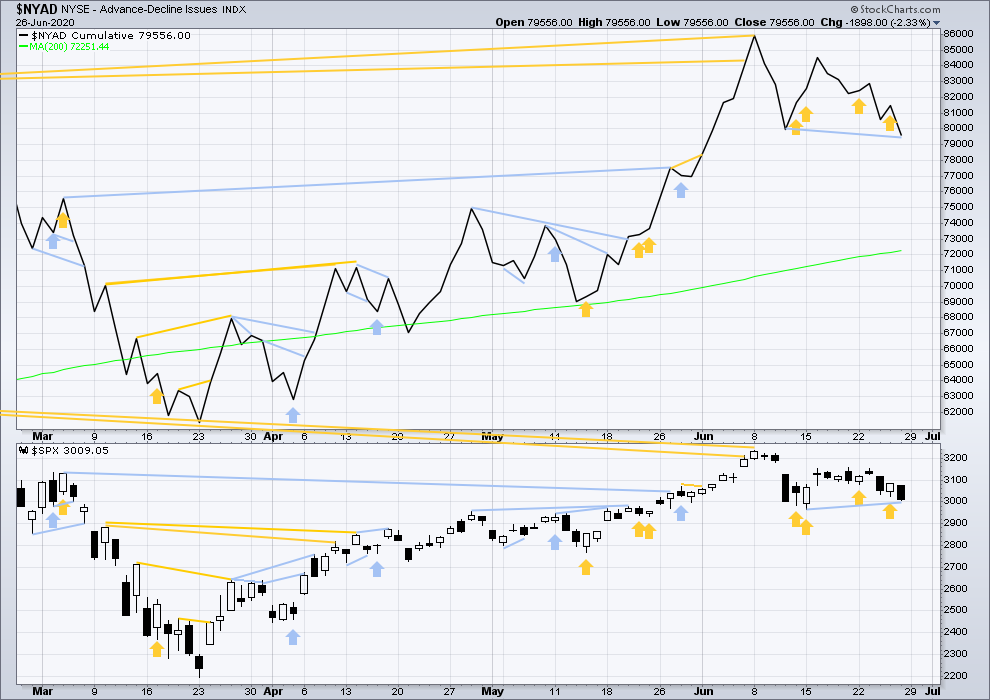
Click chart to enlarge. Chart courtesy of StockCharts.com. So that colour blind members are included, bearish signals will be noted with blue and bullish signals with yellow.
Although the NYSE AD line has made new all time highs on the 8th of June 2020, Lowry’s OCO AD line did not. Bullish divergence may still support a bullish wave count.
The AD line has made a new swing low, but price has not. This divergence is bearish.
VOLATILITY – INVERTED VIX CHART
WEEKLY CHART
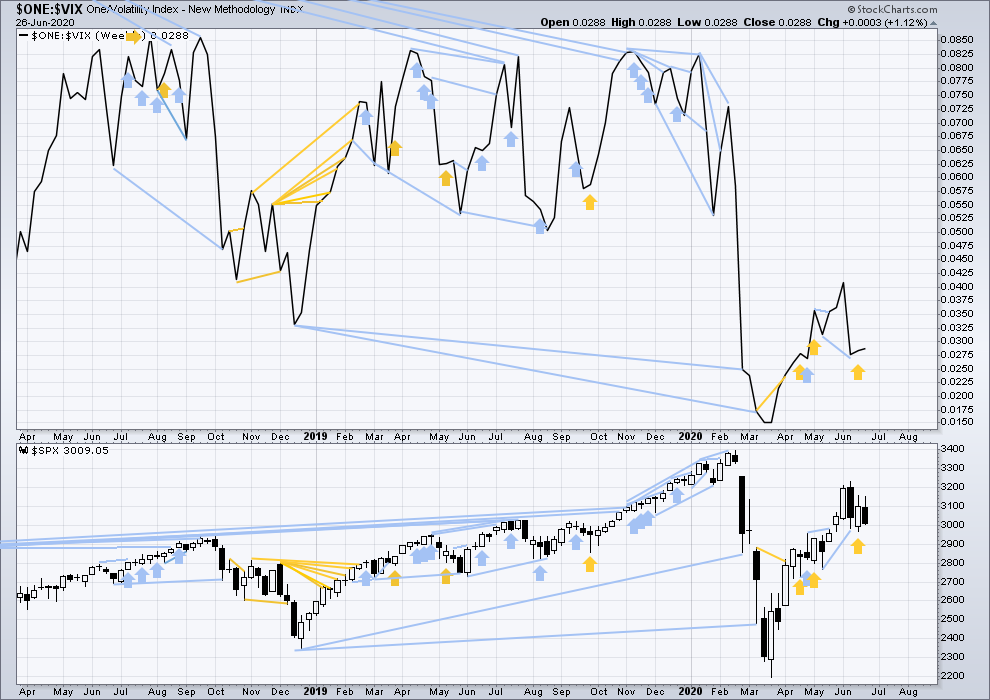
Click chart to enlarge. Chart courtesy of StockCharts.com. So that colour blind members are included, bearish signals will be noted with blue and bullish signals with yellow.
This week price has moved overall sideways with an inside week, and inverted VIX has moved slightly higher. Downwards movement within this week has not come with a normal corresponding increase in VIX as VIX has declined. There is some small bullish divergence.
However, inverted VIX remains well below all time highs. There remains over two years of strong bearish divergence between price and inverted VIX.
DAILY CHART
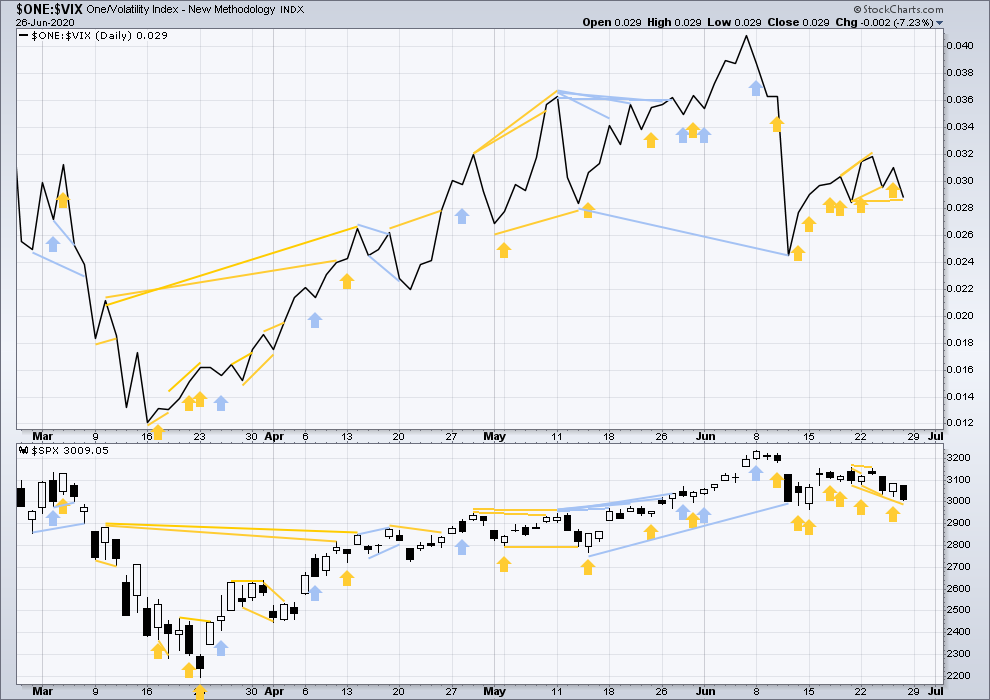
Click chart to enlarge. Chart courtesy of StockCharts.com. So that colour blind members are included, bearish signals will be noted with blue and bullish signals with yellow.
VIX has made a new swing low below the prior swing low of March 13th / 14th, but price has not. This divergence is bearish and supports either the main or first alternate Elliott wave counts.
For the short term, price has made a new low below the low of June 19th, but inverted VIX has not. This divergence is bullish for the short term.
DOW THEORY
Dow Theory has confirmed a bear market with the following lows made on a closing basis:
DJIA: 21,712.53 – a close below this point has been made on the March 12, 2020.
DJT: 8,636.79 – a close below this point has been made on March 9, 2020.
Adding in the S&P and Nasdaq for an extended Dow Theory, a bear market has now been confirmed:
S&P500: 2,346.58 – a close below this point has now been made on March 20, 2020.
Nasdaq: 7,292.22 – a close below this point was made on the March 12, 2020.
At this time, to shift Dow Theory from viewing a bear market to confirmation of a new bull market would require new highs made on a closing basis:
DJIA – 29,568.57
DJT – 11,623.58
Adding in the S&P and Nasdaq for an extended Dow Theory:
S&P500 – 3,393.52
Nasdaq – 9,838.37 – closed above on June 8, 2020.
GOLD
A correction found support exactly at the lower edge of a short-term trend channel. This week three Elliott wave counts are considered.
Summary: The next target is at 1,820. The final target is at 1,980.
However, Stockcharts data has still not confirmed an upwards breakout as price has not closed above resistance. On Balance Volume gave a bearish signal three days ago. If targets are wrong, then they may be too optimistic. An alternate wave count has a target at 1,791 for a major trend change.
Grand SuperCycle analysis is here.
Monthly charts were last updated here.
MAIN BEARISH ELLIOTT WAVE COUNT
WEEKLY CHART
Click chart to enlarge.
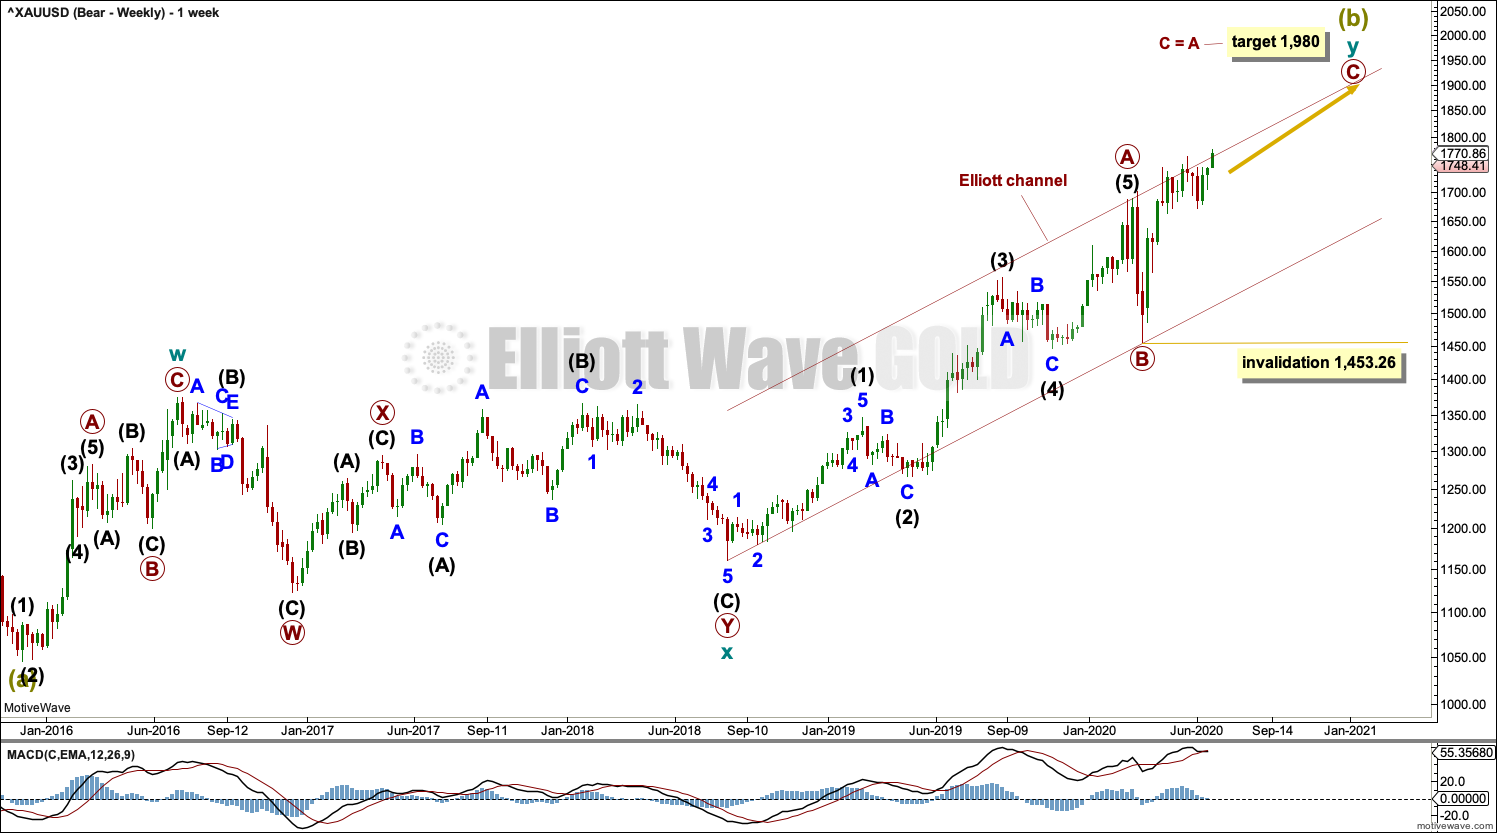
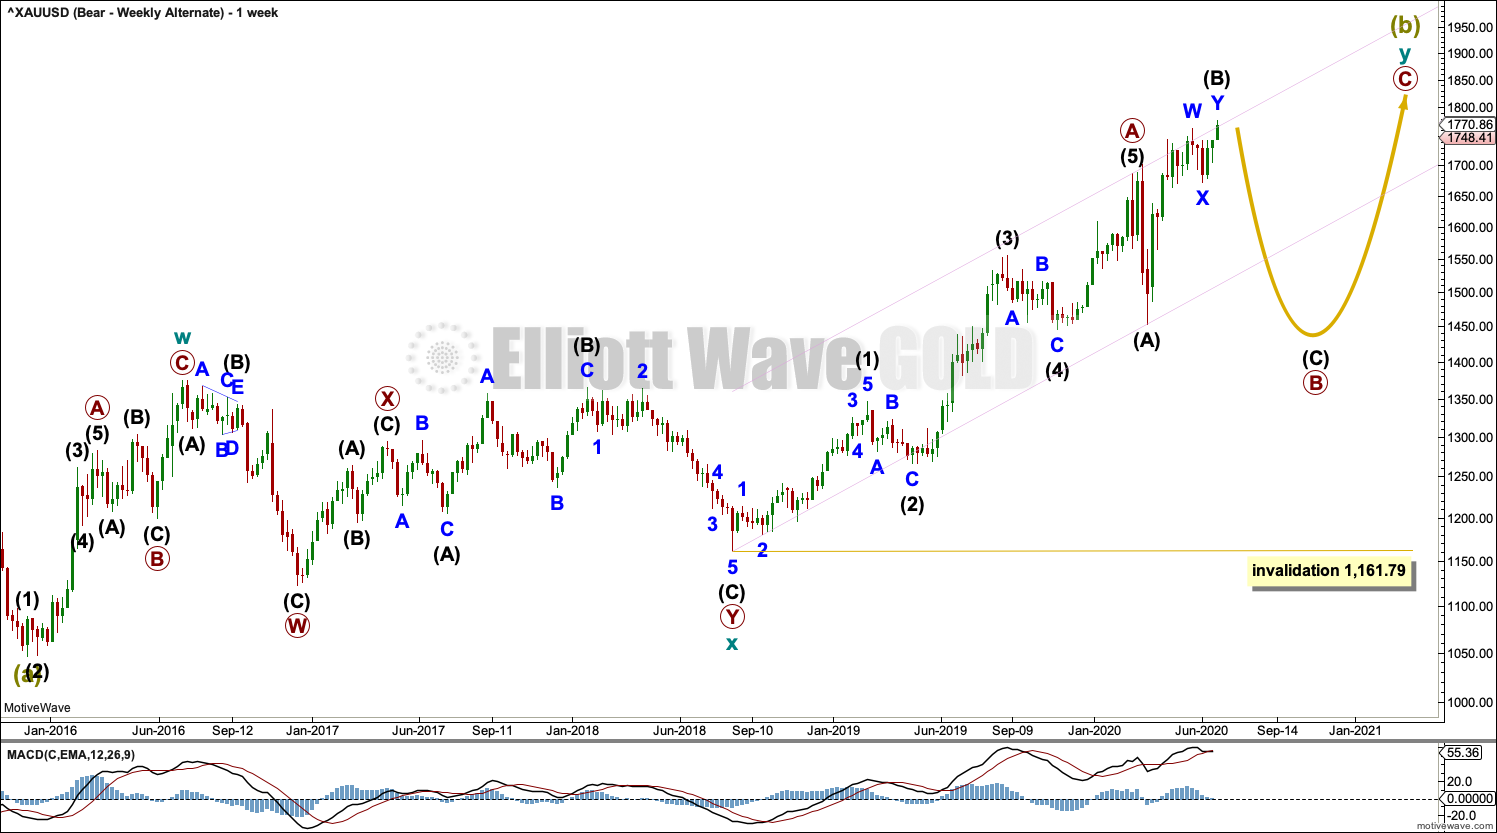
The bigger picture for this main bearish Elliott wave count sees Gold as still within a bear market, in a three steps back pattern that is labelled Grand Super Cycle wave IV on monthly charts.
Super Cycle wave (b) within Grand Super Cycle wave IV may be an incomplete double zigzag. When Super Cycle wave (b) may be complete, then this wave count expects Super Cycle wave (c) to begin and to move price below the end of Super Cycle wave (a) at 1,046.27.
The first zigzag in the double is labelled cycle wave w. The double is joined by a three in the opposite direction, a combination labelled cycle wave x. The second zigzag in the double is labelled cycle wave y.
The purpose of the second zigzag in a double is to deepen the correction. Cycle wave y has achieved this purpose.
We should always assume the trend remains the same until proven otherwise. At this stage, Gold is in a bull market
DAILY CHART
Click chart to enlarge.
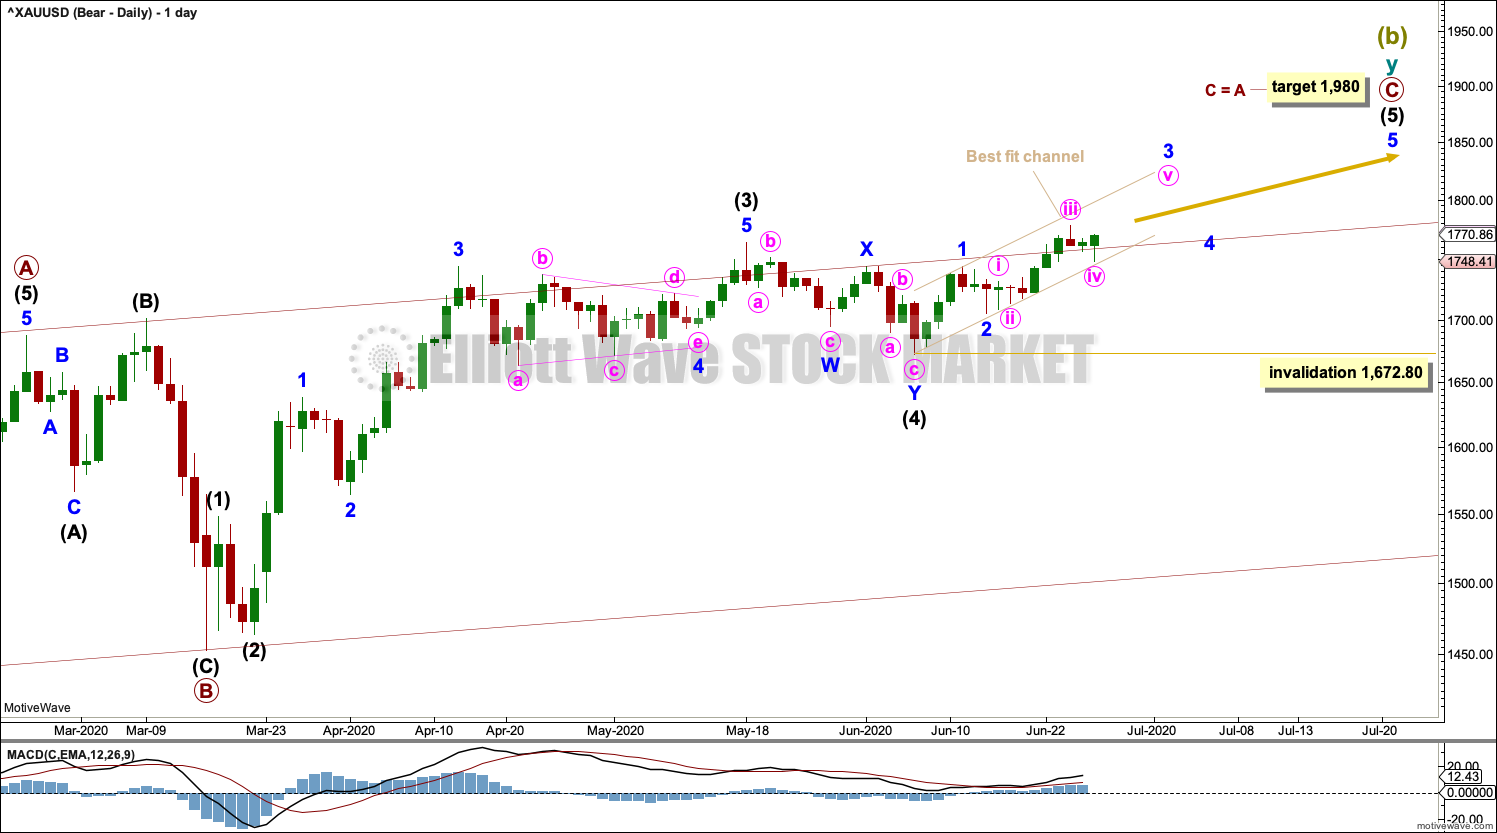
Primary wave C may be an incomplete five wave impulse.
Within the impulse: intermediate waves (1) through to (3) may be complete and intermediate wave (4) may have continued lower as a double zigzag. No second wave correction within intermediate wave (5) may move beyond its start below 1,672.80.
Draw a best fit channel about the start of intermediate wave (5) as shown. The lower edge of the channel may provide support for corrections along the way up.
ALTERNATE BEARISH ELLIOTT WAVE COUNT
WEEKLY CHART
Click chart to enlarge.
This idea was emailed to me by a member. Thank you Ant.
This wave count has support from classic technical analysis.
It is possible that primary wave B is an incomplete expanded flat correction.
The only problem with this wave count is the size in terms of both duration and price travelled for primary wave B. It looks much larger than cycle wave w, but cycle wave y is already much longer than cycle wave w, so this may be acceptable.
If primary wave A is correctly labelled as a five wave structure, then primary wave B may not move beyond its start below 1,161.79.
DAILY CHART
Click chart to enlarge.
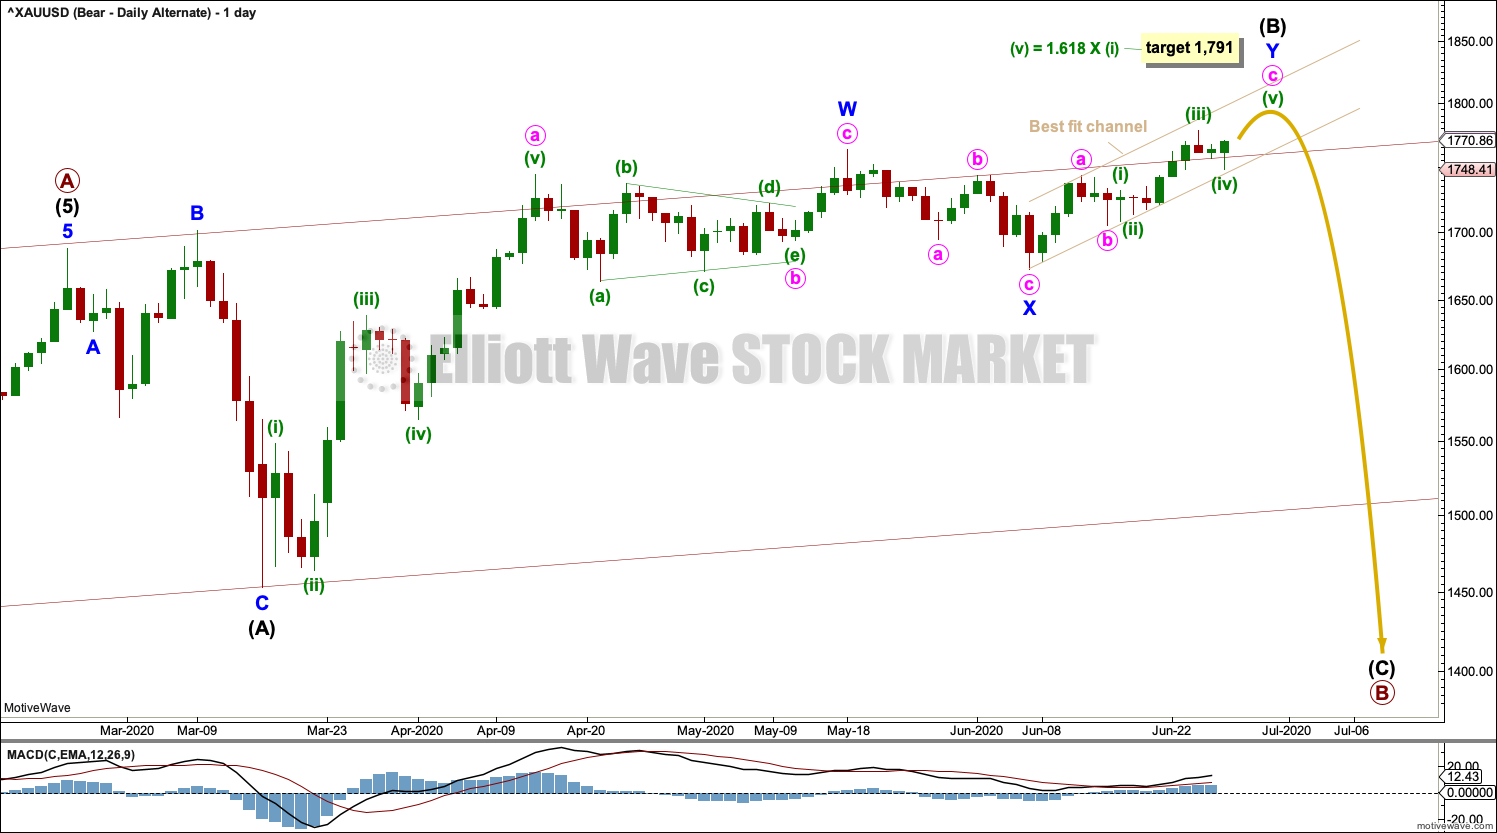
Primary wave B may be continuing as an expanded flat correction. The most common range for intermediate wave (B) within an expanded flat is from 1 to 1.38 times the length of intermediate wave (A), giving a range from 1,687.92 to 1,795.98. The target calculated would see intermediate wave (B) end within this range.
When intermediate wave (B) may be a complete structure, then a trend change would be expected. Intermediate wave (C) downwards would be extremely likely to make at least a slight new low below the end of intermediate wave (A) at 1,453.26 to avoid a truncation and a very rare running flat.
When intermediate wave (B) may be complete and the start of intermediate wave (C) may be known, then a target may be calculated for intermediate wave (C) to end. That cannot be done yet.
This alternate wave count sees an expanded flat unfolding for primary wave B, in mostly the same way as the alternate bullish wave count below sees an expanded flat unfolding for cycle wave IV. The subdivisions at lower time frames would be seen in the same way for the two wave counts.
ALTERNATE BULLISH ELLIOTT WAVE COUNT
WEEKLY CHART
Click chart to enlarge.
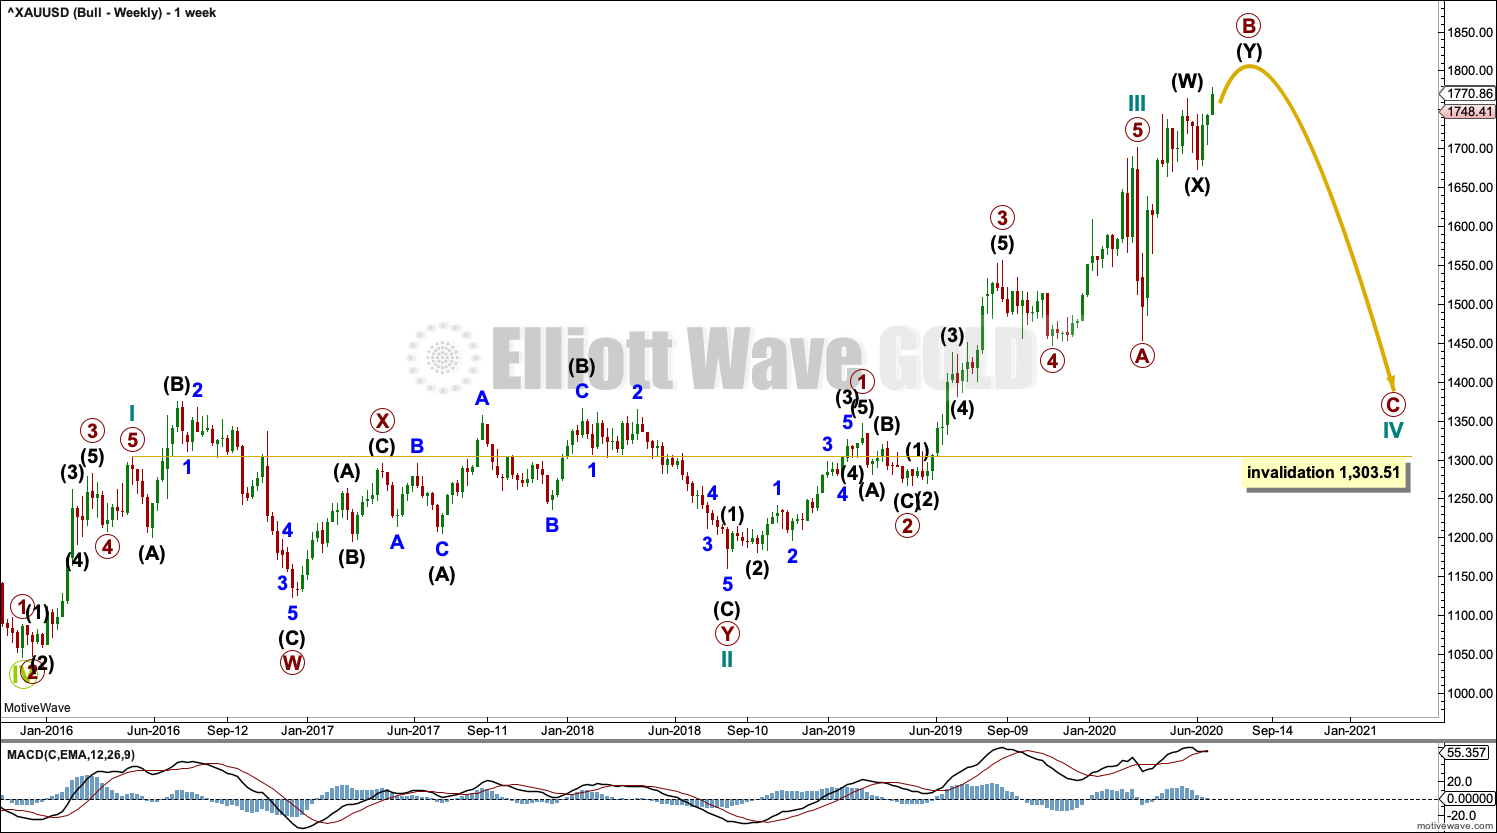
This wave count sees the the bear market complete at the last major low for Gold on 3 December 2015.
If Gold is in a new bull market, then it should begin with a five wave structure upwards on the weekly chart.
Cycle wave I fits as a five wave impulse with reasonably proportionate corrections for primary waves 2 and 4.
Cycle wave II fits as a double flat. However, within the first flat correction labelled primary wave W, this wave count needs to ignore what looks like an obvious triangle from July to September 2016 (this can be seen labelled as a triangle on the bear wave count above). This movement must be labelled as a series of overlapping first and second waves. Ignoring this triangle reduces the probability of this wave count in Elliott wave terms.
Within the first flat correction labelled primary wave W of the double flat of cycle wave II, intermediate wave (B) is 1.69 the length of intermediate wave (A). This is longer than the common range of up to 1.38, but within an allowable guideline of up to 2. The length of intermediate wave (B) reduces the probability of this wave count.
Cycle wave III may be complete. Cycle wave IV may not move into cycle wave I price territory below 1,303.51.
DAILY CHART
Click chart to enlarge.
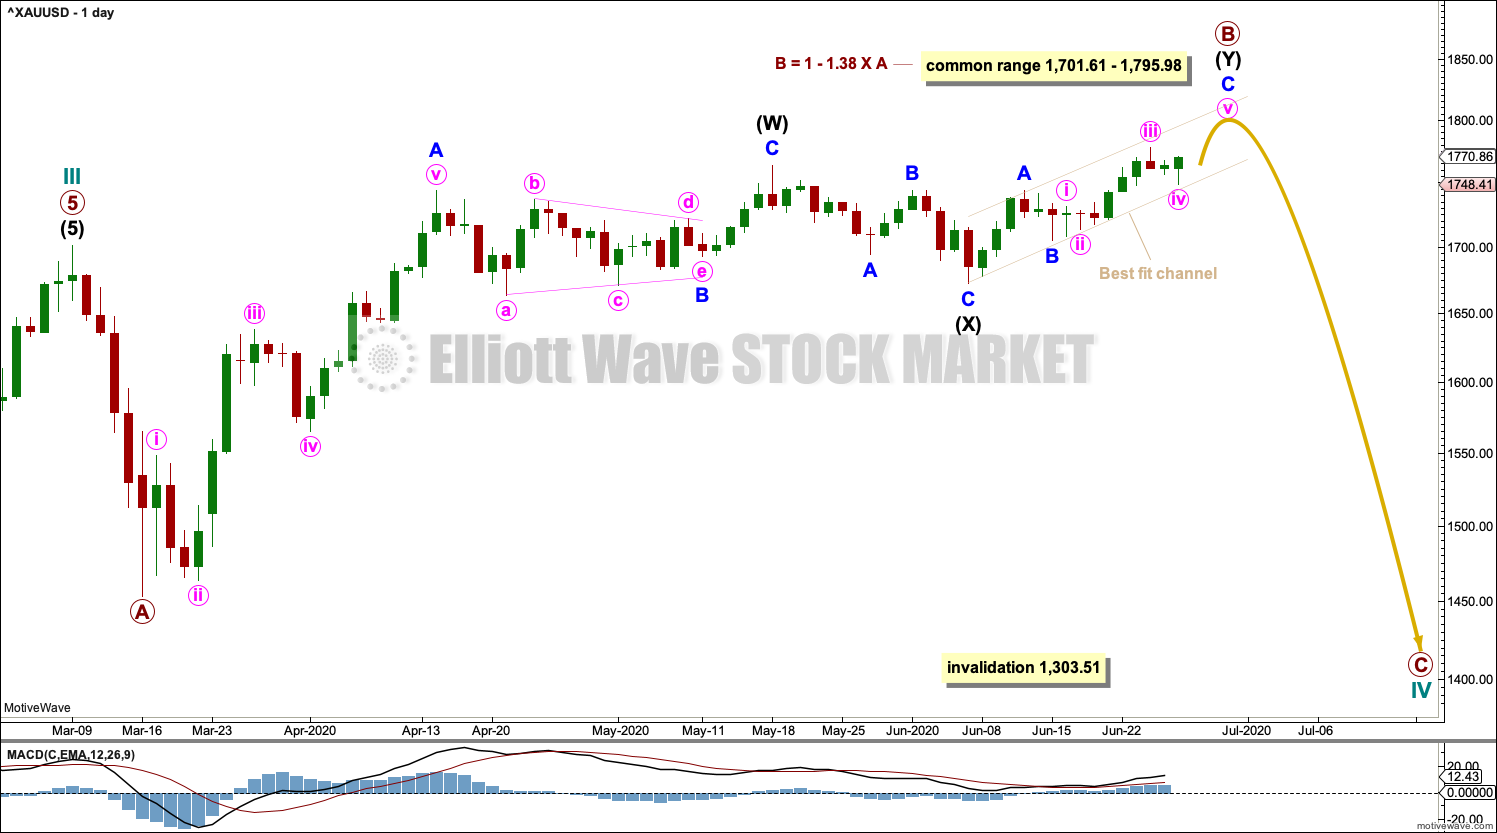
Cycle wave IV may be an incomplete expanded flat correction. Primary wave A within the flat correction may have subdivided as a zigzag. Primary wave B may be continuing higher as a double zigzag.
The common range of primary wave B would extend up to 1.38 times the length of primary wave A at 1,795.98. A maximum allowable guideline for primary wave B would be up to 2 times the length of primary wave A at 1,949.96. There is no Elliott wave rule stating a limit for B waves within expanded flat corrections, so there is no rule which may be used to determine an upper invalidation point for this wave count.
Draw a best fit channel about intermediate wave (Y). Assume upwards movement may continue while price remains within the channel. If the channel is breached, then assume intermediate wave (Y) may be over.
TECHNICAL ANALYSIS
WEEKLY CHART
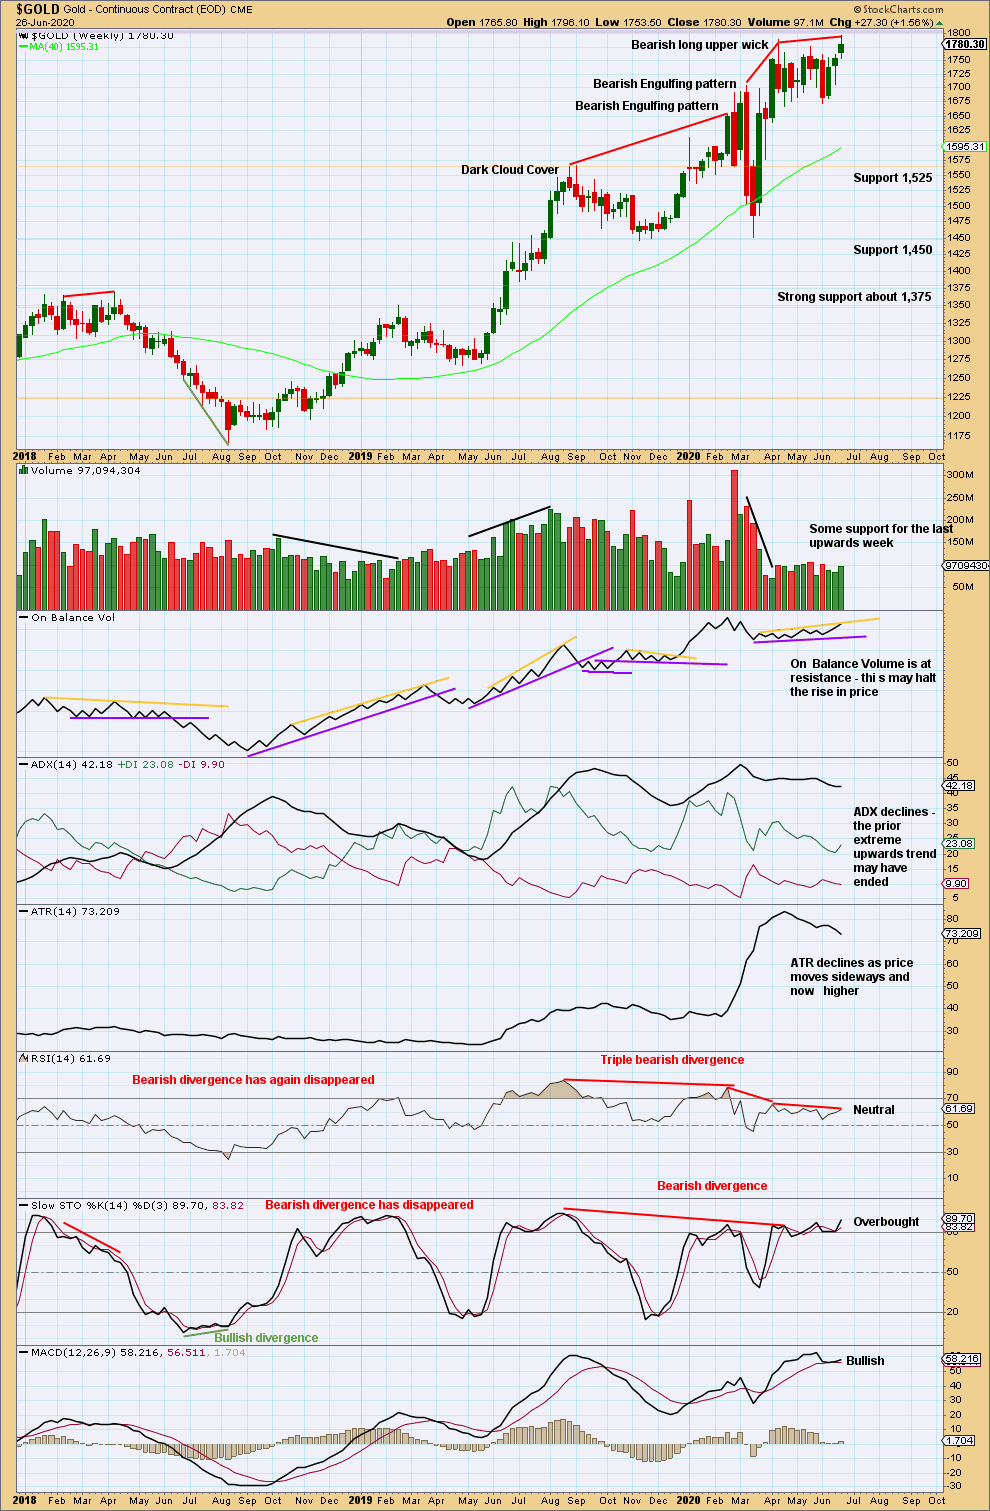
Click chart to enlarge. Chart courtesy of StockCharts.com.
Price remains within a consolidation with support about 1,665 to 1,680.
There is now strong triple bearish divergence between price and RSI. This supports either the alternate bearish Elliott wave count or the bullish Elliott wave count.
DAILY CHART
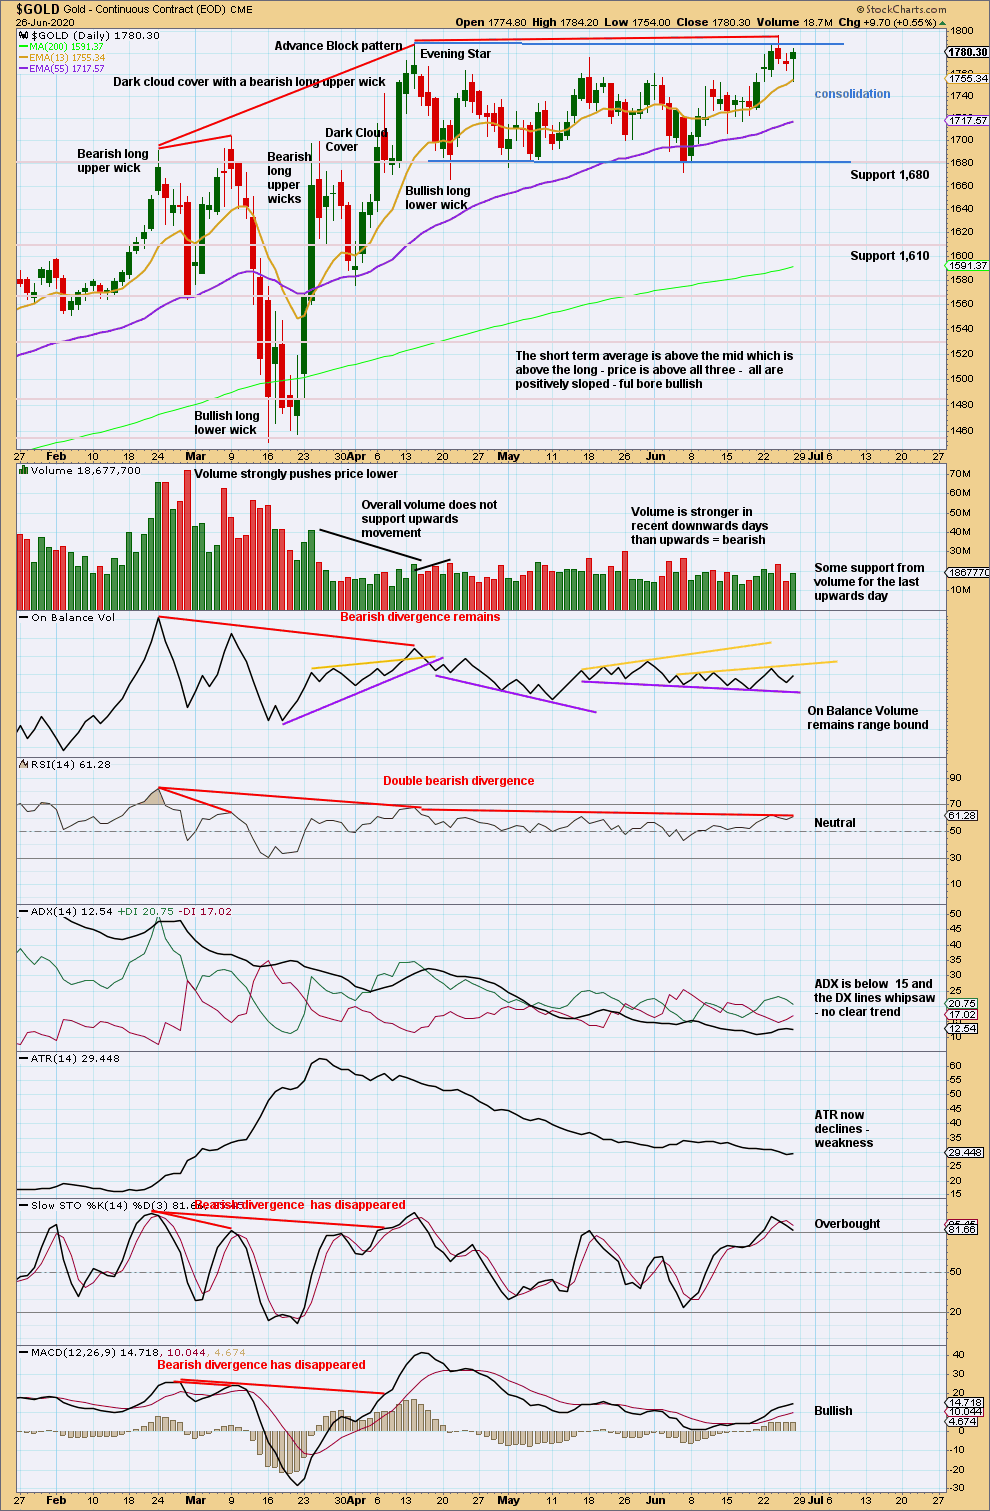
Click chart to enlarge. Chart courtesy of StockCharts.com.
Price remains range bound with support about 1,665 to 1,675 and resistance about 1,765 to 1,790. The short-term volume profile remains bearish, suggesting a downwards breakout may be more likely. Price has not closed above resistance. There is no upwards breakout.
An upwards breakout requires support from volume for confidence. Upwards breakouts lacking support from volume should be viewed with suspicion. An upwards breakout requires price to close above resistance at 1,788.80, which is the high of 14th of April.
It now would be reasonable that within this consolidation to expect an upwards swing has just ended and a downwards swing may now have just begun. This supports either the alternate bearish Elliott wave count or the bullish Elliott wave count.
GDX WEEKLY CHART
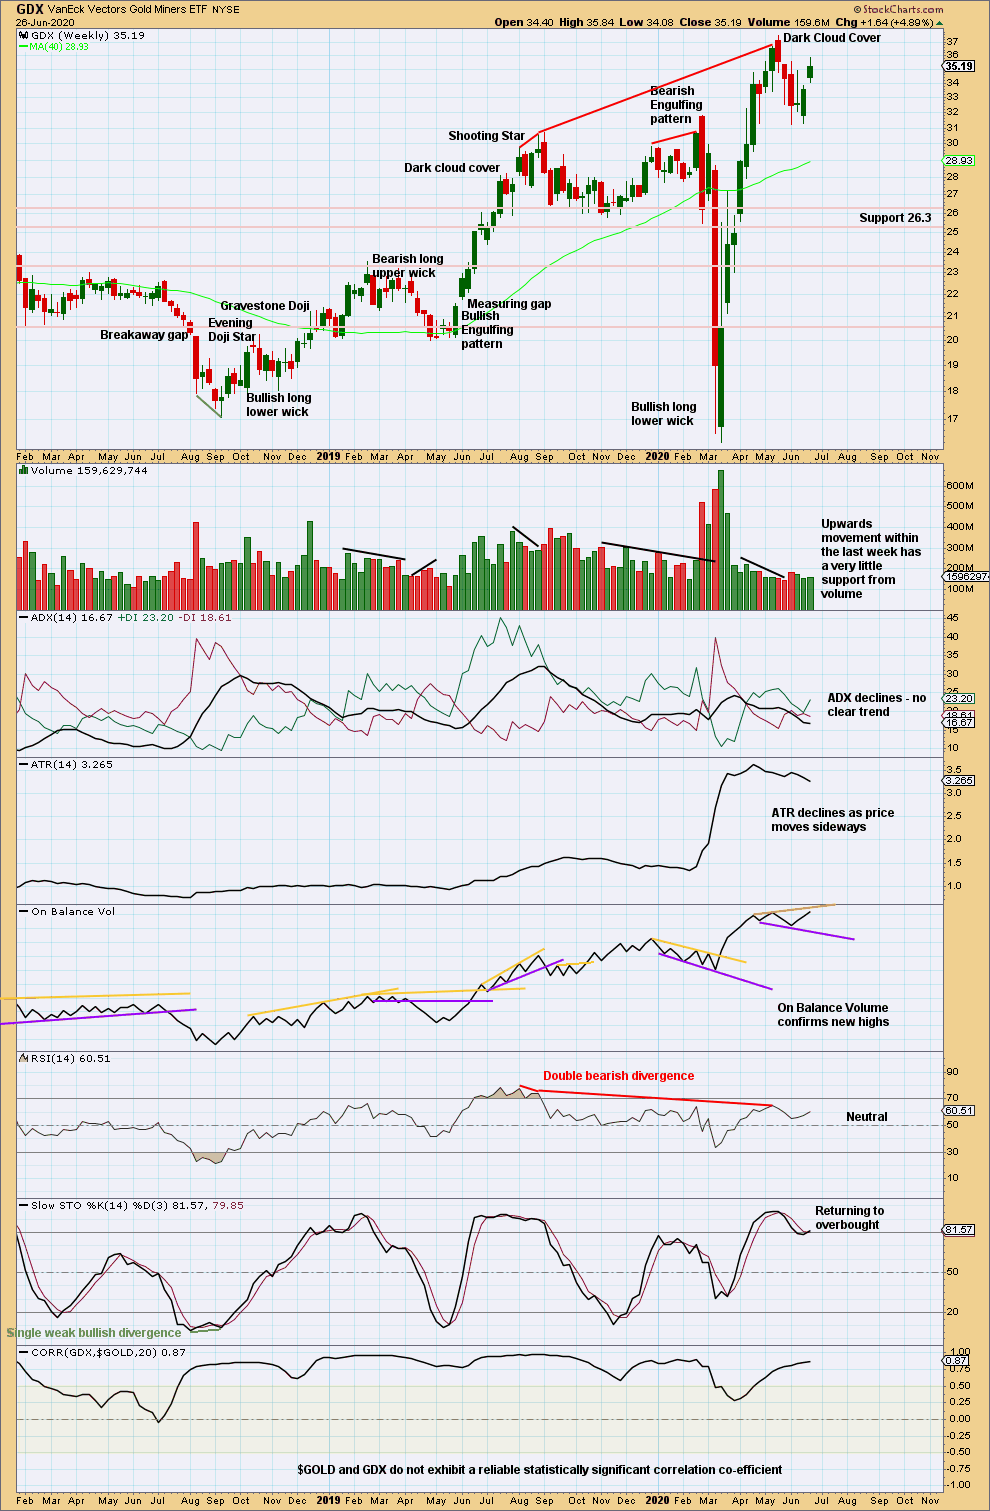
Click chart to enlarge. Chart courtesy of StockCharts.com.
Overall, range this week has decreased and volume remains light. Price is range bound.
GDX DAILY CHART
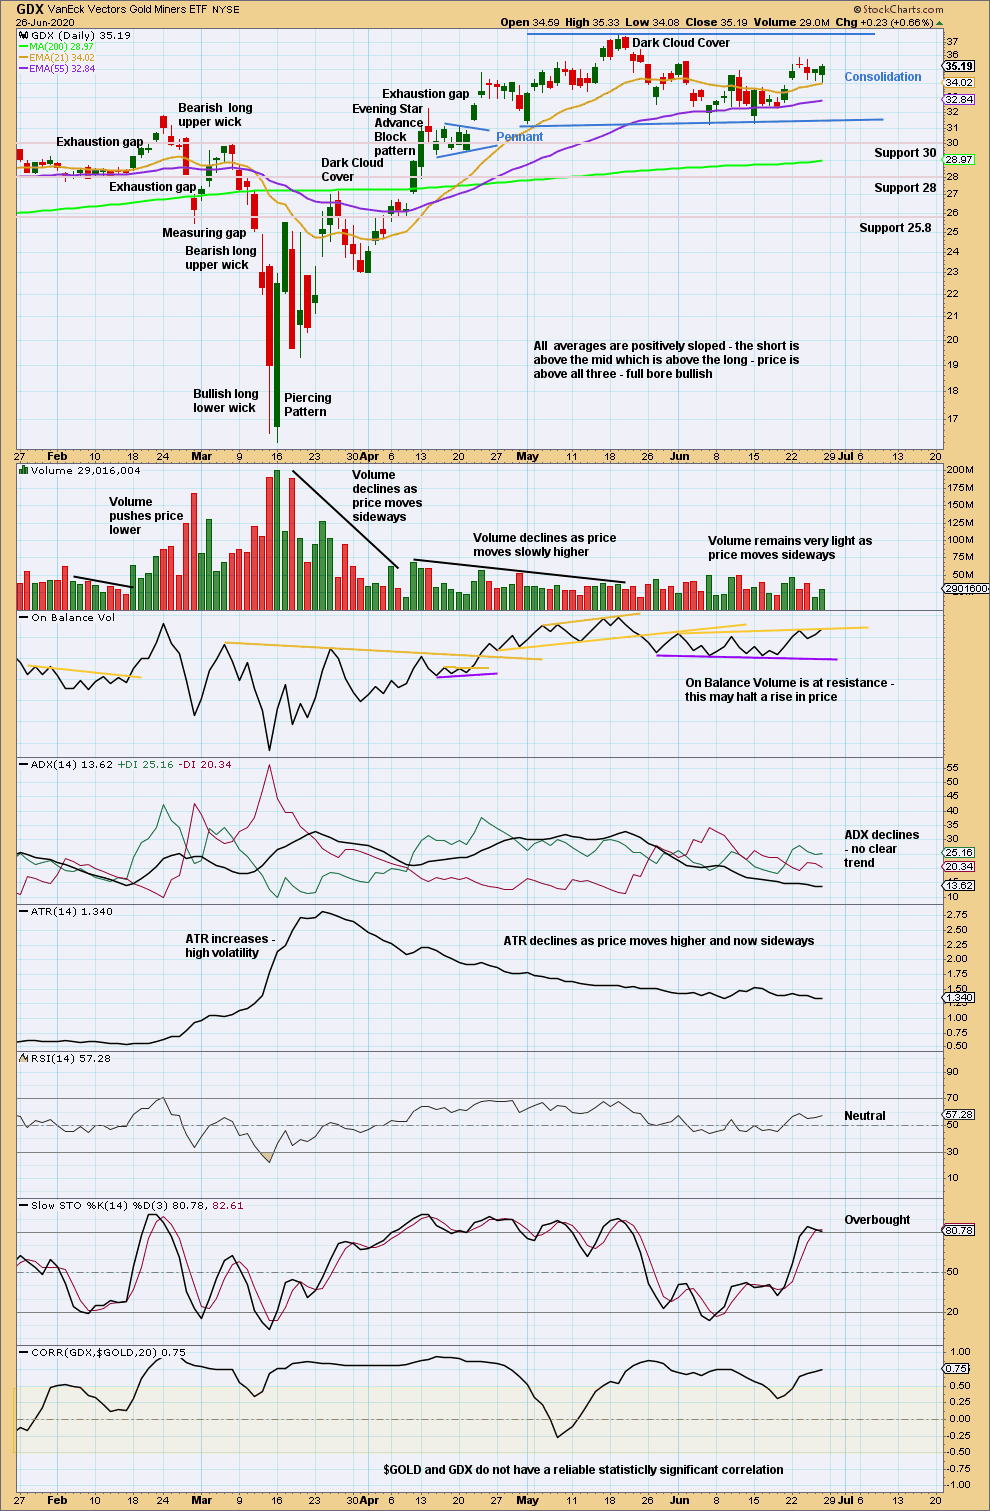
Click chart to enlarge. Chart courtesy of StockCharts.com.
Price is range bound with resistance about 35.55 to 37.50 and support about 31.20 to 31.30. A breakout of this range is required before having confidence in a trend. An upwards breakout should have support from volume for confidence. A downwards breakout does not require volume for support.
US OIL
Price is sitting just below resistance. Three daily charts are considered this week for three short-term possibilities.
Summary: Oil may have found a major sustainable low.
For the mid term, a multi-week pullback may end about 28.90 or 22.23. It is possible the pullback may be deeper than this though; the first major correction within a new trend for Oil tends to be very deep.
When this pullback may be complete, then an upwards trend should resume with increased strength.
ELLIOTT WAVE COUNT
MONTHLY CHART
Click chart to enlarge.
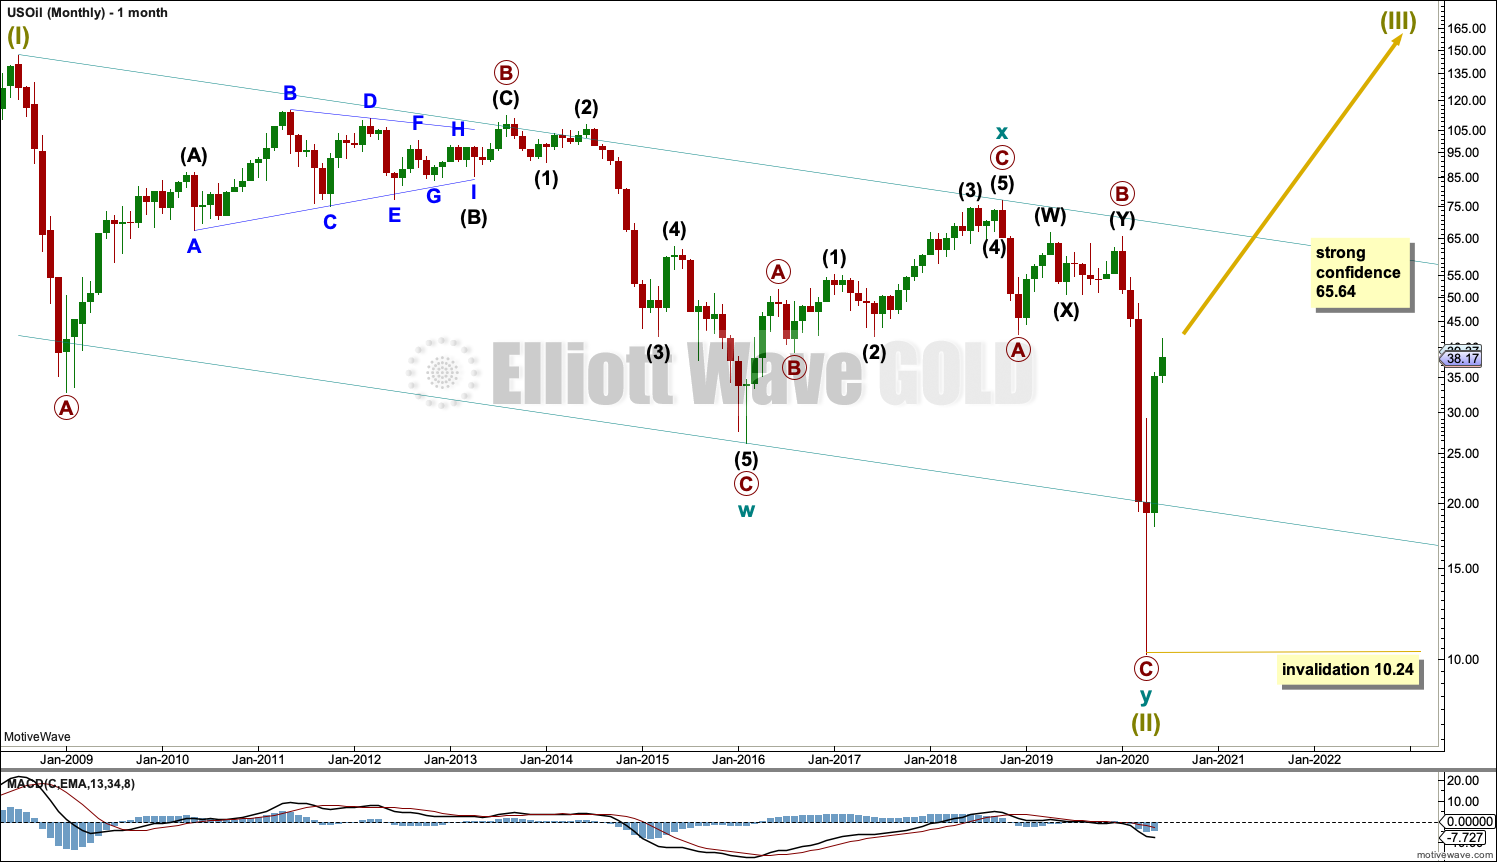
The basic Elliott wave structure is five steps forward and three steps back. This Elliott wave count expects that US Oil has completed a three steps back pattern, which began in July 2008. The Elliott wave count expects that the bear market for US Oil may now be over.
A channel is drawn about Super Cycle wave (II): draw the first trend line from the start of cycle wave w to the end of cycle wave x, then place a parallel copy on the end of cycle wave w. Price has bounced up off the channel. This trend line is breached, which is a typical look for the end of a movement for a commodity.
The upper edge of the channel may provide resistance.
Following five waves up and three steps back should be another five steps up; this is labelled Super Cycle wave (III), which may only have just begun. Super Cycle wave (III) may last a generation and must make a new high above the end of Super Cycle wave (I) at 146.73.
Super Cycle wave (III) may only subdivide as a five wave impulse. New trends for Oil usually start out very slowly with short first waves and deep time consuming second wave corrections. Basing action over a few years may now have begun.
WEEKLY CHART
Click chart to enlarge.
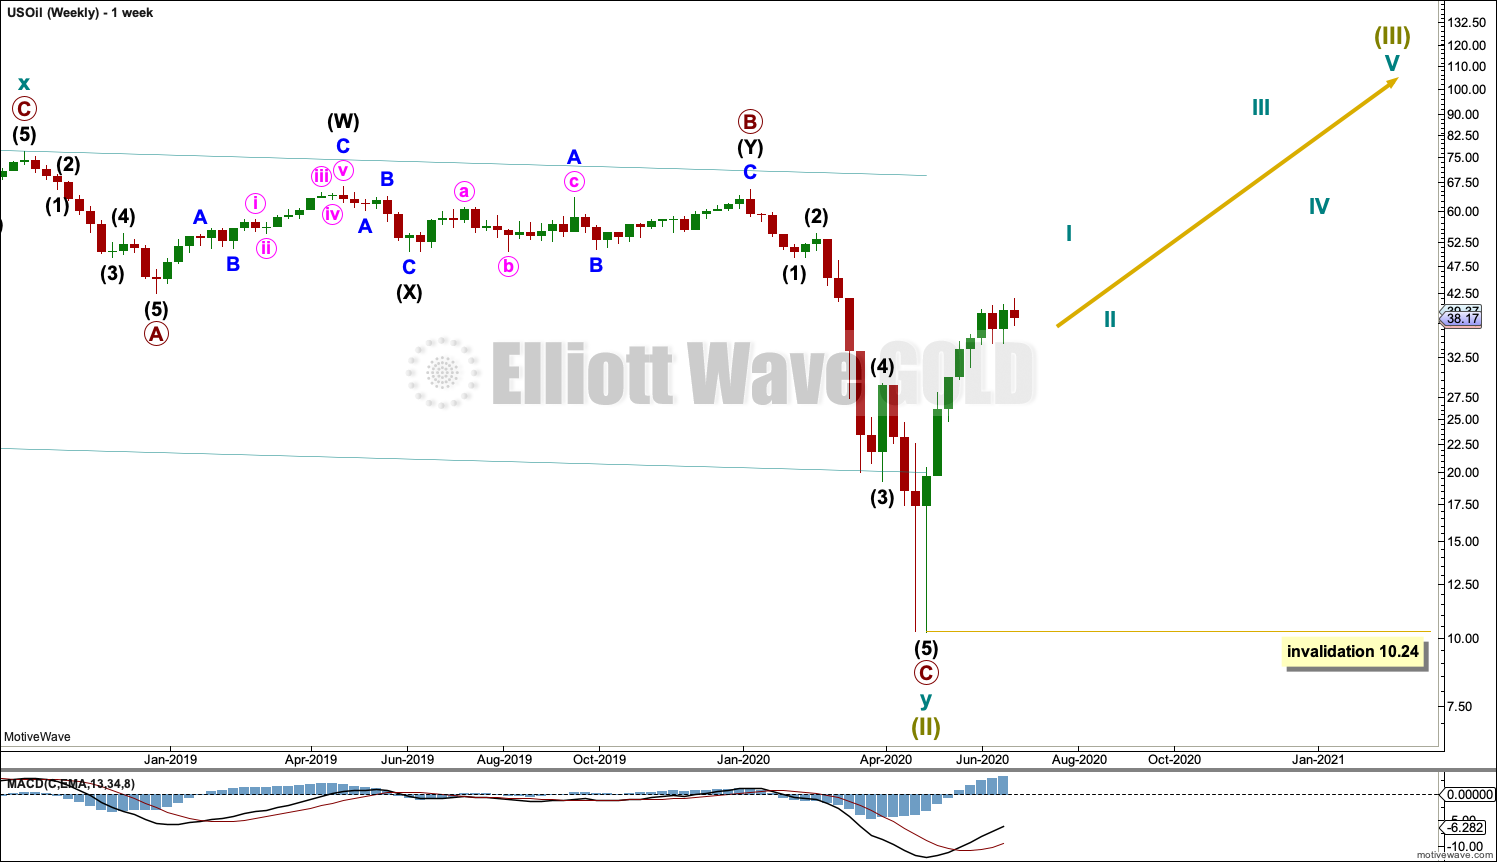
Super Cycle wave (III) must subdivide as an impulse. Cycle wave I within the impulse may now be unfolding higher. Cycle wave II may not move beyond the start of cycle wave I below 10.24.
DAILY CHART
Click chart to enlarge.
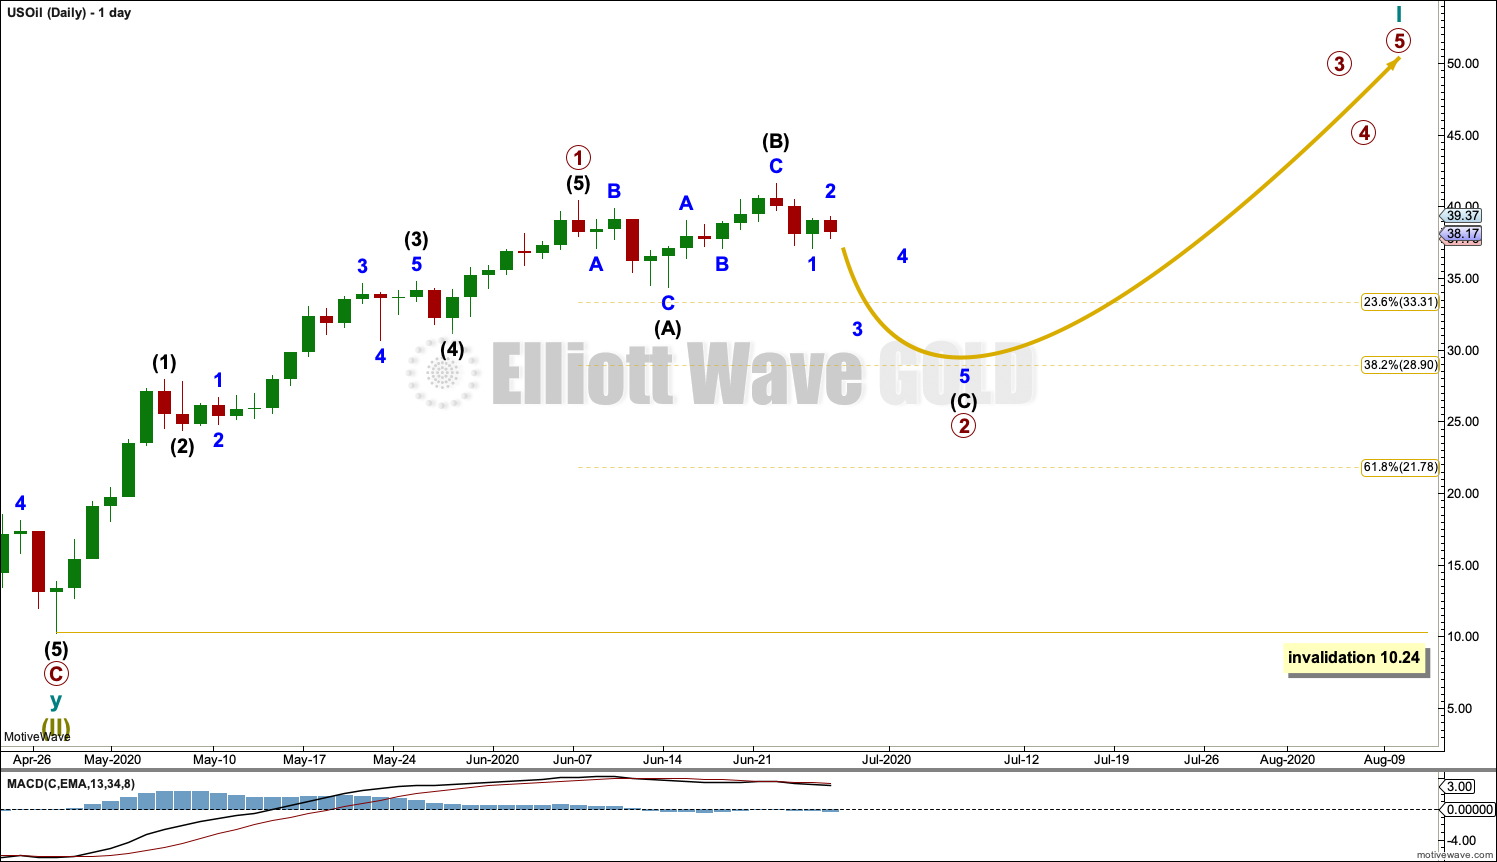
Labels are added for cycle wave I. Primary wave 1 within an impulse for cycle wave I may now be complete.
Primary wave 2 may be unfolding as an expanded flat correction. Intermediate wave (A) within the flat may be a complete zigzag. Intermediate wave (B) may also be a complete zigzag, at 1.2 times the length of intermediate wave (a). This is within the common range for intermediate wave (B) within a flat from 1 to 1.38 times the length of intermediate wave (A), giving a range from 40.44 to 42.75.
Primary wave 2 may end about the 0.382 Fibonacci ratio at 28.90.
Primary wave 2 may not move beyond the start of primary wave 1 below 10.24.
ALTERNATE DAILY CHART
Click chart to enlarge.
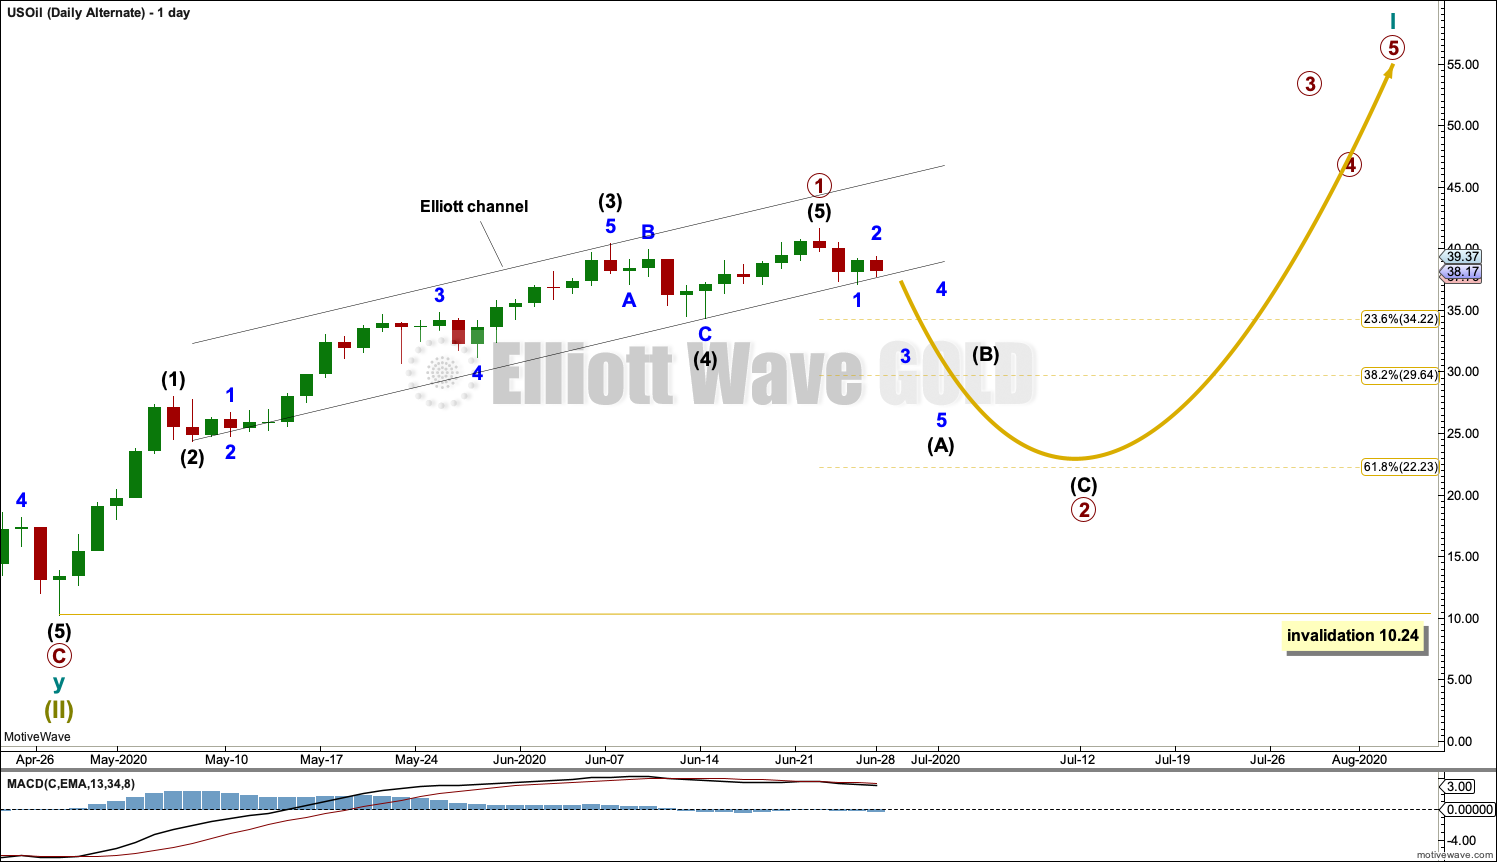
It is possible that primary wave 1 may have ended at this week’s high.
Primary wave 2 may have begun at this week’s high. The most common structure for a second wave is a zigzag. Primary wave 2 may end about the 0.618 Fibonacci ratio of primary wave 1, or it may be deeper than that target.
Primary wave 2 may not move beyond the start of primary wave 1 below 10.24.
SECOND ALTERNATE DAILY CHART
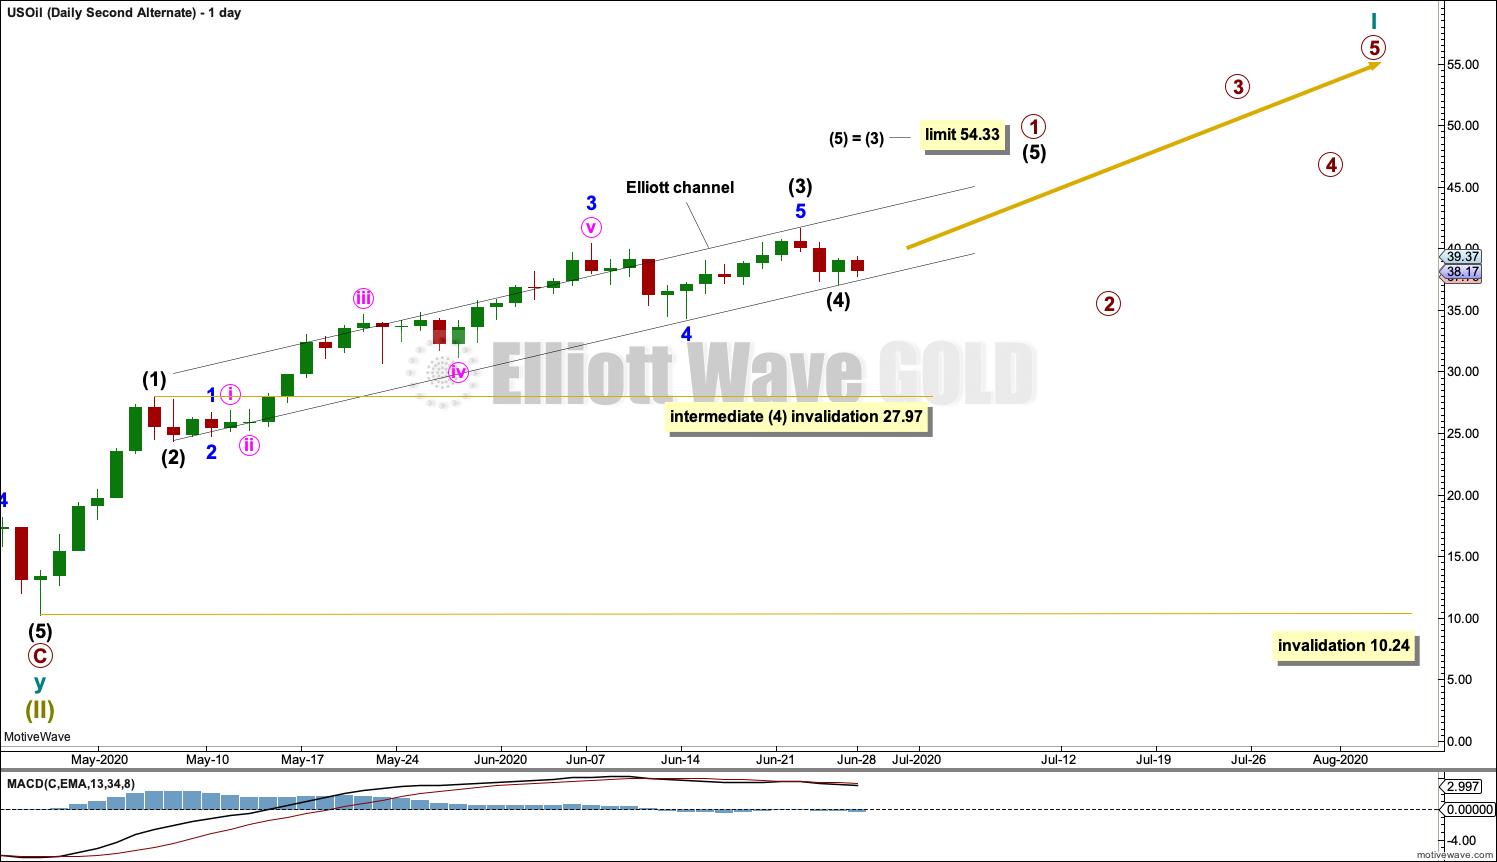
Click chart to enlarge.
It is also possible that primary wave 1 may be incomplete.
Intermediate wave (3) within primary wave 1 may be complete at this week’s high. Intermediate wave (3) at 17.25 in length is shorter than intermediate wave (1) at 17.73 in length. For this wave count, if intermediate wave (5) has begun at the low for June 25th, then it is limited to no longer than equality in length with intermediate wave (3) at 54.33.
Intermediate wave (4) may not move into intermediate wave (1) price territory below 27.97.
Primary wave 2 may not move beyond the start of primary wave 1 below 10.24.
TECHNICAL ANALYSIS
WEEKLY CHART
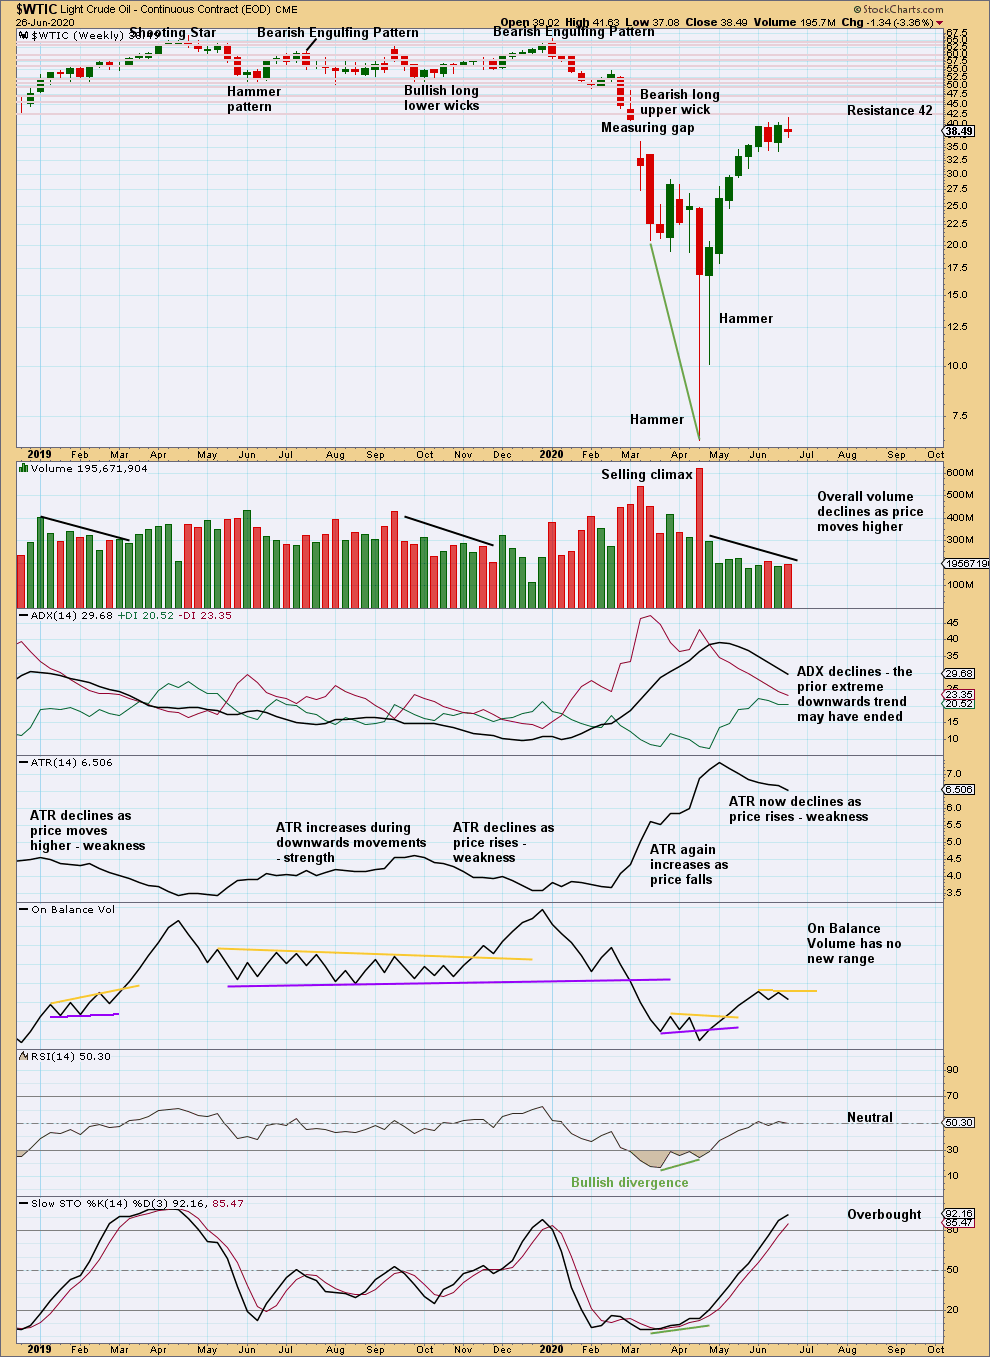
Click chart to enlarge. Chart courtesy of StockCharts.com.
The short-term volume profile remains slightly bearish and price remains just below a strong cluster of resistance. With Stochastics now overbought, the risk of a multi-week pullback remains high.
DAILY CHART
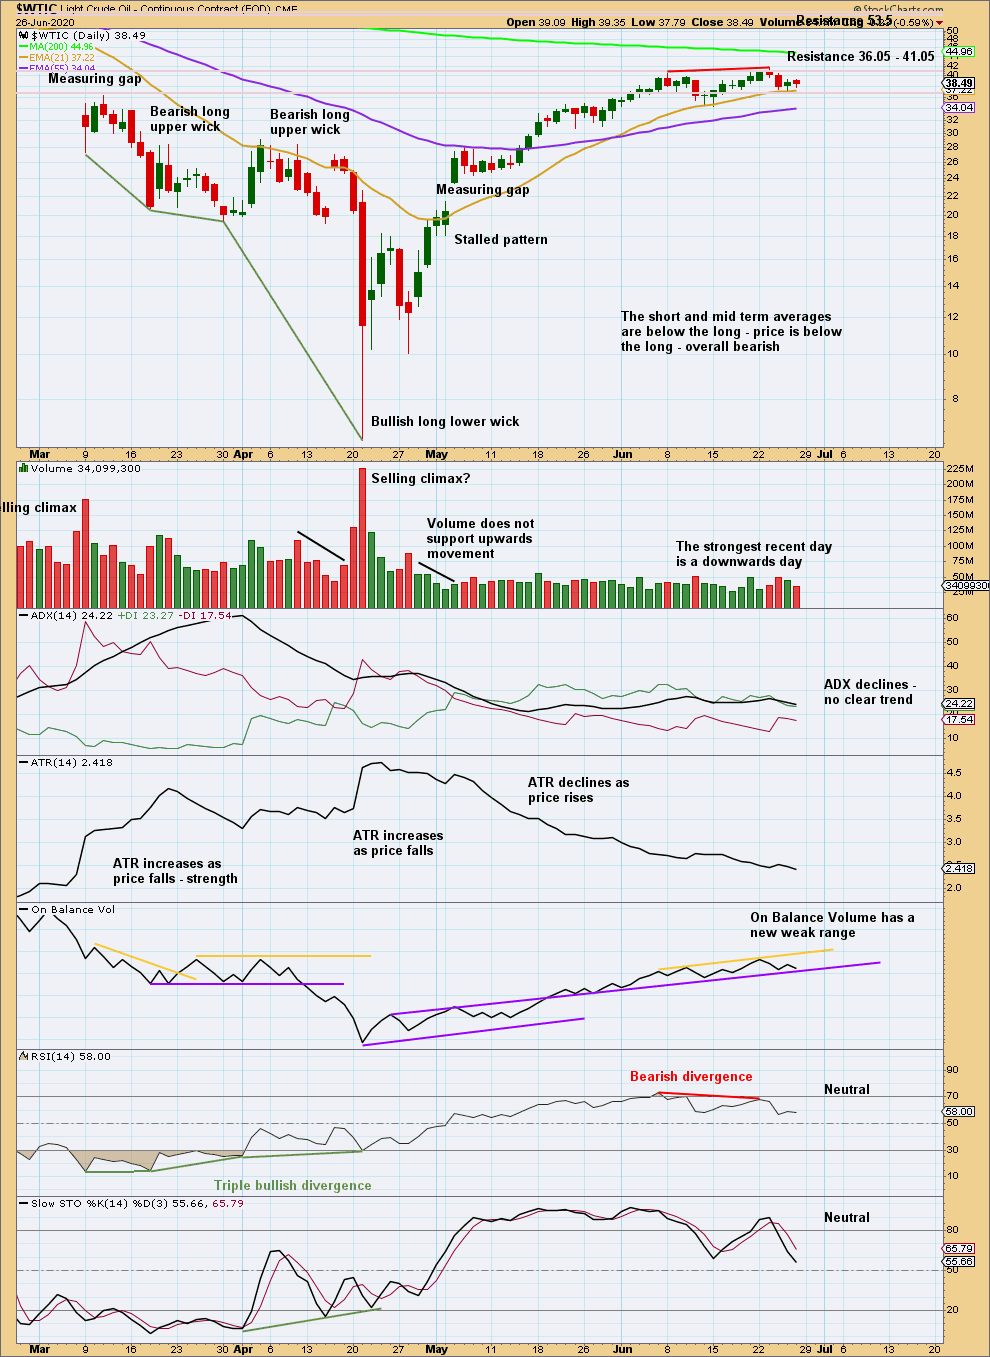
Click chart to enlarge. Chart courtesy of StockCharts.com.
Bearish divergence with price and RSI is now clearer. The probability of a multi-week pullback has increased this week.
—
Always practice good risk management as the most important aspect of trading. Always trade with stops and invest only 1-5% of equity on any one trade. Failure to manage risk is the most common mistake new traders make.