
Lara’s Weekly: Elliott Wave and Technical Analysis of S&P500 and Gold and US Oil | Charts – January 31, 2020

S&P 500
Downwards movement was expected for Friday, which is exactly what has happened.
The pullback or consolidation continues as expected.
Summary: A pullback or consolidation is underway. It may continue now through to the end of next week and possibly a little longer. Support is expected to be about 3,153; but if this expectation is wrong, it may be too low.
Three large pullbacks or consolidations (fourth waves) during the next 1-2 years are expected: for minor wave 4 (underway), then intermediate (4), and then primary 4.
The biggest picture, Grand Super Cycle analysis, is here.
Monthly charts were last published here. Video here.
ELLIOTT WAVE COUNTS
FIRST WAVE COUNT
WEEKLY CHART
Click chart to enlarge.
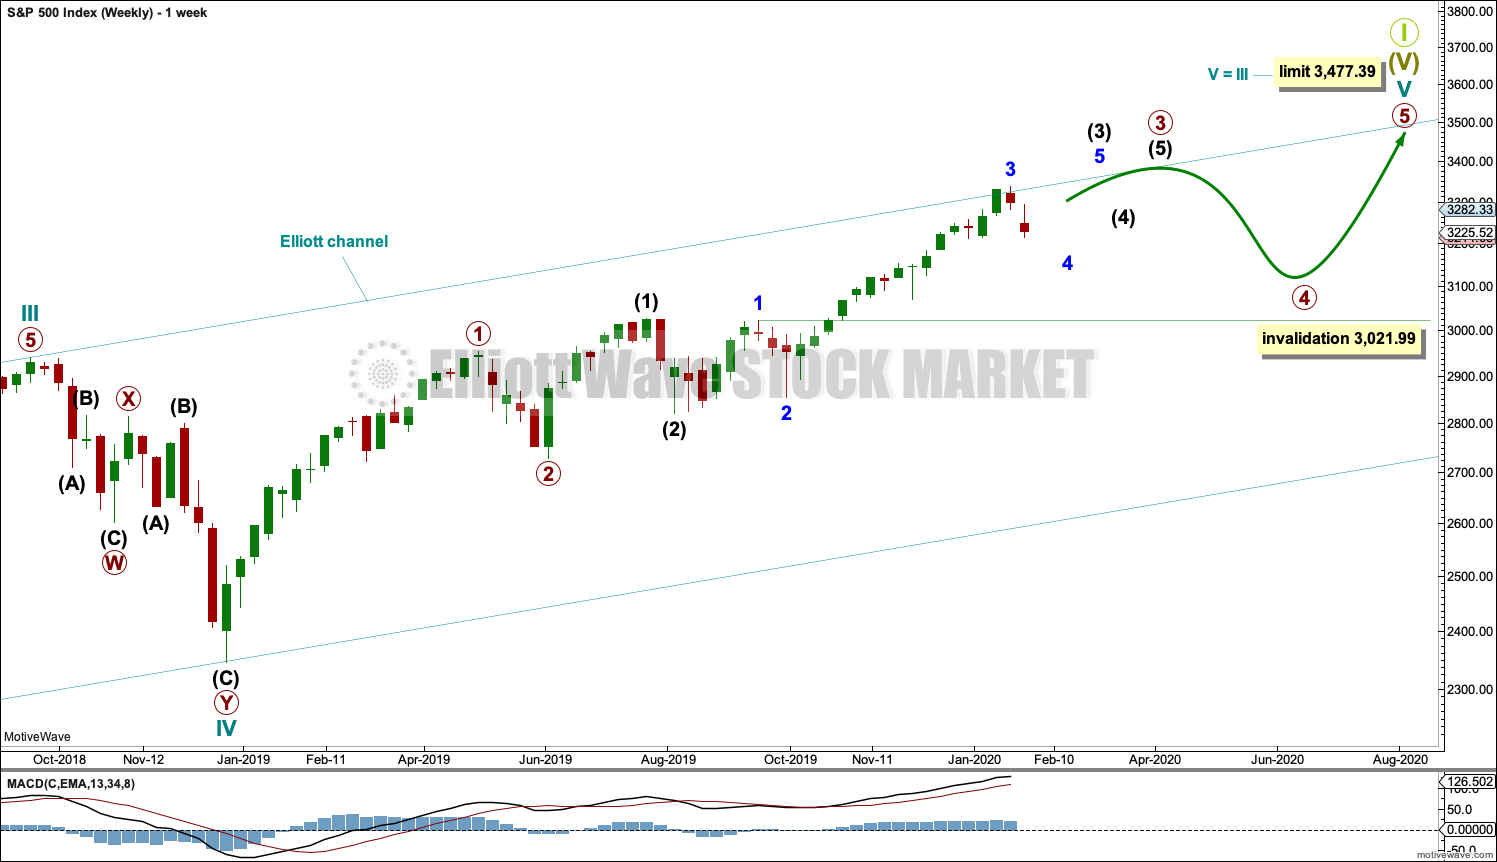
Cycle wave V may subdivide either as an impulse or an ending diagonal. Impulses are much more common, and it is clear at this stage that cycle wave V is an impulse and not a diagonal.
At this stage, cycle wave V may take another one to two or so years to complete.
A channel is drawn about the impulse of Super Cycle wave (V) using Elliott’s first technique. Draw this channel first from the high of 2,079.46 on the 5th of December 2014 to the high of 2,940.91 on the 21st of September 2018, then place a parallel copy on the low at 1,810.10 on the 11th of February 2016. Cycle wave IV found support about the lower edge.
Within Super Cycle wave (V), cycle wave III may not be the shortest actionary wave. Because cycle wave III is shorter than cycle wave I, this limits cycle wave V to no longer than equality in length with cycle wave III at 3,477.39. A new high by any amount at any time frame above this point would invalidate this main wave count in favour of one of the two alternate wave counts in the monthly chart analysis which are much more bullish.
The daily chart below will focus on movement from the end of minor wave 1 within intermediate wave (3).
Within cycle wave V, primary waves 1 and 2 may be complete. Within primary wave 3, intermediate waves (1) and (2) may be complete. Within intermediate wave (3), minor wave 4 may not move into minor wave 1 price territory below 3,021.99.
Within cycle wave V, the corrections of primary wave 2, intermediate wave (2) and minor wave 2 all show up clearly on the weekly chart. For cycle wave V to have the right look, the corresponding corrections of minor wave 4, intermediate wave (4) and primary wave 4 should also show up on the weekly chart. Three more large multi-week corrections are needed as cycle wave V continues higher, and for this wave count the whole structure must complete at or before 3,477.39.
DAILY CHART
Click chart to enlarge.
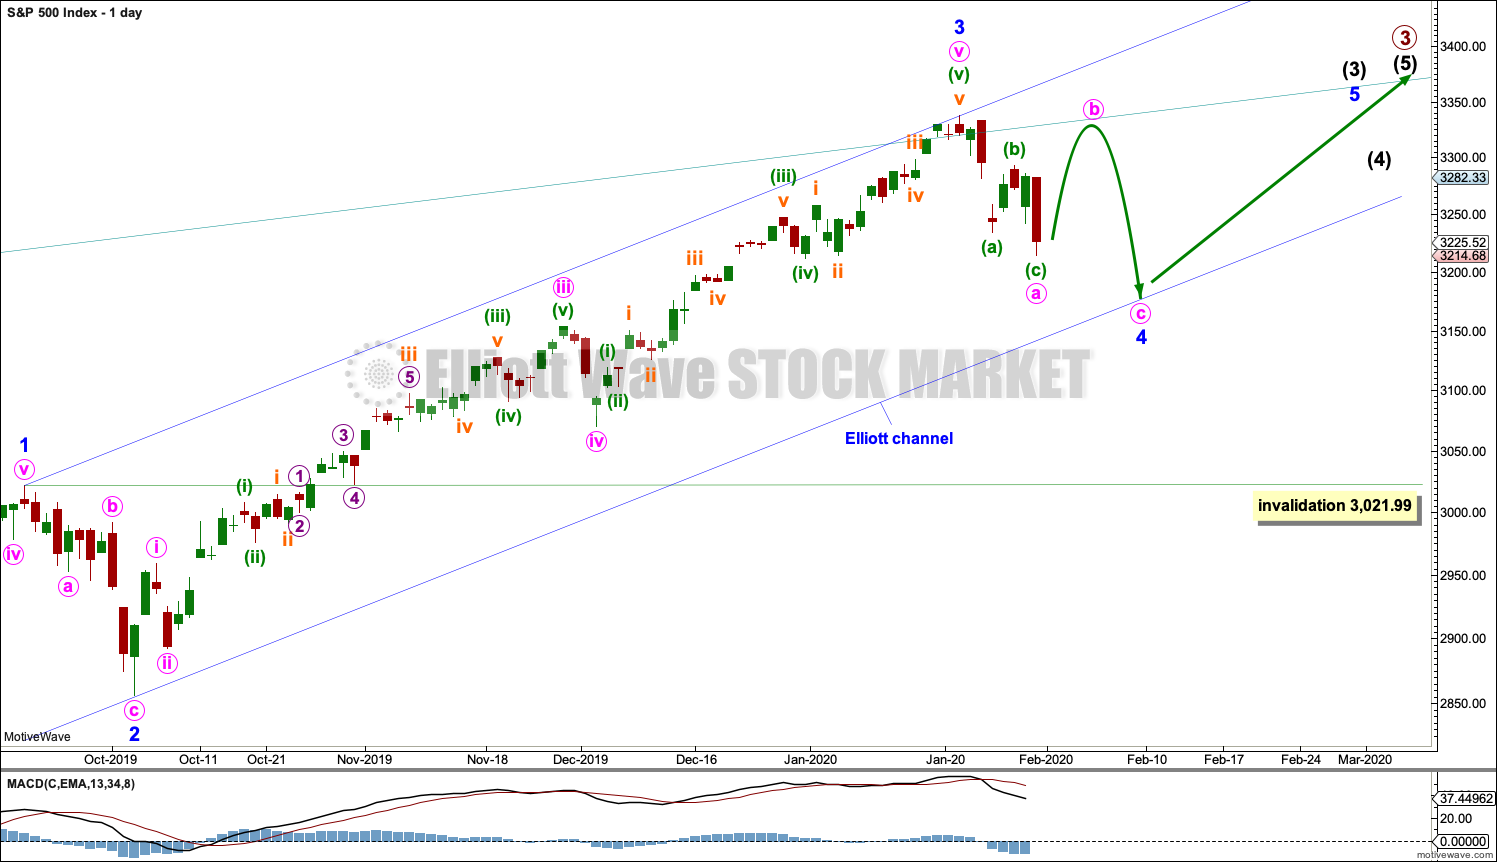
All of primary wave 3, intermediate wave (3) and minor wave 3 may only subdivide as impulses.
Minor wave 3 now looks complete.
Minor wave 2 was a sharp deep pullback, so minor wave 4 may be expected to be a very shallow sideways consolidation to exhibit alternation. Minor wave 2 lasted 2 weeks. Minor wave 4 may be about the same duration, or it may be a longer lasting consolidation. Minor wave 4 may end within the price territory of the fourth wave of one lesser degree; minute wave iv has its range from 3,154.26 to 3,070.49. However, this target zone at this stage looks to be too low.
Minor wave 4 may not move into minor wave 1 price territory below 3,021.99.
When minor wave 4 may be complete, then a target will again be calculated for intermediate wave (3).
When intermediate waves (3) and (4) may be complete, then a target will again be calculated for primary wave 3.
Draw an Elliott channel about intermediate wave (3): draw the first trend line from the end of minor wave 1 to the end of minor wave 3, then place a parallel copy on the end of minor wave 2. Minor wave 4 may find support at the lower edge of this channel if it is long lasting or deep enough. It is possible that minor wave 4 may breach the lower edge of the channel as fourth waves are not always contained within a channel drawn using this technique. If minor wave 4 breaches the channel, then it shall need to be redrawn using Elliott’s second technique.
Price has recently reached just above the upper edge of the wide teal channel copied over from monthly and weekly charts. A reaction downwards here increases the technical significance of this trend line.
Minor wave 4 may subdivide as any corrective structure, most likely a flat, triangle or combination. Within all of a flat, triangle or combination, there should be an upwards wave which may be fairly deep. That may unfold next week. If that expectation is wrong, then minute wave a may continue lower first.
SECOND WAVE COUNT
WEEKLY CHART
Click chart to enlarge.
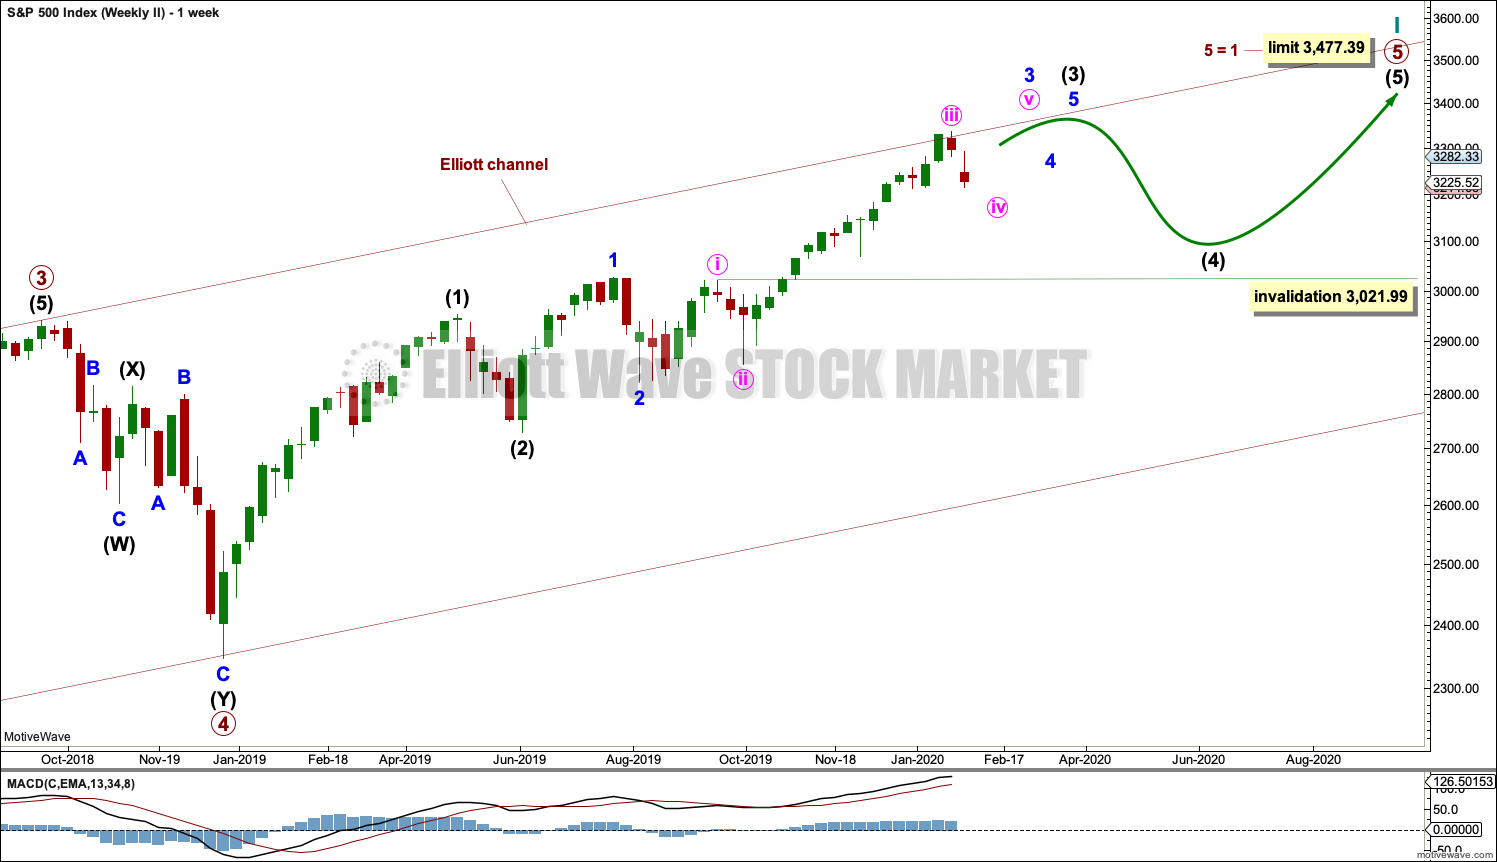
This second wave count sees all subdivisions from the end of the March 2009 low in almost the same way, with the sole difference being the degree of labelling.
If the degree of labelling for the entirety of this bull market is all moved down one degree, then only a first wave at cycle degree may be nearing an end.
When cycle wave I is complete, then cycle wave II should meet the technical definition of a bear market as it should retrace more than 20% of cycle wave I, but it may end about either the 0.382 or 0.618 Fibonacci Ratios of cycle wave I. Cycle wave II may end close to the low of primary wave II within cycle wave I, which is at 1,810.10. It is also possible that cycle wave II could be fairly shallow and only barely meet the definition of a bear market.
The impulse is still viewed as nearing an end; a fifth wave is still seen as needing to complete higher. This wave count labels it primary wave 5. Primary wave 5 may still need another year to two or so to complete, depending upon how time consuming the corrections within it may be.
Primary wave 5 may be subdividing as an impulse, in the same way that cycle wave V is seen for the first weekly chart.
TECHNICAL ANALYSIS
MONTHLY CHART
Click chart to enlarge. Chart courtesy of StockCharts.com.
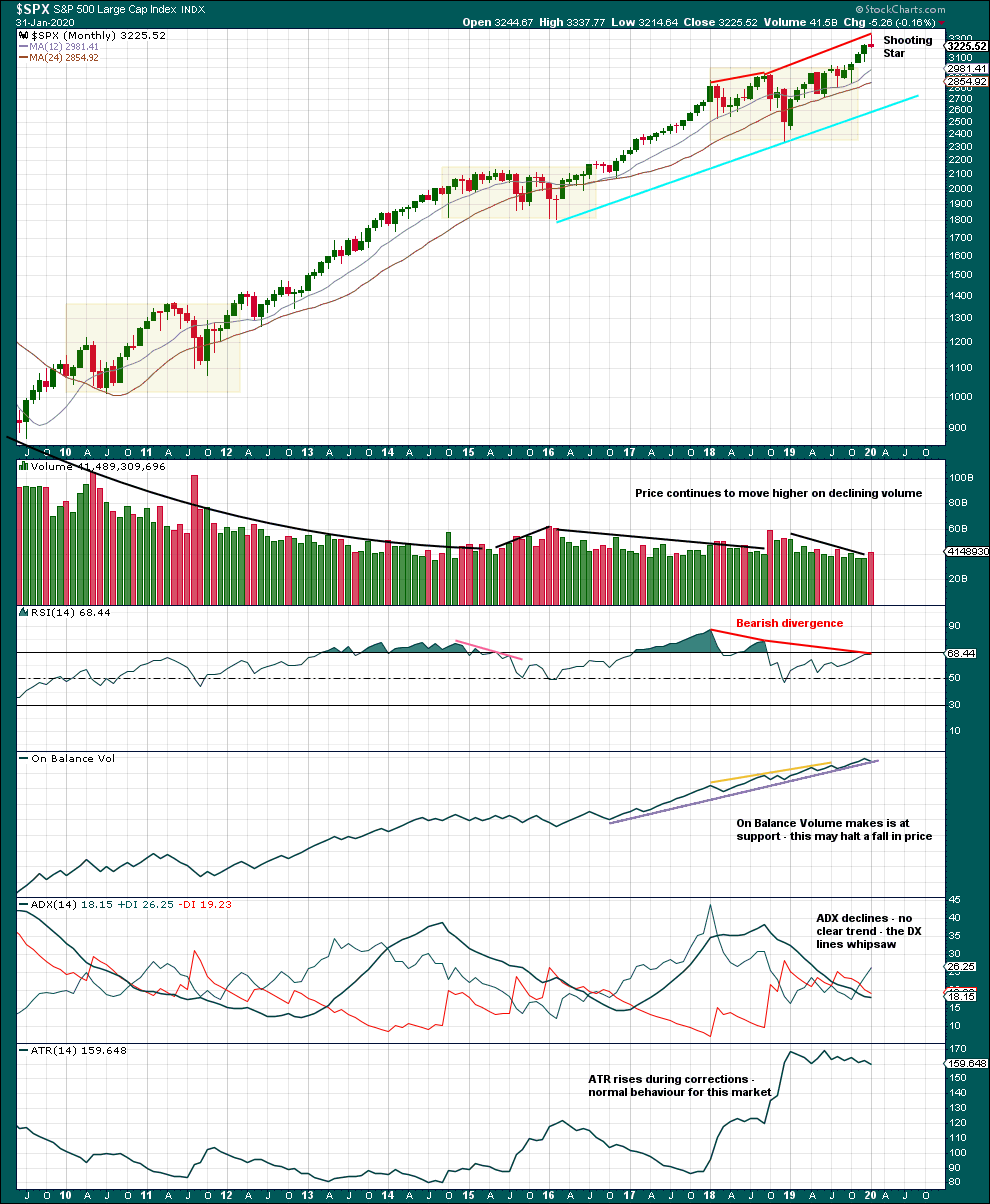
Now that January 2020 is complete, this monthly candlestick may be analysed.
The Shooting Star pattern is a bearish reversal pattern when it occurs in the context of an upwards trend, as this one does. This suggests a normal curve down to back test support at prior resistance may have begun.
WEEKLY CHART
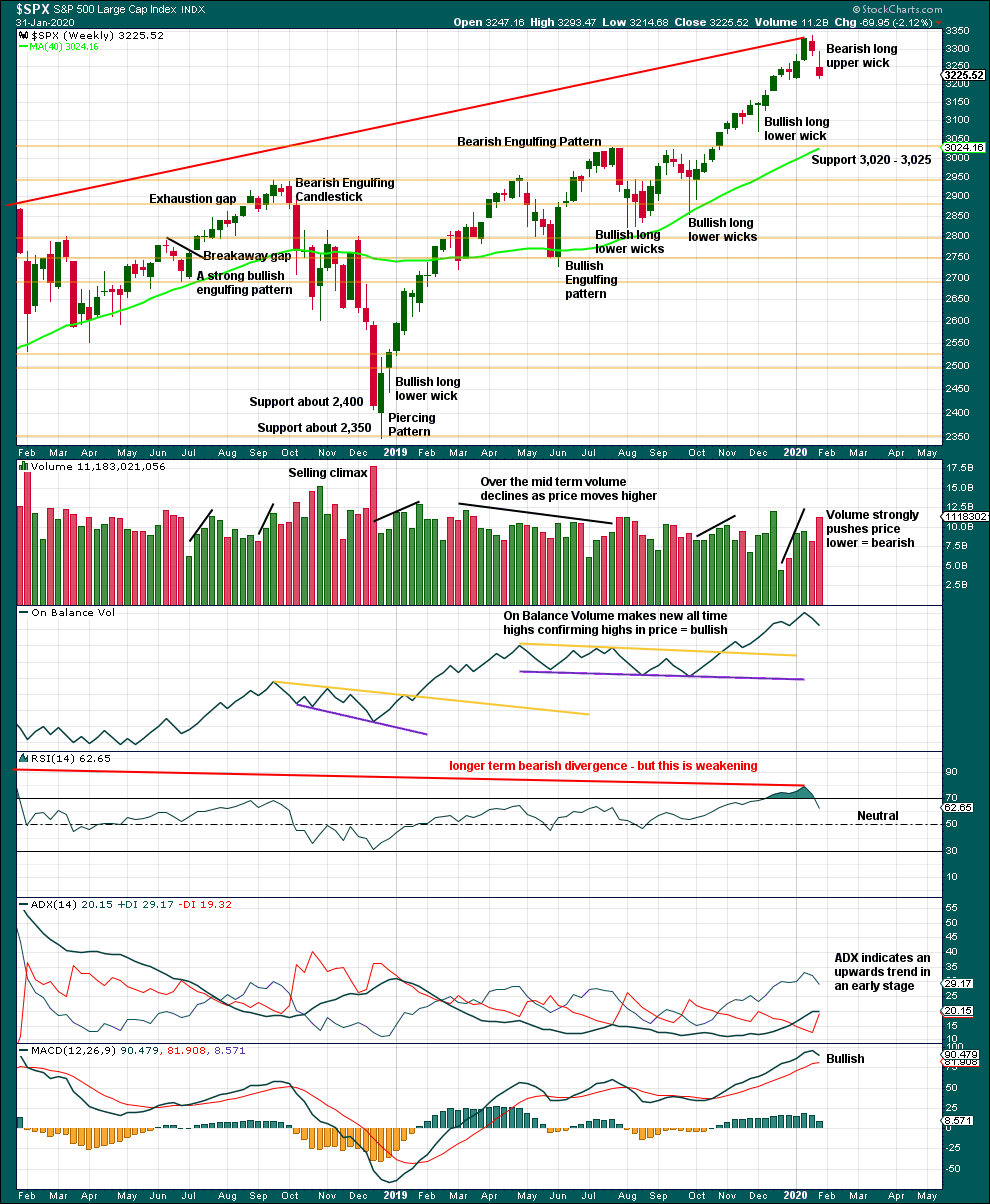
Click chart to enlarge. Chart courtesy of StockCharts.com.
It is very clear that the S&P is in an upwards trend and the bull market is continuing. Price does not move in straight lines; there will be pullbacks and consolidations along the way.
This chart is overall bullish. There are no signs of weakness in upwards movement.
A pullback or consolidation has begun. This is relieving extreme conditions. Look for strong support below about 3,020 to 3,025.
DAILY CHART
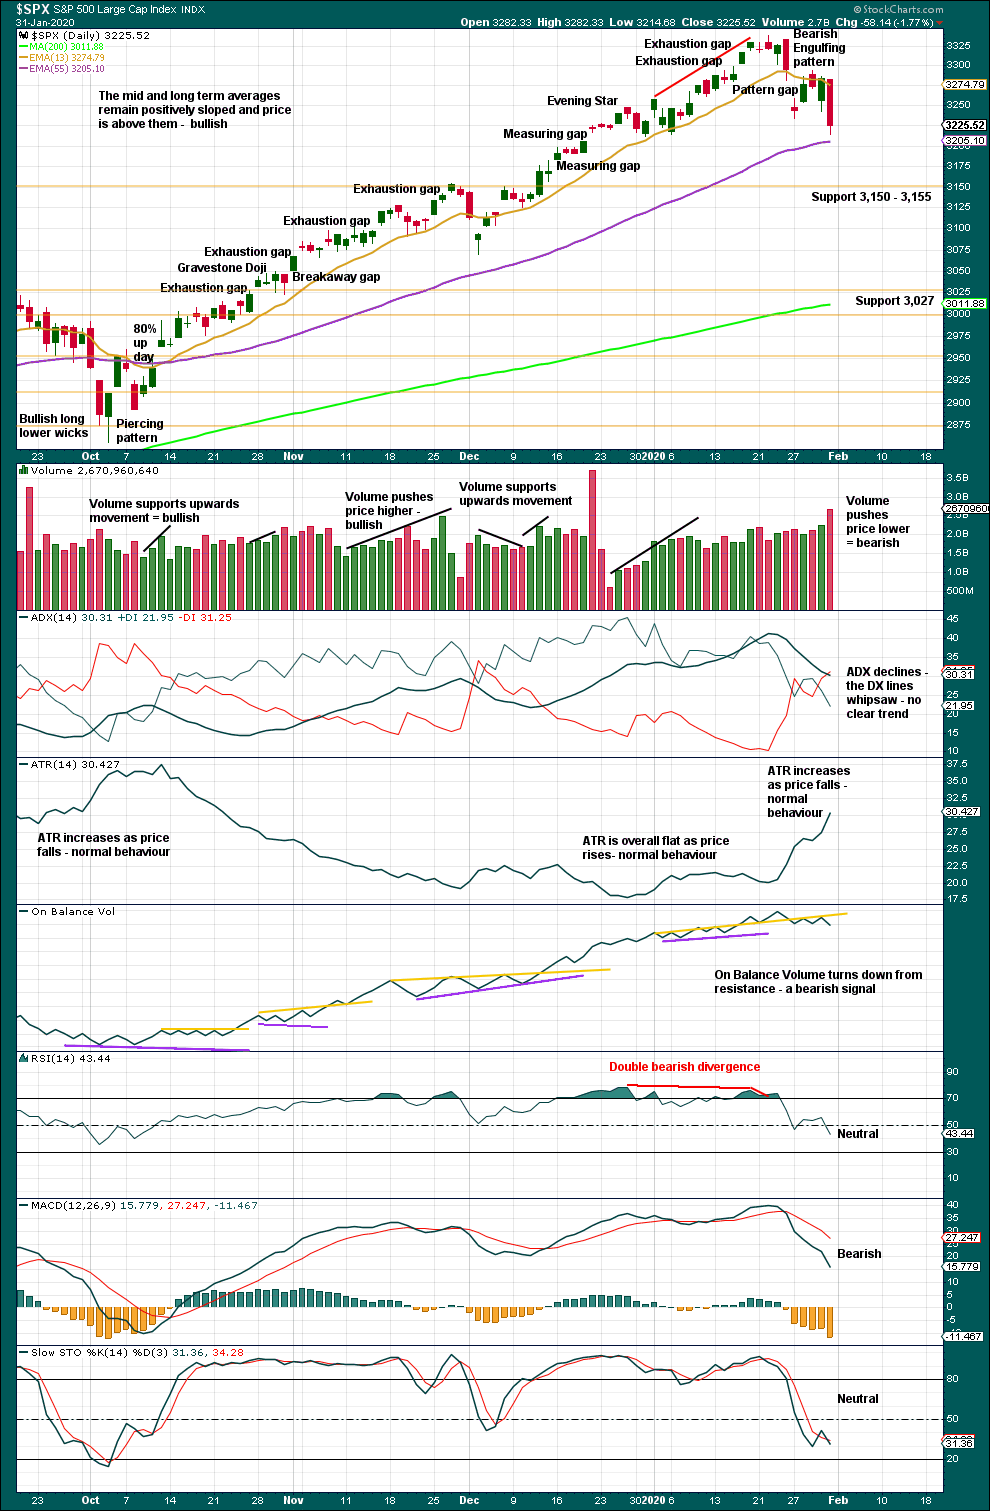
Click chart to enlarge. Chart courtesy of StockCharts.com.
The larger trend, particularly at the monthly time frame, remains up. Expect pullbacks and consolidations to be more short term in nature although they can last a few weeks.
In a bull market which may continue for months or years, pullbacks and consolidations may present opportunities for buying when price is at or near support.
Price is not yet at support and Stochastics is not yet oversold. Next support is at 3,150 to 3,155.
Sustainable lows may be identified by a 180° reversal of sentiment in a 90% down day followed by one or more of the following things:
– Either a 90% up day or two back to back 80% up days within 3 sessions of the 90% down day.
– RSI may reach oversold and then exhibit bullish divergence.
– A strong bullish candlestick pattern with support from volume.
In the absence of bullish reversal signs, expect the pullback or consolidation to continue.
BREADTH – AD LINE
WEEKLY CHART

Click chart to enlarge. Chart courtesy of StockCharts.com. So that colour blind members are included, bearish signals will be noted with blue and bullish signals with yellow.
Bear markets from the Great Depression and onwards have been preceded by an average minimum of 4 months divergence between price and the AD line with only two exceptions in 1946 and 1976. With the AD line making new all time highs last week, the end of this bull market and the start of a new bear market is very likely a minimum of 4 months away, which is mid May 2020.
In all bear markets in the last 90 years there is some positive correlation (0.6022) between the length of bearish divergence and the depth of the following bear market. No to little divergence is correlated with more shallow bear markets. Longer divergence is correlated with deeper bear markets.
If a bear market does develop here, it comes after no bearish divergence. It would therefore more likely be shallow.
This week both price and the AD line have moved lower. Downwards movement has support from declining market breadth. The AD line has made a slight new low below the short-term low three weeks prior, but price has not but only by 0.04 points. This divergence is bearish, but it is very weak. The important point to note is that it is not bullish.
Large caps all time high: 3,337.77 on 22nd January 2020.
Mid caps all time high: 2,106.30 on 17th January 2020.
Small caps all time high: 1,100.58 on 27th August 2018.
For the short term, there is a little weakness now in only large caps making most recent new all time highs.
DAILY CHART
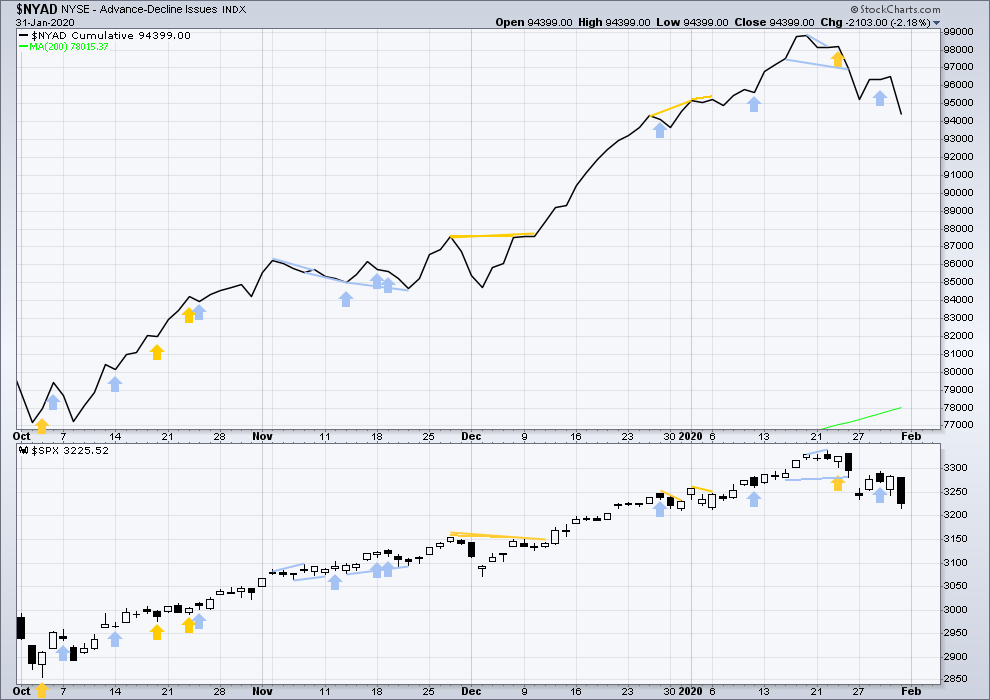
Click chart to enlarge. Chart courtesy of StockCharts.com. So that colour blind members are included, bearish signals will be noted with blue and bullish signals with yellow.
Breadth should be read as a leading indicator.
To end the week both price and the AD line have moved lower. There is no new short-term divergence. Falling price has support from declining market breadth, which is bearish.
VOLATILITY – INVERTED VIX CHART
WEEKLY CHART
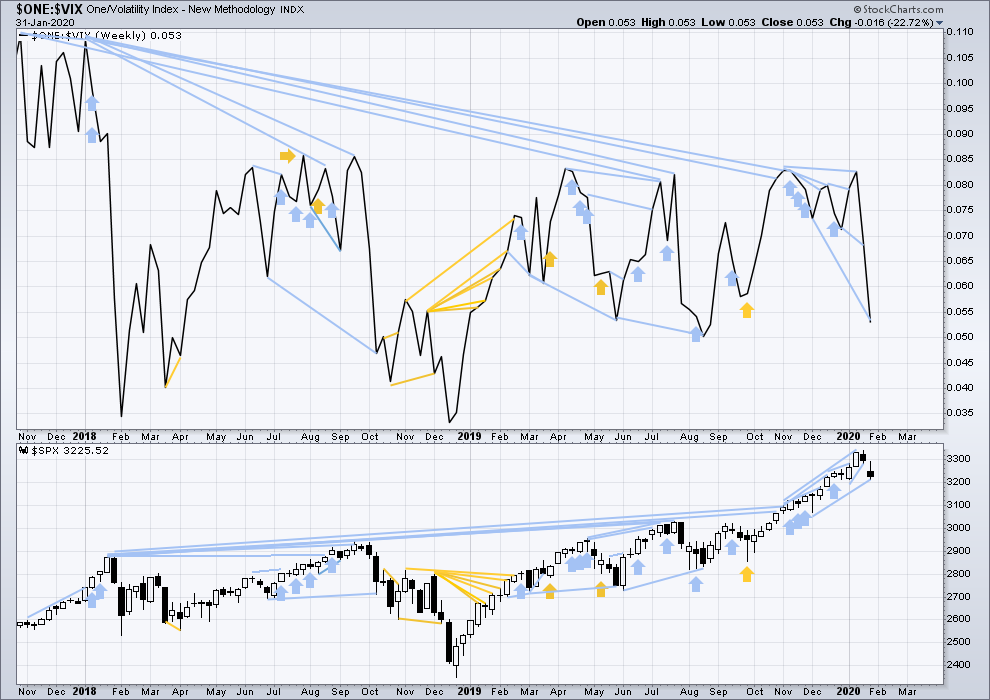
Click chart to enlarge. Chart courtesy of StockCharts.com. So that colour blind members are included, bearish signals will be noted with blue and bullish signals with yellow.
The all time high for inverted VIX was on 30th October 2017. There is now over two years of bearish divergence between price and inverted VIX.
The rise in price is not coming with a normal corresponding decline in VIX; VIX remains elevated. This long-term divergence is bearish and may yet develop further as the bull market matures.
This divergence may be an early warning, a part of the process of a top developing that may take years. It may is clearly not useful in timing a trend change from bull to a fully fledged bear market.
This week both price and inverted VIX have moved lower. Inverted VIX is falling faster than price. It has made a new mid-term low below the prior low 8 weeks ago, but price has not. This divergence is bearish.
DAILY CHART
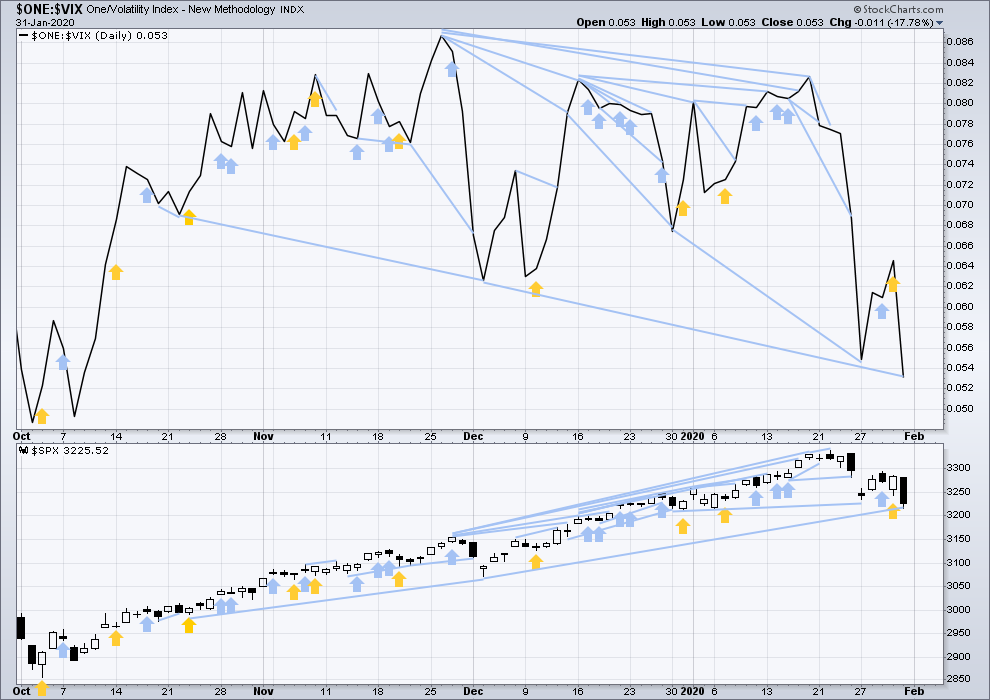
Click chart to enlarge. Chart courtesy of StockCharts.com. So that colour blind members are included, bearish signals will be noted with blue and bullish signals with yellow.
Both price and inverted VIX have moved strongly lower. Inverted VIX has made a strong new low below the prior low of the 23rd of October, but price has not. This divergence is bearish.
DOW THEORY
Dow Theory confirmed a bear market in December 2018. This does not necessarily mean a bear market at Grand Super Cycle degree though; Dow Theory makes no comment on Elliott wave counts. On the 25th of August 2015 Dow Theory also confirmed a bear market. The Elliott wave count sees that as part of cycle wave II. After Dow Theory confirmation of a bear market in August 2015, price went on to make new all time highs and the bull market continued.
DJIA: 23,344.52 – a close on the 19th of December at 23,284.97 confirms a bear market.
DJT: 9,806.79 – price has closed below this point on the 13th of December.
S&P500: 2,532.69 – a close on the 19th of December at 2,506.96 provides support to a bear market conclusion.
Nasdaq: 6,630.67 – a close on the 19th of December at 6,618.86 provides support to a bear market conclusion.
With all the indices having moved higher following a Dow Theory bear market confirmation, Dow Theory would confirm a bull market if the following highs are made:
DJIA: 26,951.81 – a close above this point has been made on the 3rd of July 2019.
DJT: 11,623.58 – to date DJT has failed to confirm an ongoing bull market.
S&P500: 2,940.91 – a close above this point was made on the 29th of April 2019.
Nasdaq: 8,133.30 – a close above this point was made on the 26th of April 2019.
GOLD
Upwards movement for Gold continues towards Elliott wave targets.
Summary: Upwards movement may continue next week. Targets are 1,626 (main bear count) or 1,635 then 1,693 (bull count).
Alternatively, a new low below 1,536.52 would indicate a high was in place on the 8th of January and a downwards trend has begun. The alternate bearish wave count outlines this possibility.
Grand SuperCycle analysis is here.
Monthly charts were last updated here.
BEARISH ELLIOTT WAVE COUNT
WEEKLY CHART
Click chart to enlarge.
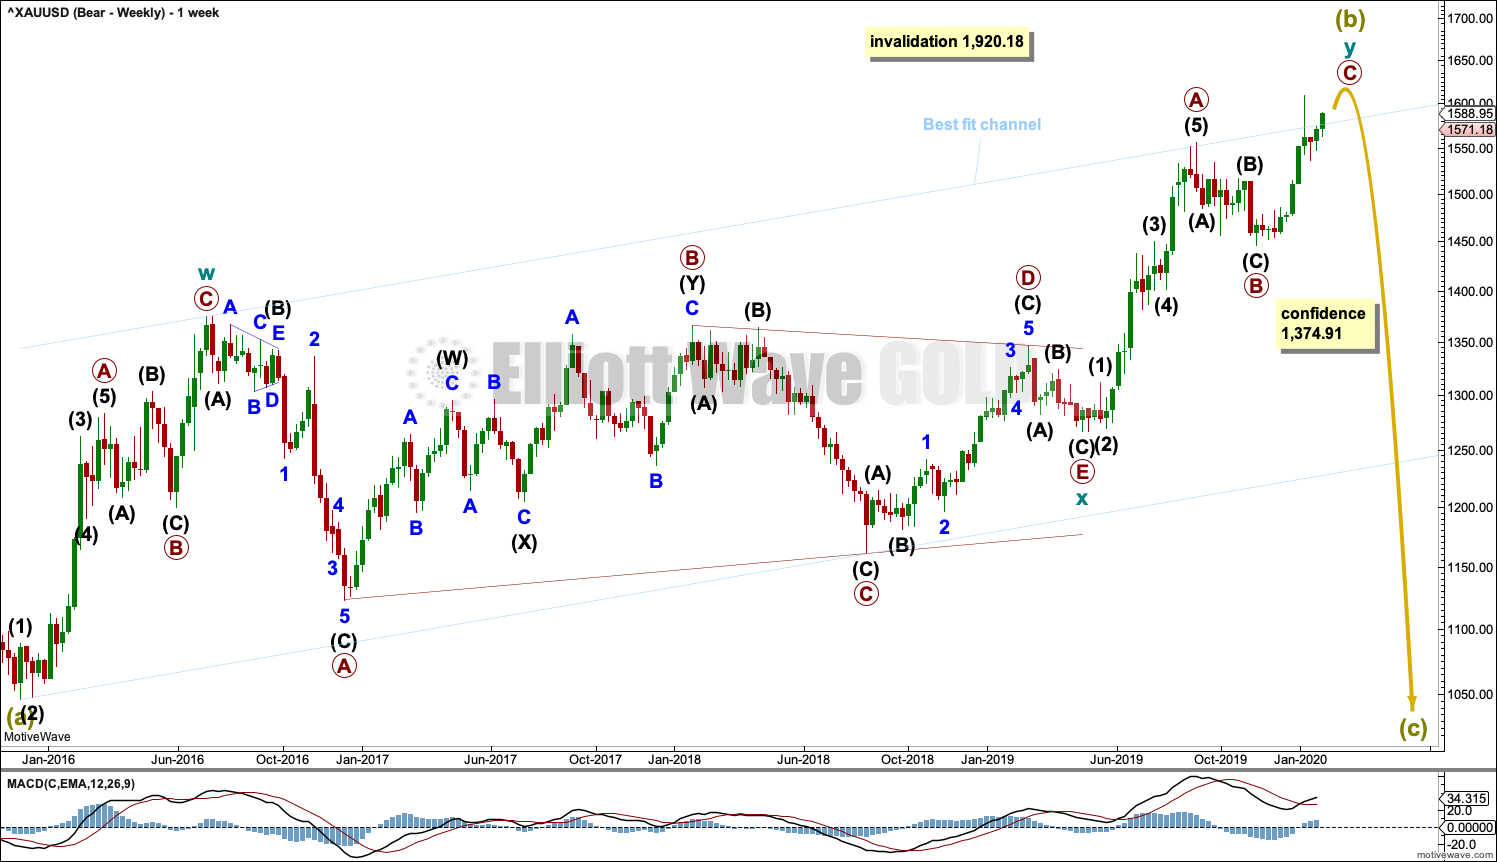
Super Cycle wave (b) may still be an incomplete double zigzag, requiring one more high.
The first zigzag in the double is labelled cycle wave w. The double is joined by a three in the opposite direction, a triangle labelled cycle wave x. The second zigzag in the double is labelled cycle wave y.
The purpose of the second zigzag in a double is to deepen the correction. Cycle wave y has achieved this purpose.
After the structure of cycle wave y may be complete, then a new low below 1,374.91 would add strong confidence to this wave count. At that stage, the bullish Elliott wave count would be invalidated. At that stage, targets for Super Cycle wave (c) would be calculated.
A wide best fit channel is added in light blue. Copy this channel over to daily charts. The upper edge of this channel has again been overshot and now price has returned back to within the channel.
DAILY CHART
Click chart to enlarge.
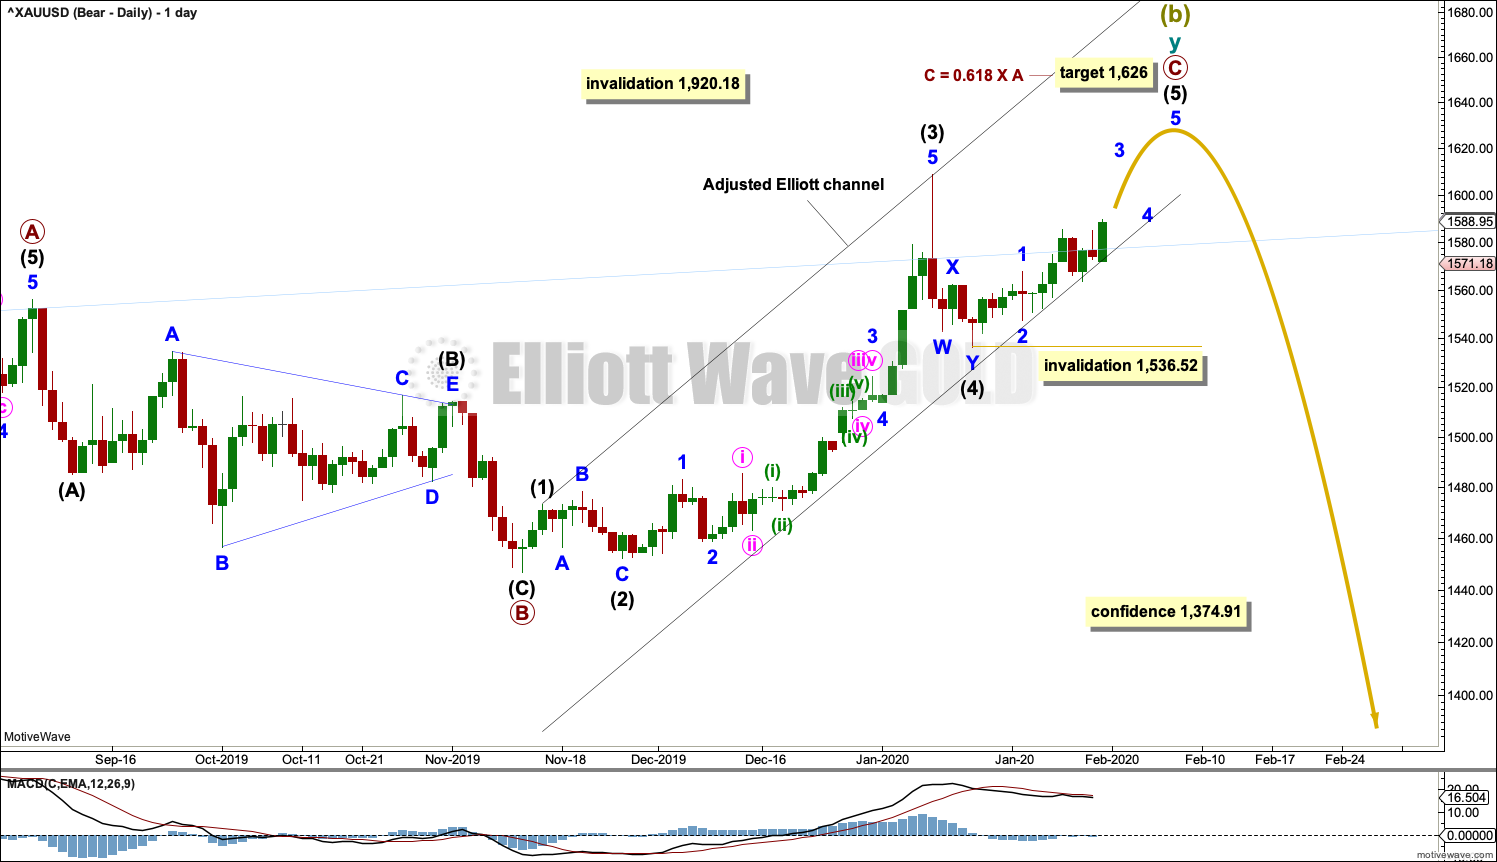
The double zigzag for Super Cycle wave (b) may be still incomplete.
Within cycle wave y, primary waves A and B are complete. Primary wave C must complete as a five wave structure. It is unfolding as an impulse. Within the impulse, intermediate waves (1) to (4) may now be complete.
Intermediate wave (2) was a deep 0.79 zigzag, which lasted 8 sessions. Intermediate wave (4) may have been a shallow 0.46 double zigzag lasting 4 sessions. Fourth waves are usually more brief than second waves for Gold.
Within intermediate wave (5), no second wave correction may move beyond the start of its first wave below 1,536.52.
Drawn an Elliott channel about primary wave C and then pull the lower edge down to sit on recent lows. The lower edge may provide support to intermediate wave (5) as it continues higher.
ALTERNATE DAILY CHART
Click chart to enlarge.
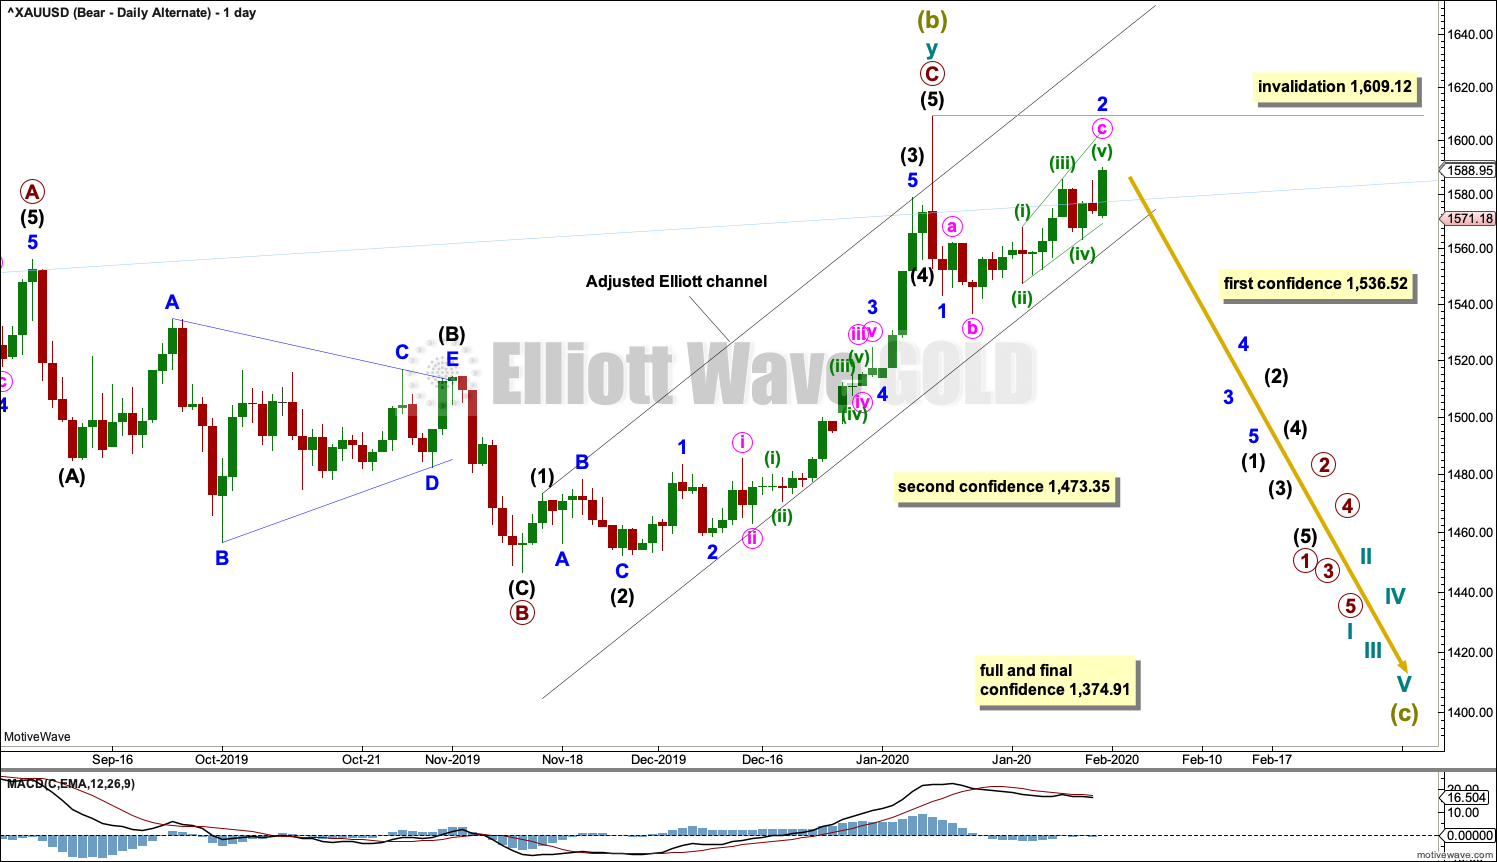
Alternatively, it is possible again that Super Cycle wave (b) may be complete and the bear market for Gold may have resumed.
A new low below 1,536.52 would invalidate the main bearish wave count and add some confidence in this alternate. A new low below 1,473.35 would add further confidence. Thereafter, a new low by any amount at any time frame below 1,374.91 would invalidate the bullish wave count below and add full and final confidence in this wave count. Targets for Super Cycle wave (c) would be calculated at that stage.
If Super Cycle wave (c) has begun, then it should develop a five wave structure downwards at all time frames up to and including monthly.
Minor wave 1 may be complete. Minor wave 2 may not move beyond the start of minor wave 1 above 1,609.12.
BULLISH ELLIOTT WAVE COUNT
WEEKLY CHART
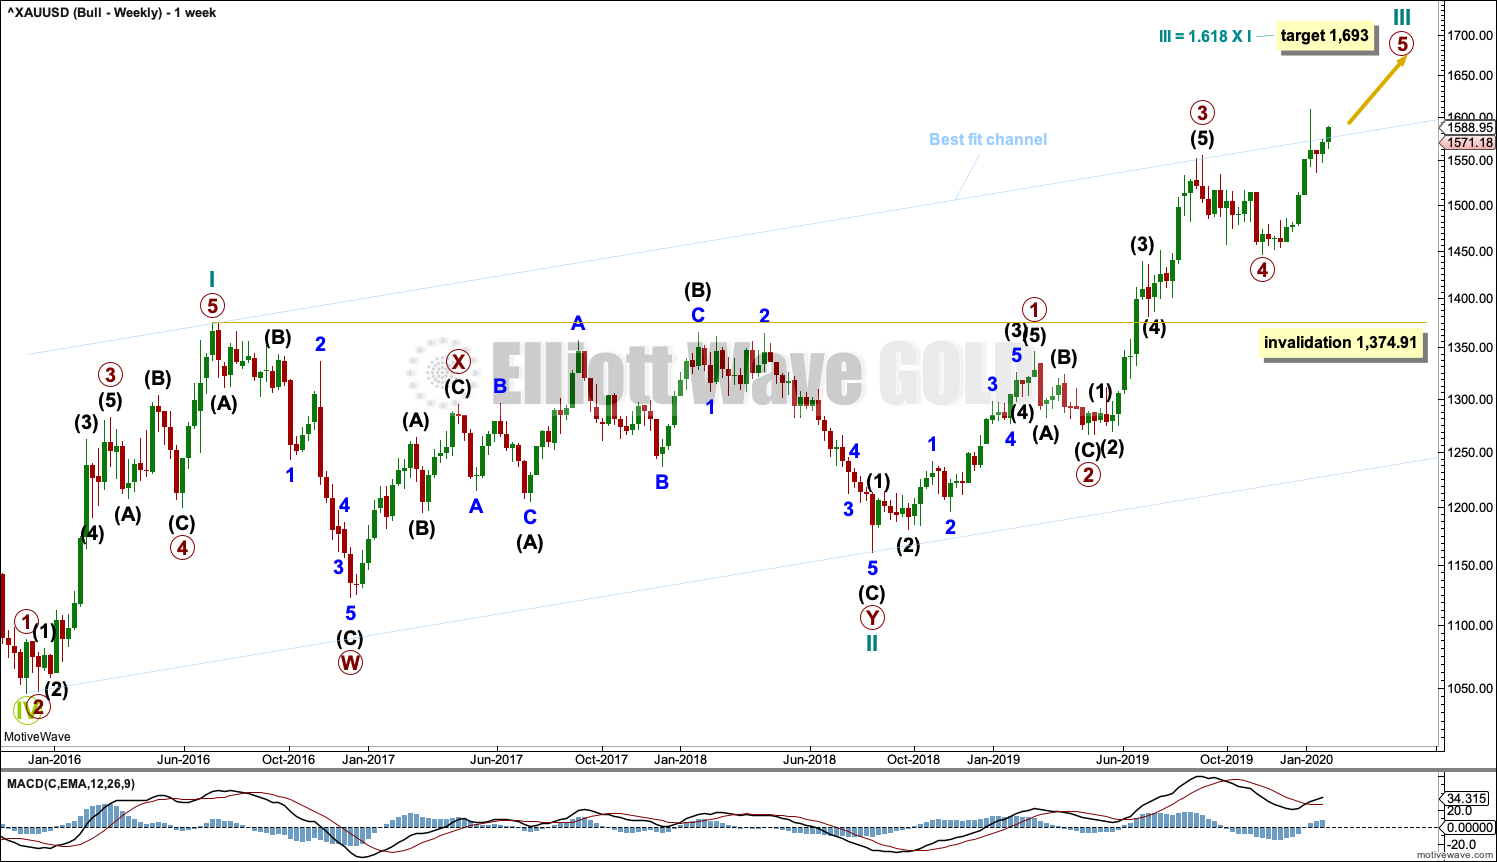
Click chart to enlarge.
This wave count sees the the bear market complete at the last major low for Gold on 3 December 2015.
If Gold is in a new bull market, then it should begin with a five wave structure upwards on the weekly chart. However, the biggest problem with this wave count is the structure labelled cycle wave I because this wave count must see it as a five wave structure, but it looks more like a three wave structure.
Commodities often exhibit swift strong fifth waves that force the fourth wave corrections coming just prior and just after to be more brief and shallow than their counterpart second waves. It is unusual for a commodity to exhibit a quick second wave and a more time consuming fourth wave, and this is how cycle wave I is labelled. This wave count still suffers from this very substantial problem, which is one reason why the bearish wave count is preferred because it has a better fit in terms of Elliott wave structure.
Cycle wave II subdivides well as a double combination: zigzag – X – expanded flat.
Cycle wave III may have begun. Within cycle wave III, primary waves 1 through to 4 may now be complete. Primary wave 5 may be complete at any stage now; this would complete the whole structure of cycle wave III. Cycle wave IV may not move into cycle wave I price territory below 1,374.91.
Add the wide best fit channel to weekly and daily charts.
DAILY CHART
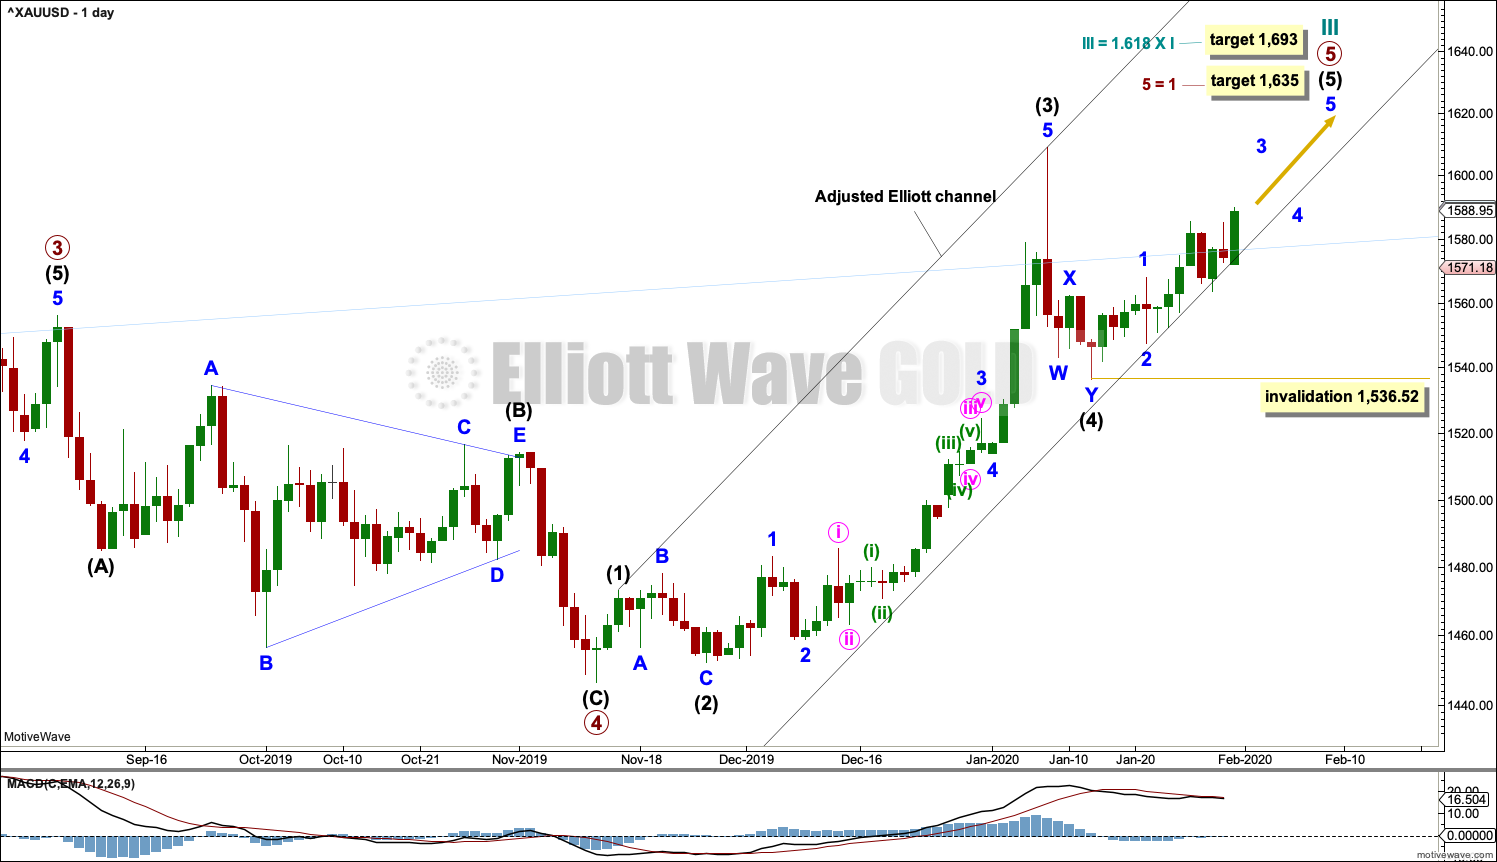
Click chart to enlarge.
A target for cycle wave III is calculated also now at primary degree. If price reaches the first target and keeps rising, then the second higher target may be used.
Primary wave 5 may only subdivide as a five wave structure, most likely an impulse. Within primary wave 5, intermediate waves (1) through to (4) may now be complete.
Draw an adjusted Elliott channel about primary wave 5. Intermediate wave (5) may find support at the lower edge as it moves higher.
This wave count for the next few weeks remains essentially the same as the main bearish wave count. Both wave counts see a fourth wave complete and a fifth wave now beginning and requiring more upwards movement.
TECHNICAL ANALYSIS
WEEKLY CHART
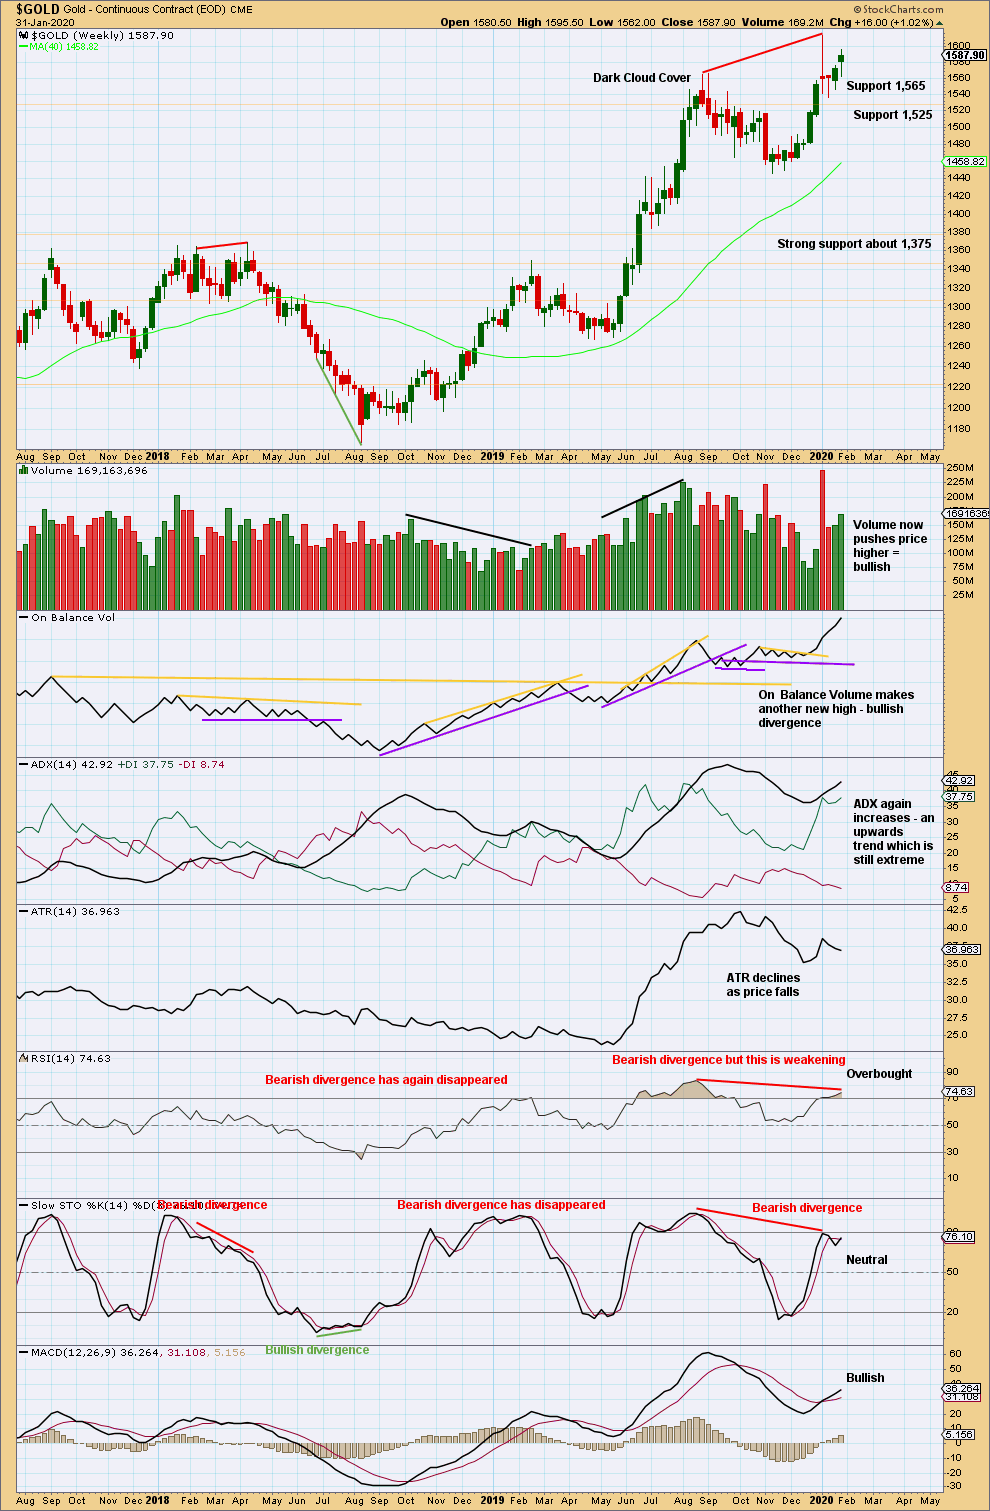
Click chart to enlarge. Chart courtesy of StockCharts.com.
Bullish divergence between price and On Balance Volume is contradicted by bearish divergence between price and RSI. More weight may be given to RSI as this tends to be slightly more reliable, particularly after it has reached extreme. This would support the alternate bearish wave count.
DAILY CHART
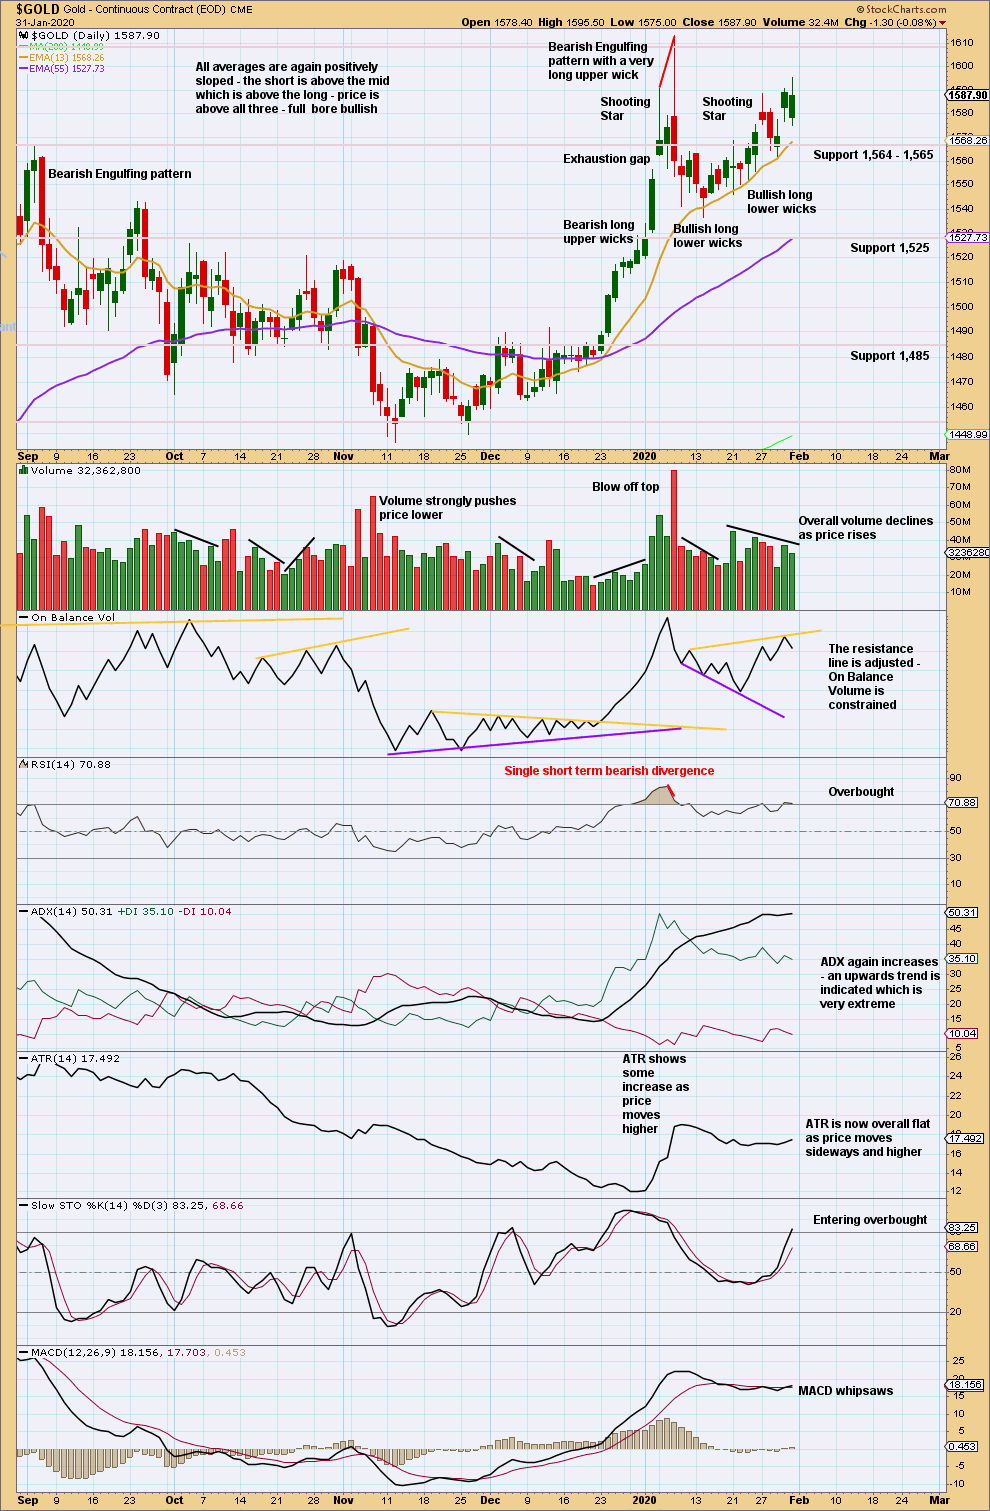
Click chart to enlarge. Chart courtesy of StockCharts.com.
The last Bearish Engulfing pattern has strong support from volume, which increases the bearish implications. Expect a trend change to either down or sideways.
Volume and On Balance Volume are bullish, but a very extreme ADX indicates upwards movement here may be limited.
GDX WEEKLY CHART
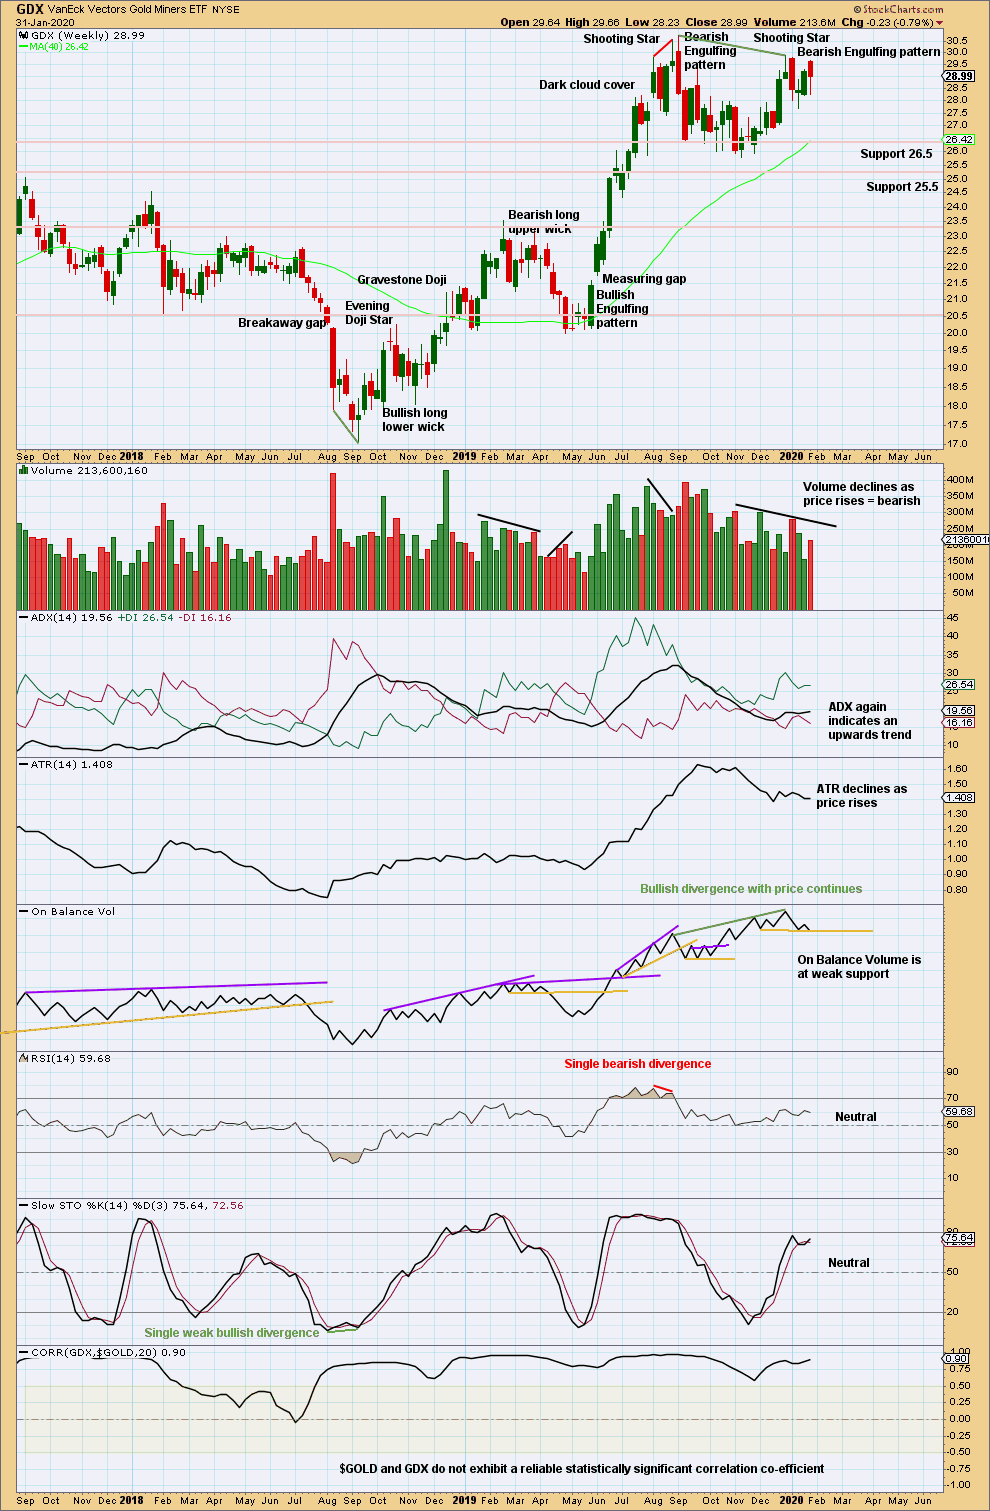
Click chart to enlarge. Chart courtesy of StockCharts.com.
Now two bearish candlestick patterns in a row, the second with support from volume, strongly suggest a trend change here to either down or sideways. The last Bearish Engulfing candlestick pattern has support from volume.
Volume and ATR are both declining as price rises from the last swing low in November 2029. This upwards movement so far has some weakness and looks likely to be a counter trend movement.
GDX DAILY CHART
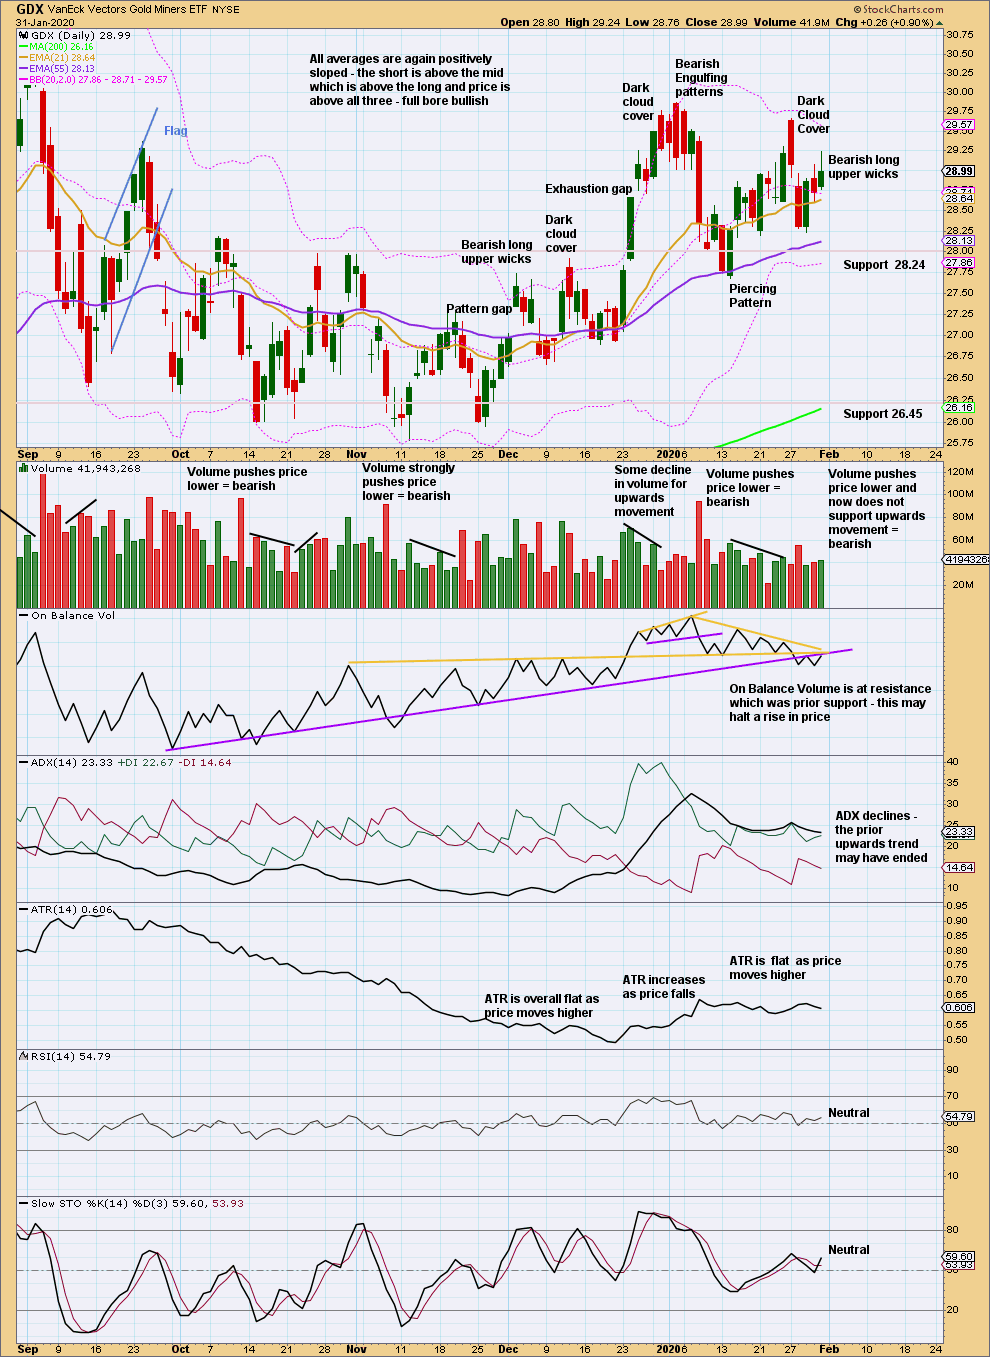
Click chart to enlarge. Chart courtesy of StockCharts.com.
A very strong bearish candlestick after an extreme upwards trend, along with closure of the last gap (now renamed an exhaustion gap) and now two bearish signals from On Balance Volume and volume supporting downwards movement and not upwards, strongly suggest GDX has found a high.
Again for the short term, GDX looks more clearly bearish than Gold.
US OIL
When both a bullish and a bearish Elliott wave count expect the same direction for the short term, then more confidence may be had in a short-term direction. This is what has happened for three weeks now for Oil. Downwards movement continues as expected and the next Elliott wave target remains the same.
Summary: Both the bullish and bearish Elliott wave counts expect downwards movement to continue next week. The target is now at 48.81.
MAIN ELLIOTT WAVE COUNT – BEARISH
MONTHLY CHART
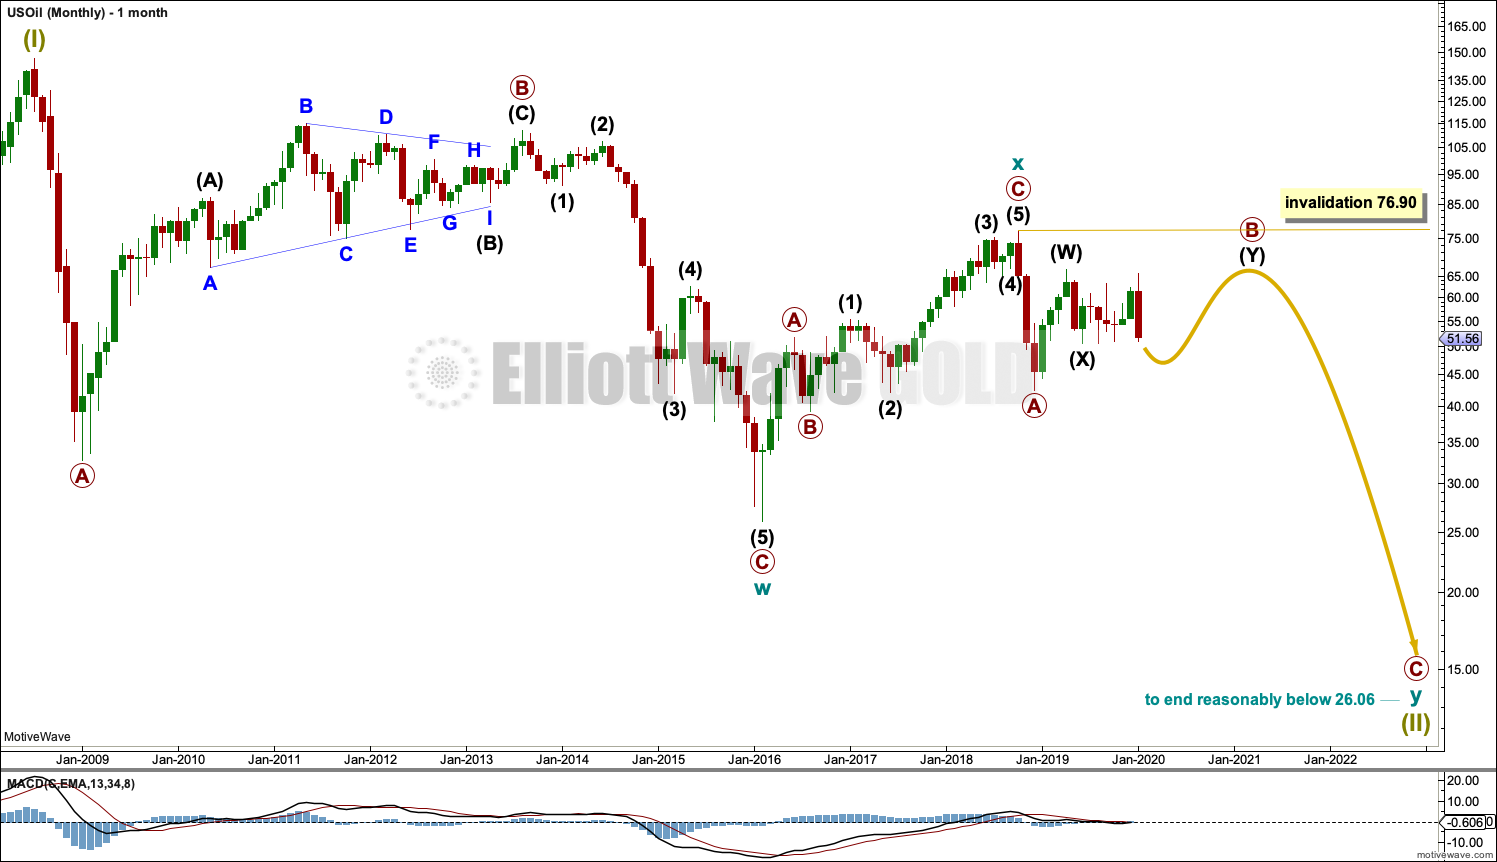
Click chart to enlarge.
The basic Elliott wave structure is five steps forward and three steps back. This Elliott wave count expects that US Oil is still within a three steps back pattern, which began in July 2008. The Elliott wave count expects that the bear market for US Oil continues.
This Elliott wave corrective structure is a double zigzag, which is a fairly common structure. The correction is labelled Super Cycle wave (II).
The first zigzag in the double is complete and labelled cycle wave w. The double is joined by a three in the opposite direction labelled cycle wave x, which subdivides as a zigzag. The second zigzag in the double may now have begun, labelled cycle wave y.
The purpose of a second zigzag in a double zigzag is to deepen the correction when the first zigzag does not move price deep enough. To achieve this purpose cycle wave y may be expected to move reasonably below the end of cycle wave w at 26.06. When primary wave B may be complete then the start of primary wave C may be known and a target may be calculated.
Cycle wave y is expected to subdivide as a zigzag, which subdivides 5-3-5.
Cycle wave w lasted 7.6 years and cycle wave x lasted 2.7 years. Cycle wave y may be expected to last possibly about a Fibonacci 5 or 8 years.
Primary wave B may not move beyond the start of primary wave A above 76.90.
WEEKLY CHART
Click chart to enlarge.
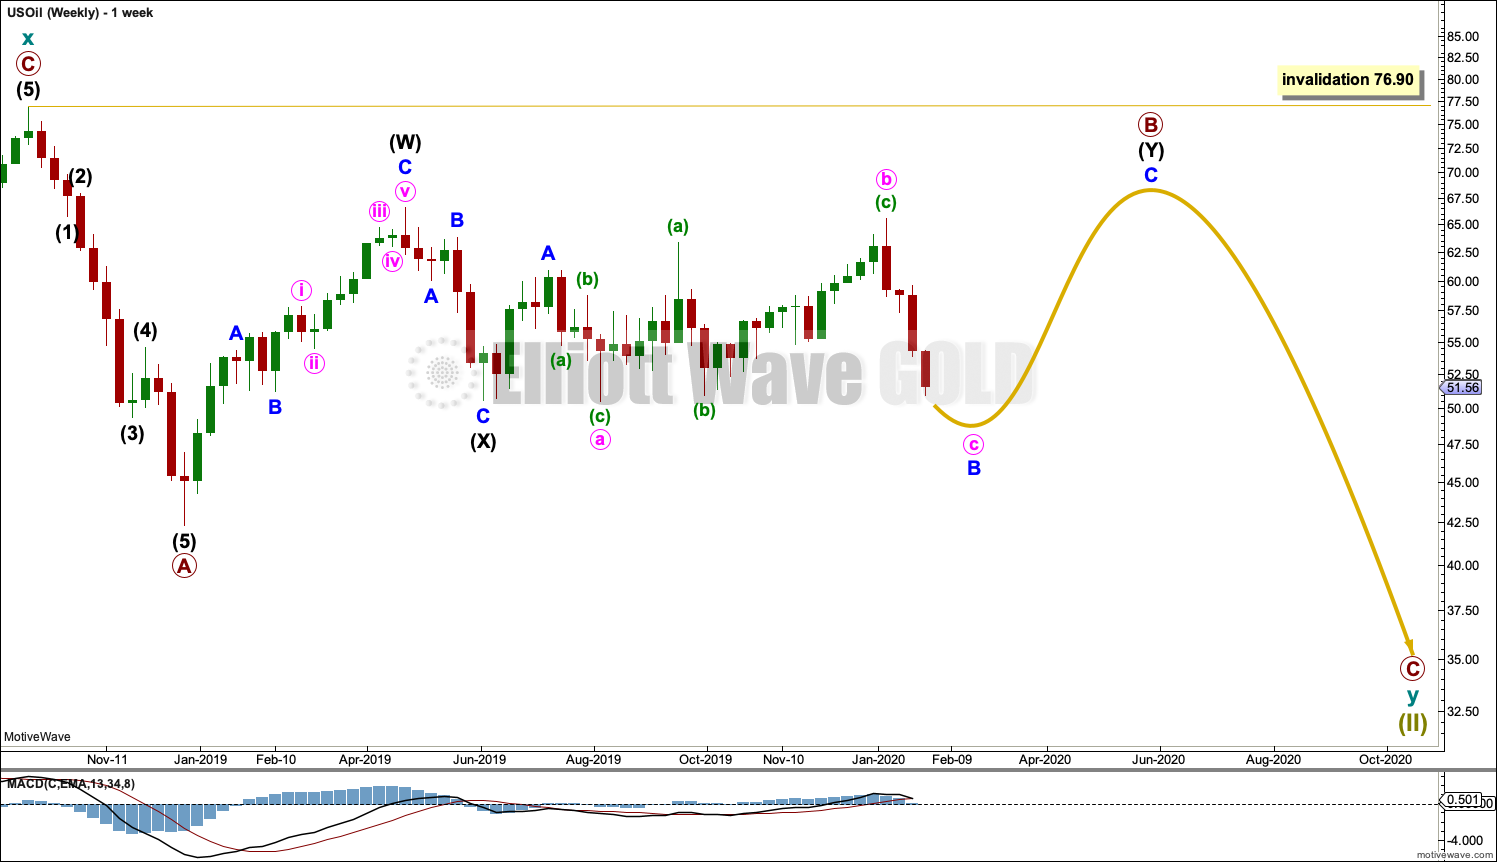
This weekly chart shows all of cycle wave y so far.
Cycle wave y is expected to subdivide as a zigzag. A zigzag subdivides 5-3-5. Primary wave A must subdivide as a five wave structure if this wave count is correct.
Primary wave A may be a complete five wave impulse at the last low.
Primary wave B may be a double combination: zigzag – X – flat. Intermediate wave (W) fits as a zigzag. Intermediate wave (Y) may be unfolding as a flat correction.
Within intermediate wave (Y), minor wave A may be complete. Minor wave B may be an incomplete expanded flat.
When primary wave B may be complete, then a downwards breakout would be expected for primary wave C.
Primary wave B may not move beyond the start of primary wave A above 76.90.
DAILY CHART
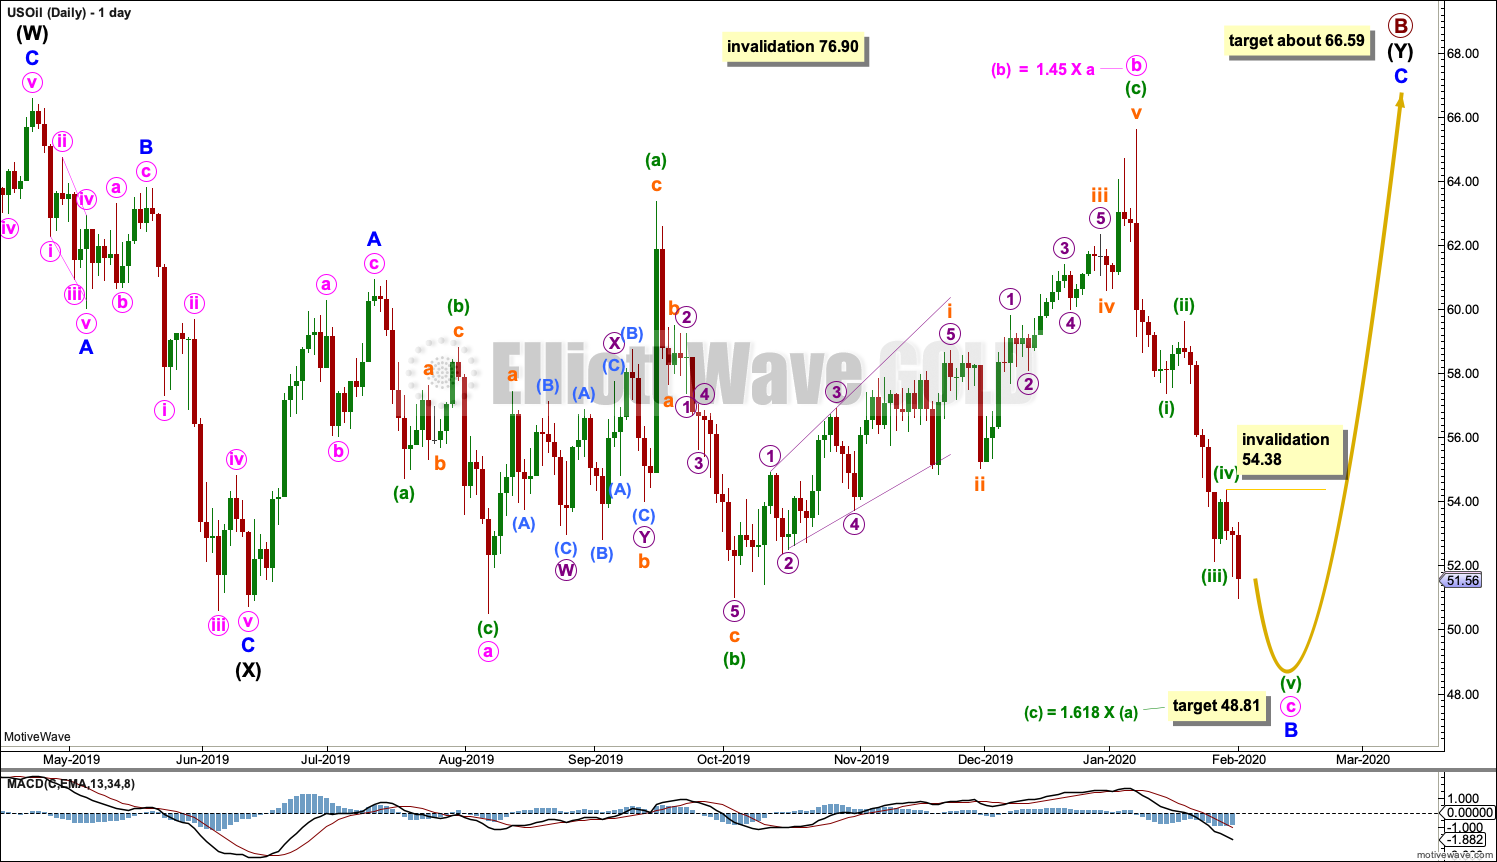
Click chart to enlarge.
This daily chart shows all of intermediate waves (X) and (Y).
Intermediate wave (Y) may be subdividing as a flat correction. Within the flat, minor wave A subdivides as a three and minor wave B may be an incomplete three. At its end, minor wave B must retrace a minimum 0.9 of minor wave A at 51.74. This minimum has now been met.
The analysis of minor wave B has changed. The new labelling has a better fit.
Minor wave B may be subdividing as an expanded flat. Within the expanded flat, both minute waves a and b may be complete and both subdivide as threes. Minute wave c should now continue lower as a five wave structure that would be very likely to make at least a slight new low below the end of minute wave a at 50.53 to avoid a truncation and a very rare running flat.
The target is recalculated. It is now the same for both wave counts. This target expects minute wave c to exhibit a common Fibonacci ratio to minute wave a.
When minor wave B may be complete, then minor wave C should move higher to end above the end of minor wave A at 60.93.
As soon as price makes at least a slight new low below 50.53, then minor wave B may be complete at any stage. A trend change may then occur and a new upwards swing may begin.
Within minuette wave (v), no second wave correction may move beyond its start above 54.38. After a new low below 50.53, then a new high above 54.38 would indicate the downwards swing is over and a new upwards swing has begun.
ALTERNATE ELLIOTT WAVE COUNT
MONTHLY CHART
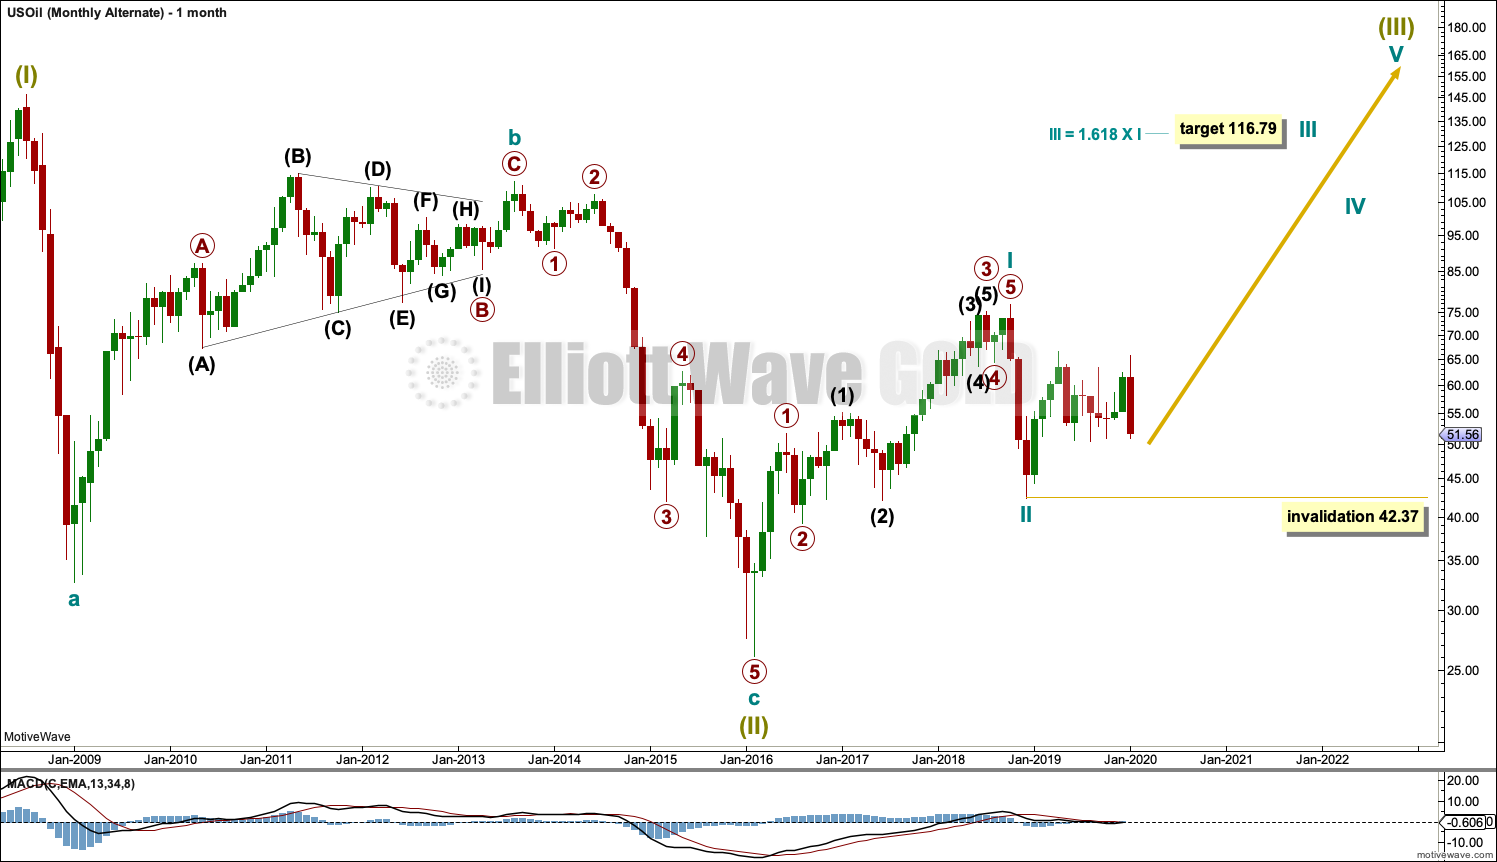
Click chart to enlarge.
It is possible that the bear market is over for Oil and a new bull market has begun.
For a bullish wave count for Oil, the upwards wave from the major low at 26.06 in February 2016 must be seen as a complete five wave impulse. This is labelled cycle wave I.
Cycle wave II may be a complete zigzag at 0.679 the depth of cycle wave I.
A target is calculated for cycle wave III to reach a common Fibonacci ratio to cycle wave I.
Within cycle wave III, no second wave correction may move beyond the start of its first wave below 42.37.
WEEKLY CHART
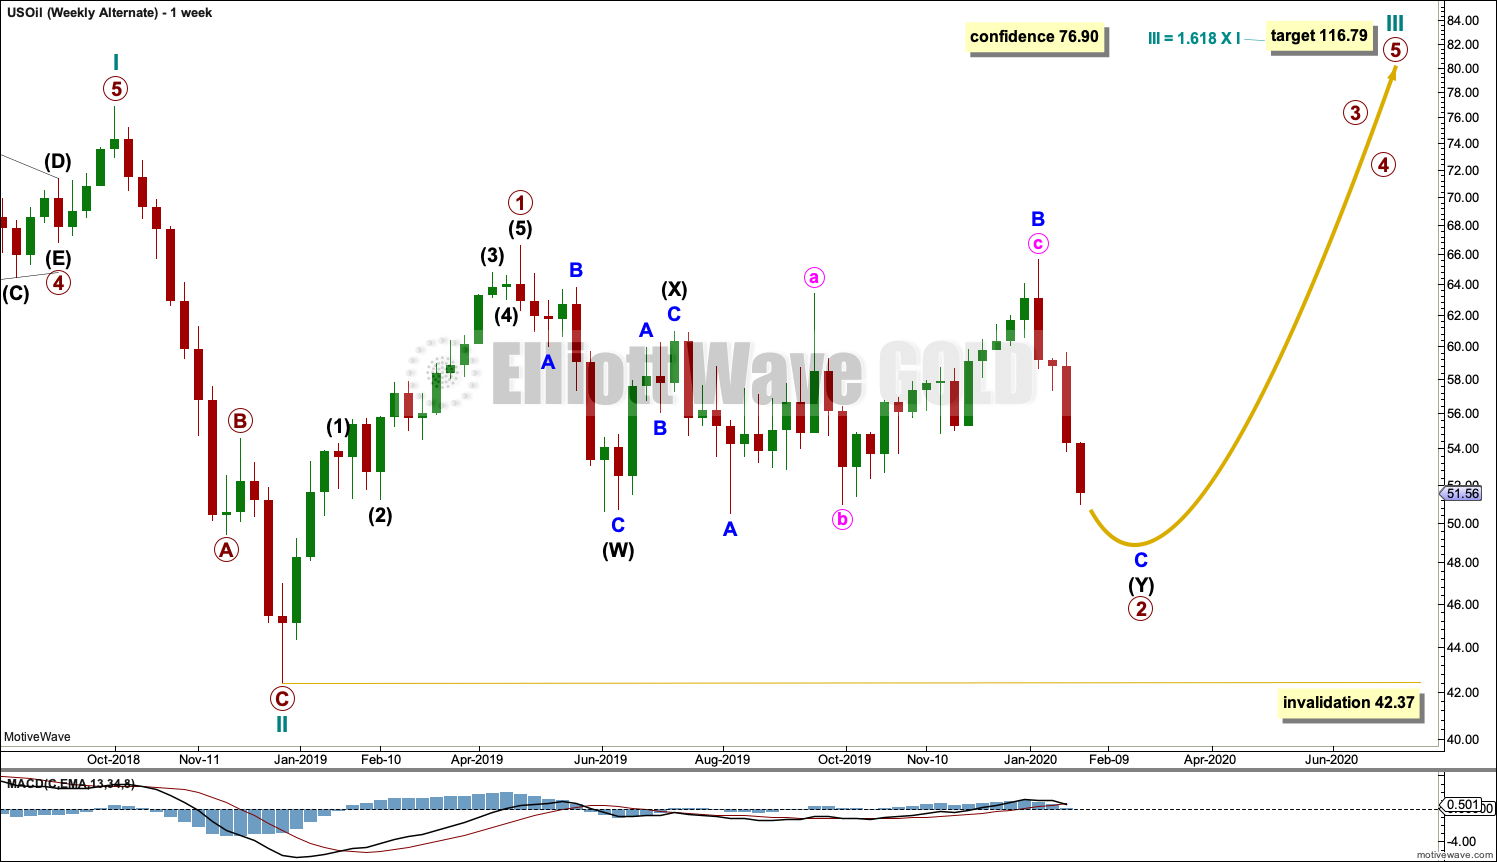
Click chart to enlarge.
Cycle wave II does look best as a three. This is the only part of this wave count that has a better look than the main wave count, which sees this downwards wave as a five.
The upwards wave of primary wave 1 within cycle wave III must be seen as a five wave structure for a bullish wave count to work. This movement at lower time frames does not subdivide well as a five; this reduces the probability of this wave count.
Cycle wave III may only subdivide as an impulse. Within cycle wave III, so far primary wave 1 may be complete. Primary wave 2 may be moving sideways as a double combination. Primary wave 2 may not move beyond the start of primary wave 1 below 42.37.
Primary wave 2 may be continuing as a double combination.
The first structure in the double would be complete, a zigzag labelled intermediate wave (W). Within intermediate wave (W), minor wave C ends with a slight truncation for minute wave v. This is acceptable.
The double may be now joined by a complete three in the opposite direction, a zigzag labelled intermediate wave (X).
Intermediate wave (Y) may now be completing as an expanded flat correction.
DAILY CHART
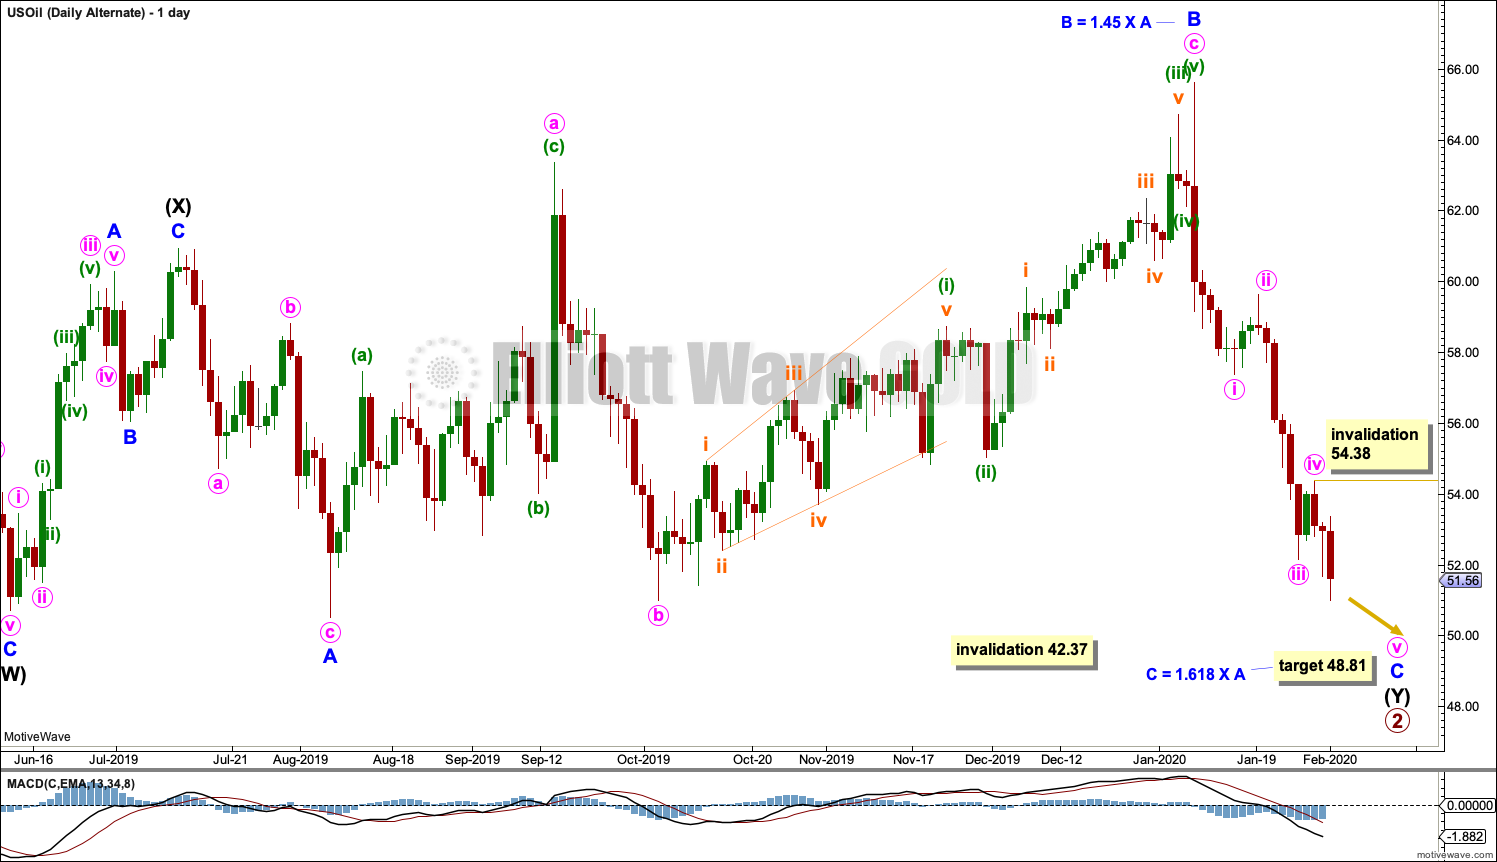
Click chart to enlarge.
Intermediate wave (Y) may be unfolding as an expanded flat correction. Within the expanded flat, minor wave A subdivides as a three and minor wave B may now be a complete three that is just beyond the normal range of 1 to 1.38 times the length of minor wave A. This is still acceptable. The wave count remains valid.
A target is calculated for minor wave C that expects a common Fibonacci ratio to minor wave A. Minor wave C would be likely to make at least a slight new low below the end of minor wave A at 50.53 to avoid a truncation and a very rare running flat.
Minor wave C must subdivide as a five wave structure, most likely an impulse. Within the impulse, minute waves i through to iv may now be complete. Within minute wave v, no second wave correction may move beyond its start above 54.38.
Primary wave 2 may not move beyond the start of primary wave 1 below 42.37.
TECHNICAL ANALYSIS
MONTHLY CHART
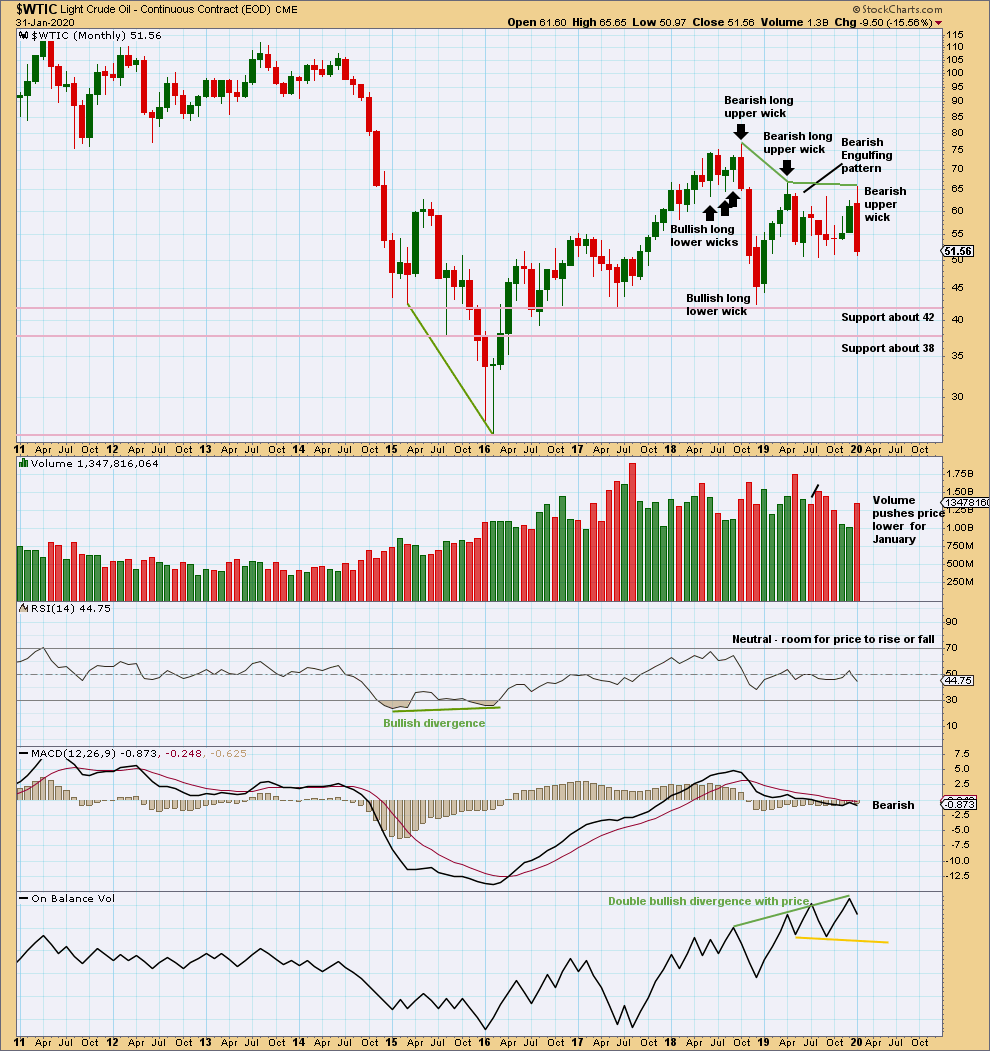
Click chart to enlarge. Chart courtesy of StockCharts.com.
There is now double bullish divergence between price and On Balance Volume. This supports the alternate Elliott wave count.
Overall, price has been moving sideways for a few months now. Within this sideways movement, the downwards month of May has greatest range and volume; this supports the main Elliott wave count. Upwards movement for December lacks support from volume. Now downwards movement for January exhibits increased range and support from volume. The volume profile remains bearish; this supports the main Elliott wave count.
WEEKLY CHART
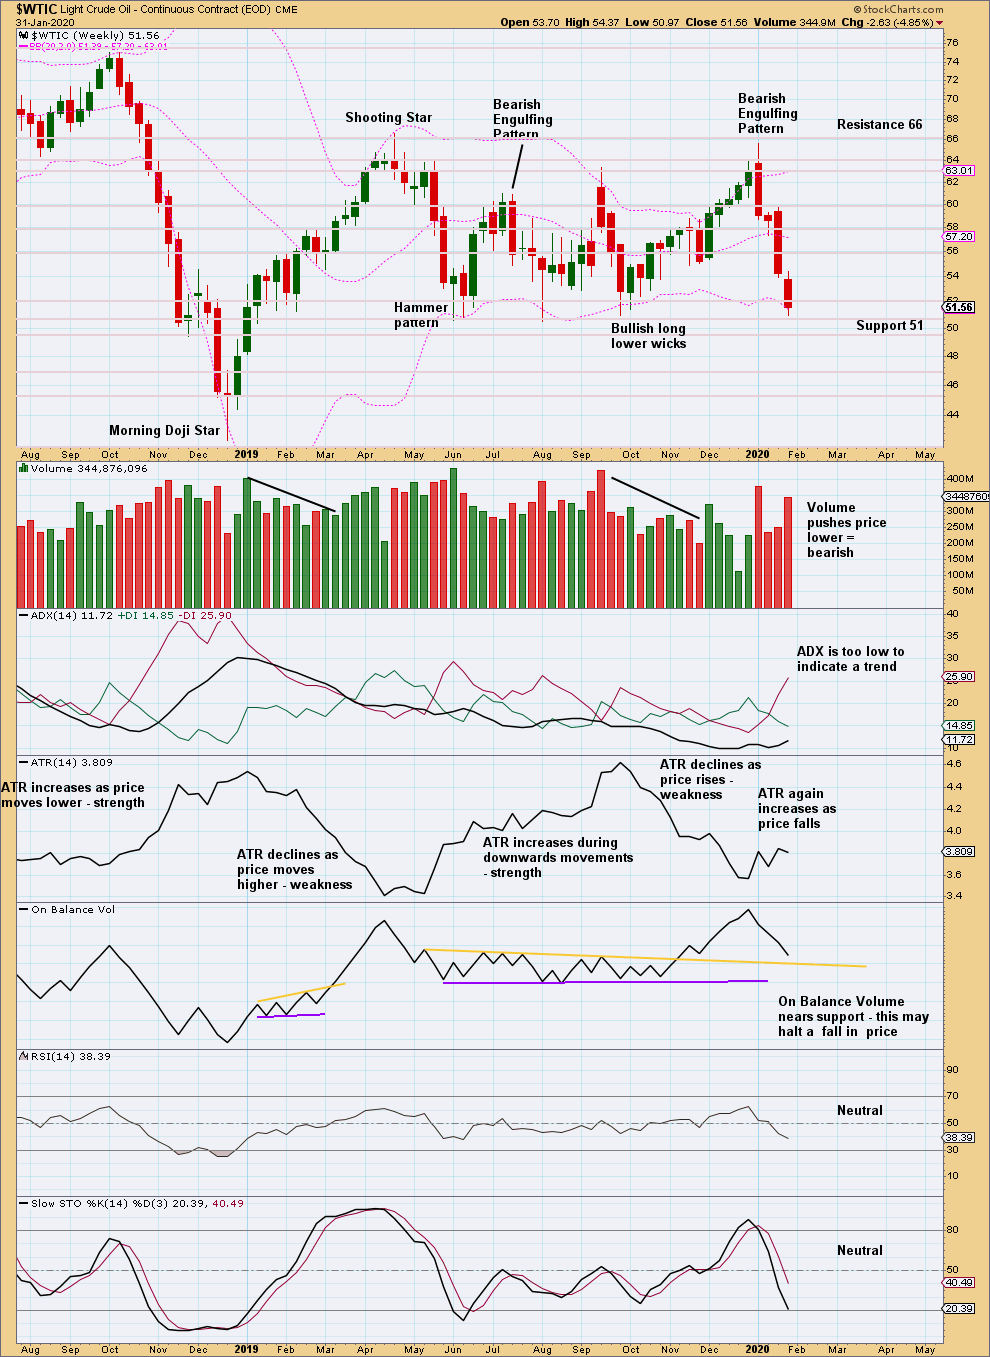
Click chart to enlarge. Chart courtesy of StockCharts.com.
Price is consolidating, swinging from support to resistance and back again. Support is about 51 and resistance is about 66. Currently, a downwards swing is now at support at 51. Next support below is about 50. Stochastics is not yet oversold, but it is close. Look for downwards movement to end when Stochastics reaches oversold; this may be in one more downwards week.
Volume is pushing price lower this week. This suggests another downwards week next week.
When price consolidates, each swing is normally very choppy and overlapping. Do not expect price to move in a straight line.
DAILY CHART
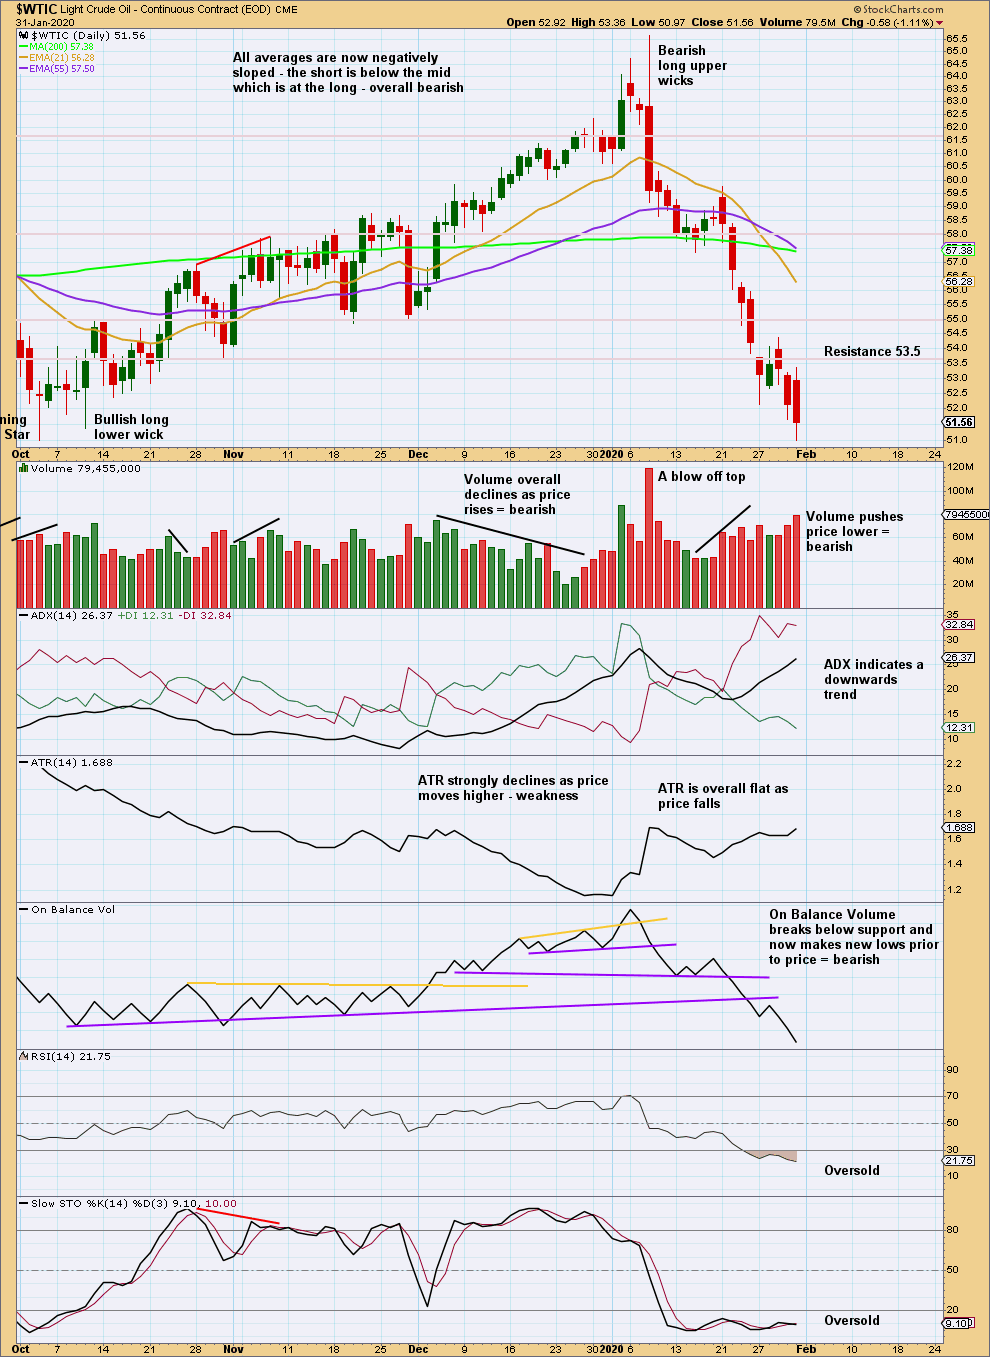
Click chart to enlarge. Chart courtesy of StockCharts.com.
The weekly time frame is best to view the larger consolidation. This daily time frame focusses more on each swing within the larger consolidation.
At this time frame, the downwards swing is a downwards trend. The trend is not extreme although RSI and Stochastics are oversold. With volume pushing price lower, expect downwards movement to continue for at least a few more days.
—
Always practice good risk management as the most important aspect of trading. Always trade with stops and invest only 1-5% of equity on any one trade. Failure to manage risk is the most common mistake new traders make.
Lara
Wondering if you could comment on S&P before Saturday. Is your opinion that this is b wave of minor 4 or did we already begin minor 5.
Thanks
Rich
There is not much strength up off this low, there are neither 90% nor 80% upwards days.
Volume today does not support upwards movement, there is bearish divergence between price and the AD line failing to make new highs, and today breadth declined as price moved higher.
All this suggests the upwards movement is weak, and so my main count will label this minute wave b of minor 4. That expects a downwards wave from here for minute c to end below 3,214.68, or sideways movement for another week or so if a triangle or combination forms.
Alternatively, it is possible that minor 4 was over at the low on 31st Jan. Momentum does support this view.
I would judge the main count to have about a 70% probability, with the alternate idea 30%.
I am sorry that I cannot be certain, but then no one ever really can be with a prediction of what price will do next.
And I understand that its not a certainty. Just like you say its a matter of probabilities.
Thanks
Lara
I wonder if you could elaborate a bit on one of the indicators you were looking for on a sustainable low in place for the S&P. I believe you said you would be looking for downward movement on price as RSI reaches oversold and then we might see bullish divergence between lows in price and lows in RSI. You kind of stumbled a bit there so it wasn’t clear to me what we should be looking for. Any additional guidance would be appreciated.
Thanks
Rich
When RSI reaches into oversold and then the next low in price sees a lower low in price but a higher low in RSI, that is often (not always) an indicator of a sustainable low in place.
Thank you Lara, just subscribed!
Welcome!