
US OIL: Elliott Wave and Technical Analysis | Charts – December 6, 2019
The first daily chart expected an Elliott wave triangle may be unfolding. It is possible now that the structure may be complete. A breakout may happen next week.
Summary: The triangle may be complete. A downwards breakout may occur next week or soon after.
The bullish wave count now also expects a triangle to complete before an upwards breakout.
MAIN ELLIOTT WAVE COUNT – BEARISH
MONTHLY CHART
Click chart to enlarge.
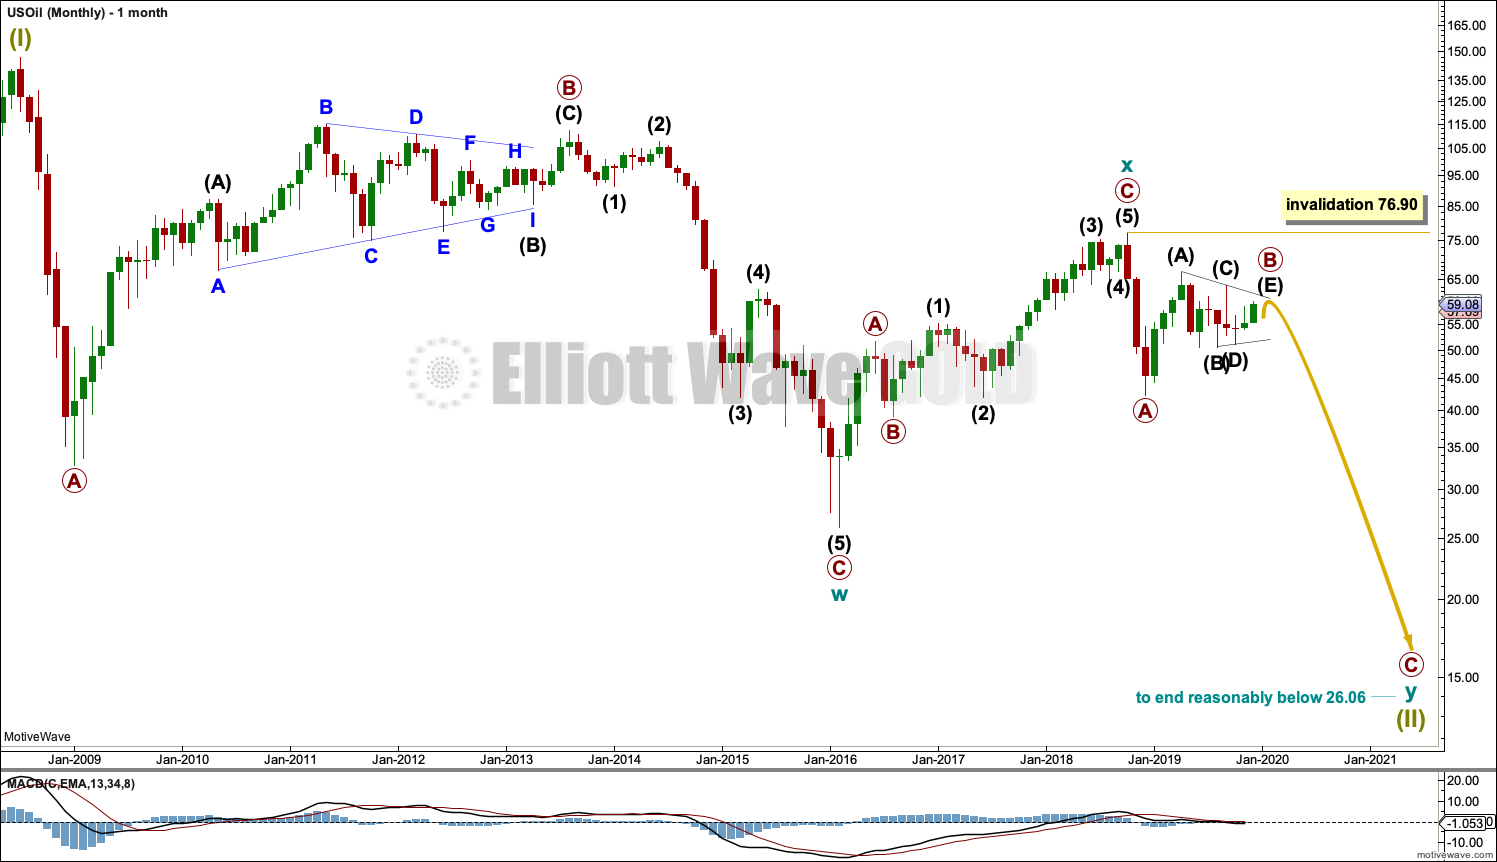
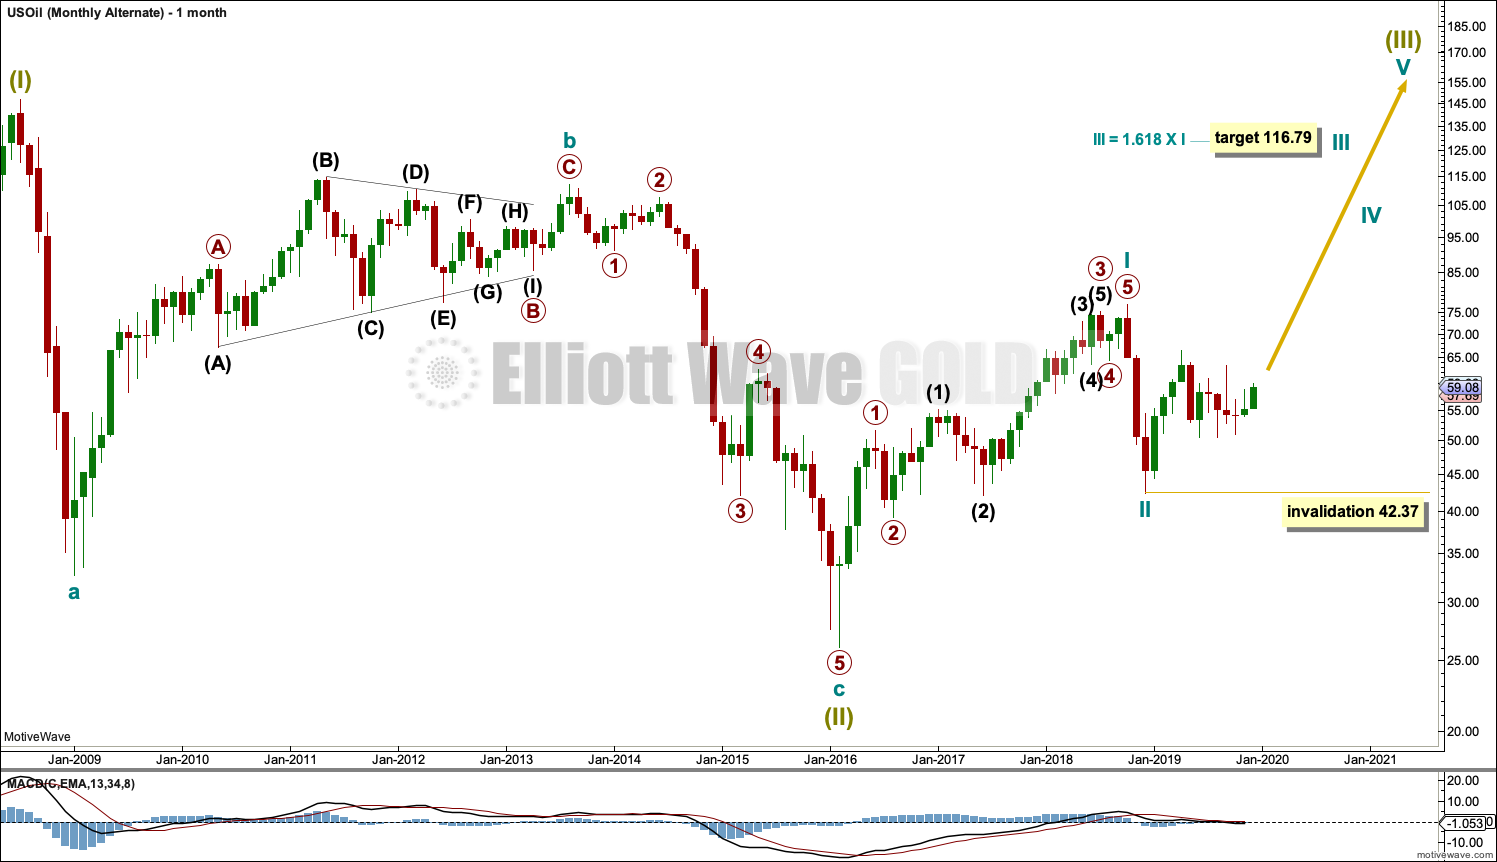
The basic Elliott wave structure is five steps forward and three steps back. This Elliott wave count expects that US Oil is still within a three steps back pattern, which began in July 2008. The Elliott wave count expects that the bear market for US Oil continues.
This Elliott wave corrective structure is a double zigzag, which is a fairly common structure. The correction is labelled Super Cycle wave (II).
The first zigzag in the double is complete and labelled cycle wave w. The double is joined by a three in the opposite direction labelled cycle wave x, which subdivides as a zigzag. The second zigzag in the double may now have begun, labelled cycle wave y.
The purpose of a second zigzag in a double zigzag is to deepen the correction when the first zigzag does not move price deep enough. To achieve this purpose cycle wave y may be expected to move reasonably below the end of cycle wave w at 26.06. When primary wave B may be complete then the start of primary wave C may be known and a target may be calculated.
Cycle wave y is expected to subdivide as a zigzag, which subdivides 5-3-5.
Cycle wave w lasted 7.6 years and cycle wave x lasted 2.7 years. Cycle wave y may be expected to last possibly about a Fibonacci 5 or 8 years.
Primary wave B may not move beyond the start of primary wave A above 76.90.
WEEKLY CHART
Click chart to enlarge.
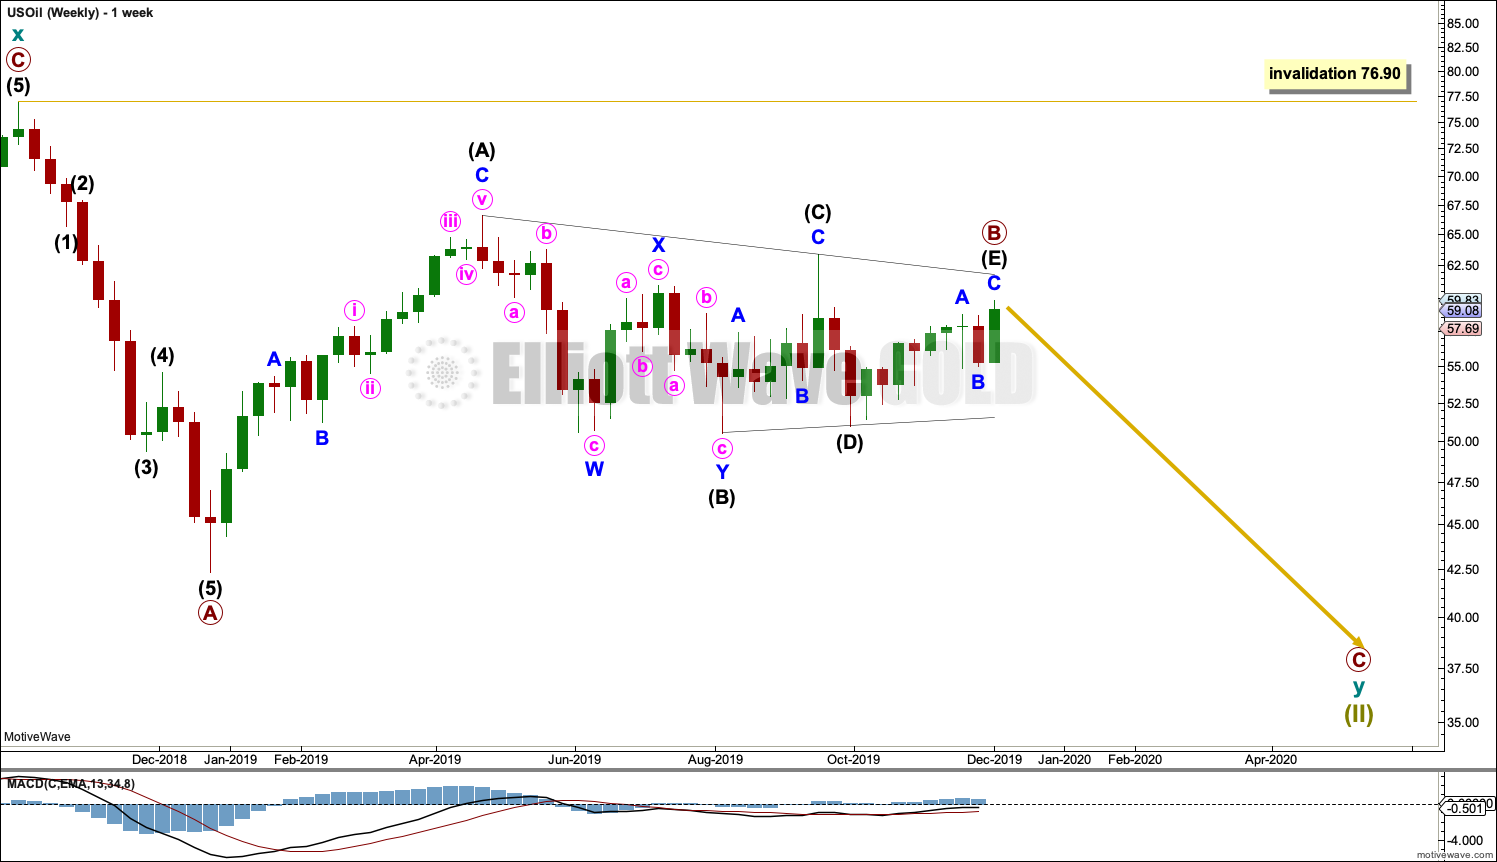
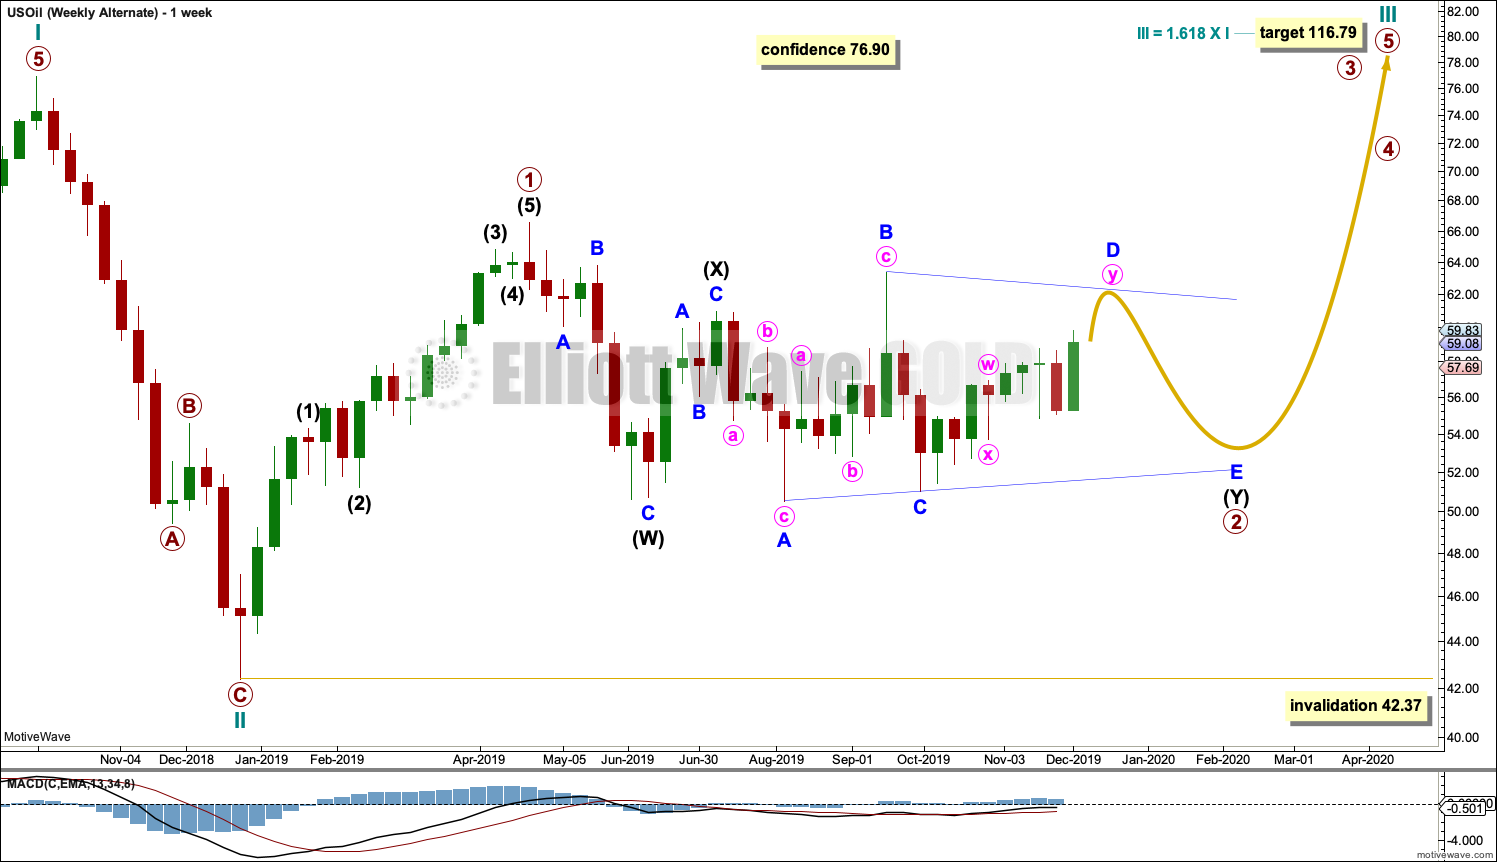
This weekly chart shows all of cycle wave y so far.
Cycle wave y is expected to subdivide as a zigzag. A zigzag subdivides 5-3-5. Primary wave A must subdivide as a five wave structure if this wave count is correct.
Primary wave A may be a complete five wave impulse at the last low.
Primary wave B may now be a complete triangle or may continue further sideways as a combination. Both ideas are outlined in daily charts below, and a triangle is labelled on the weekly chart.
When primary wave B may be complete, then a downwards breakout would be expected for primary wave C.
Primary wave B may not move beyond the start of primary wave A above 76.90.
DAILY CHART
Click chart to enlarge.
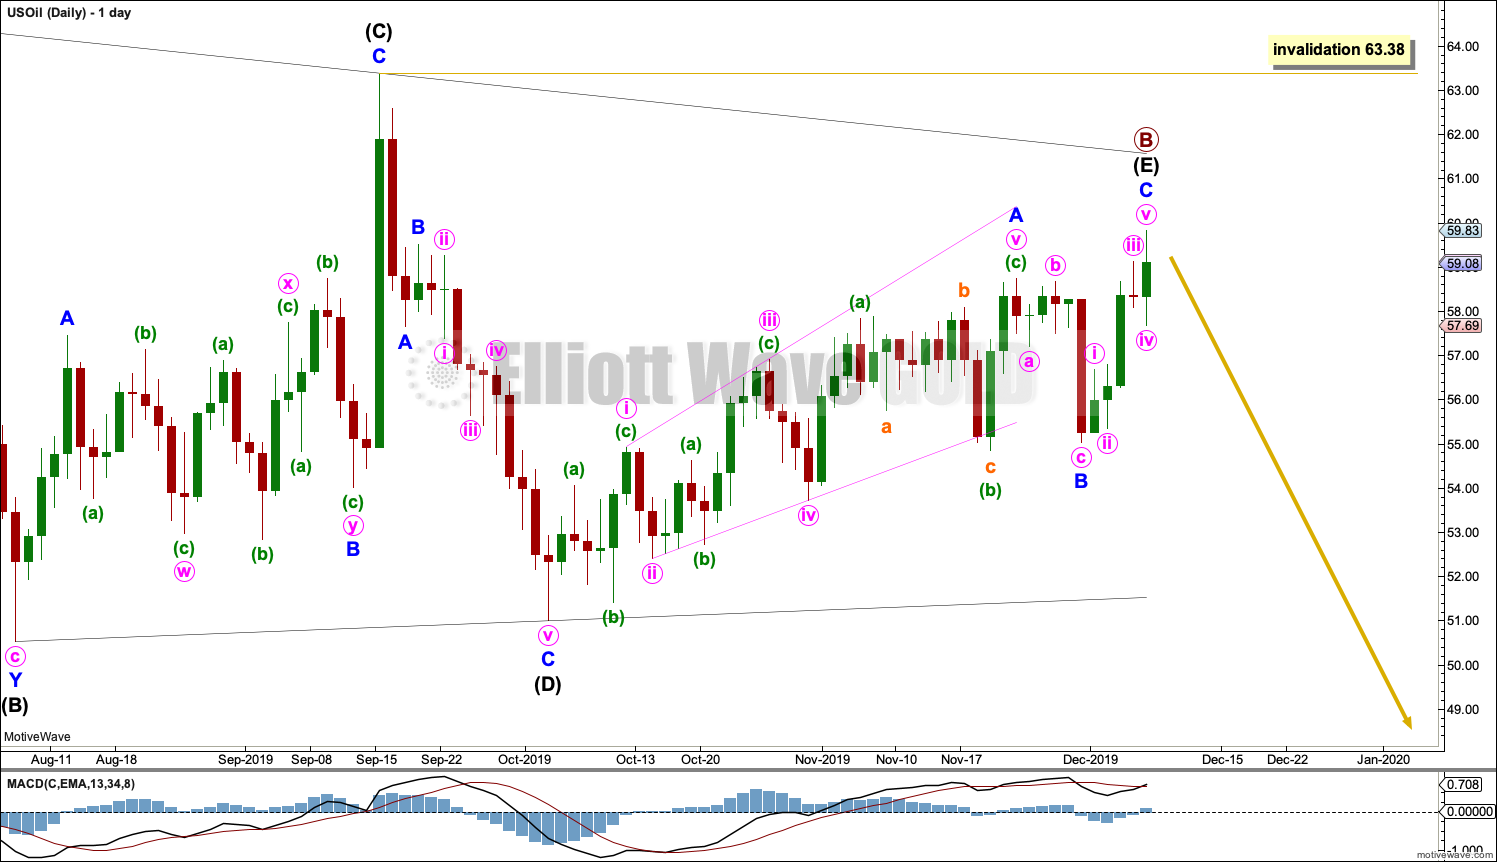
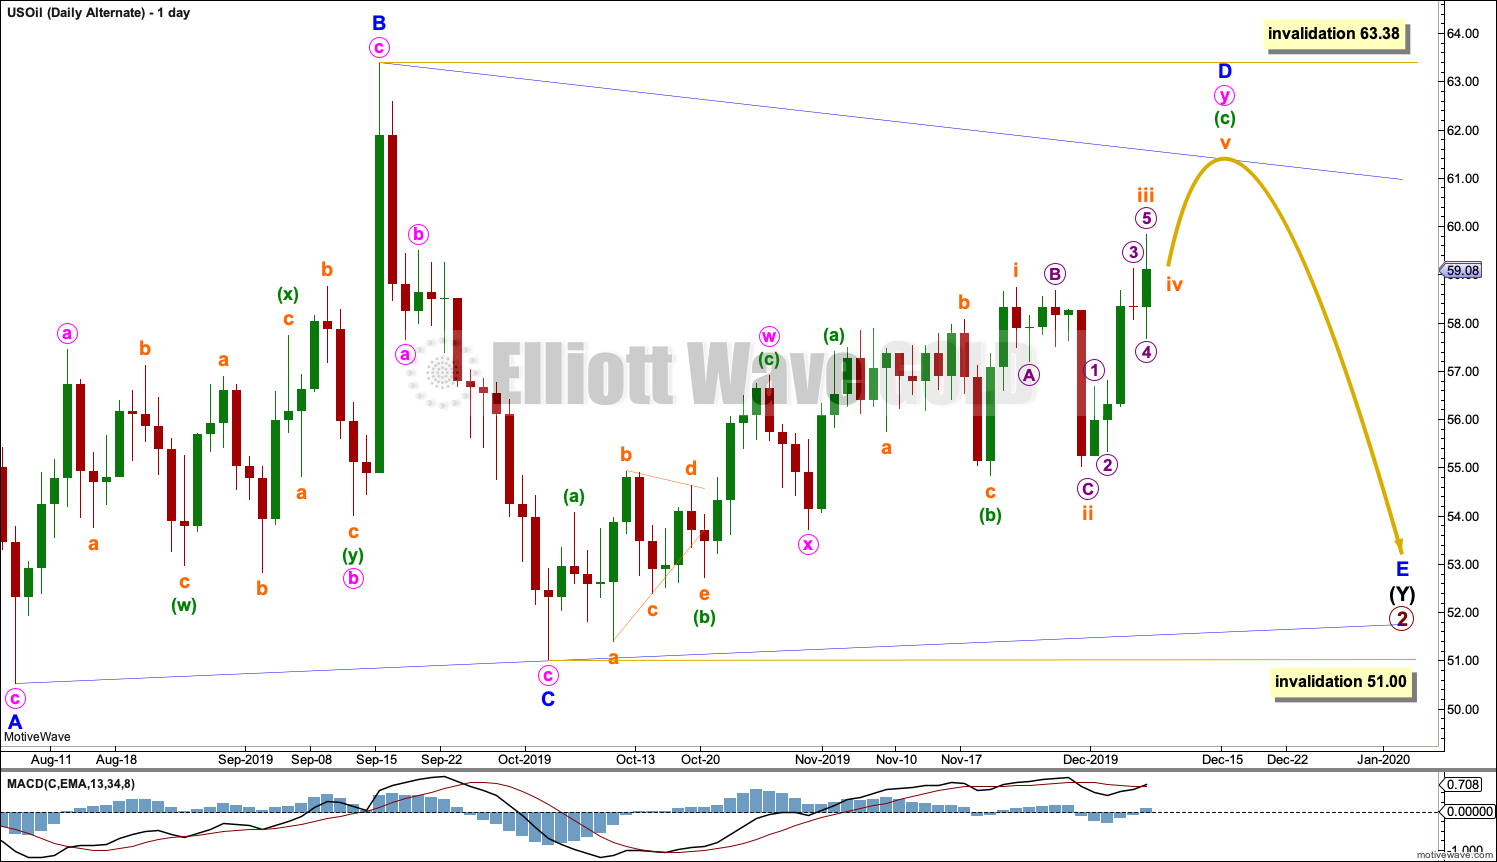
This daily chart will now show movement within the triangle from the low of the 7th of August 2019, labelled intermediate wave (B).
Note that monthly and weekly charts are on a semi-log scale, but the daily charts are on an arithmetic scale. This makes a slight difference to trend channels.
Elliott wave triangles are always continuation patterns. When primary wave B is complete, then a downwards breakout would be expected for primary wave C.
This chart considers a triangle for primary wave B. The triangle may be a regular contracting triangle.
Intermediate wave (E) may now be a complete zigzag. The most common point for E waves of Elliott wave triangles to end is falling a little short of the A-C trend line. If intermediate wave (E) ends here, it would have a typical look.
It is also possible that minor wave C may continue higher. Intermediate wave (E) may not move beyond the end of intermediate wave (C) above 63.38.
DAILY CHART II
Click chart to enlarge.
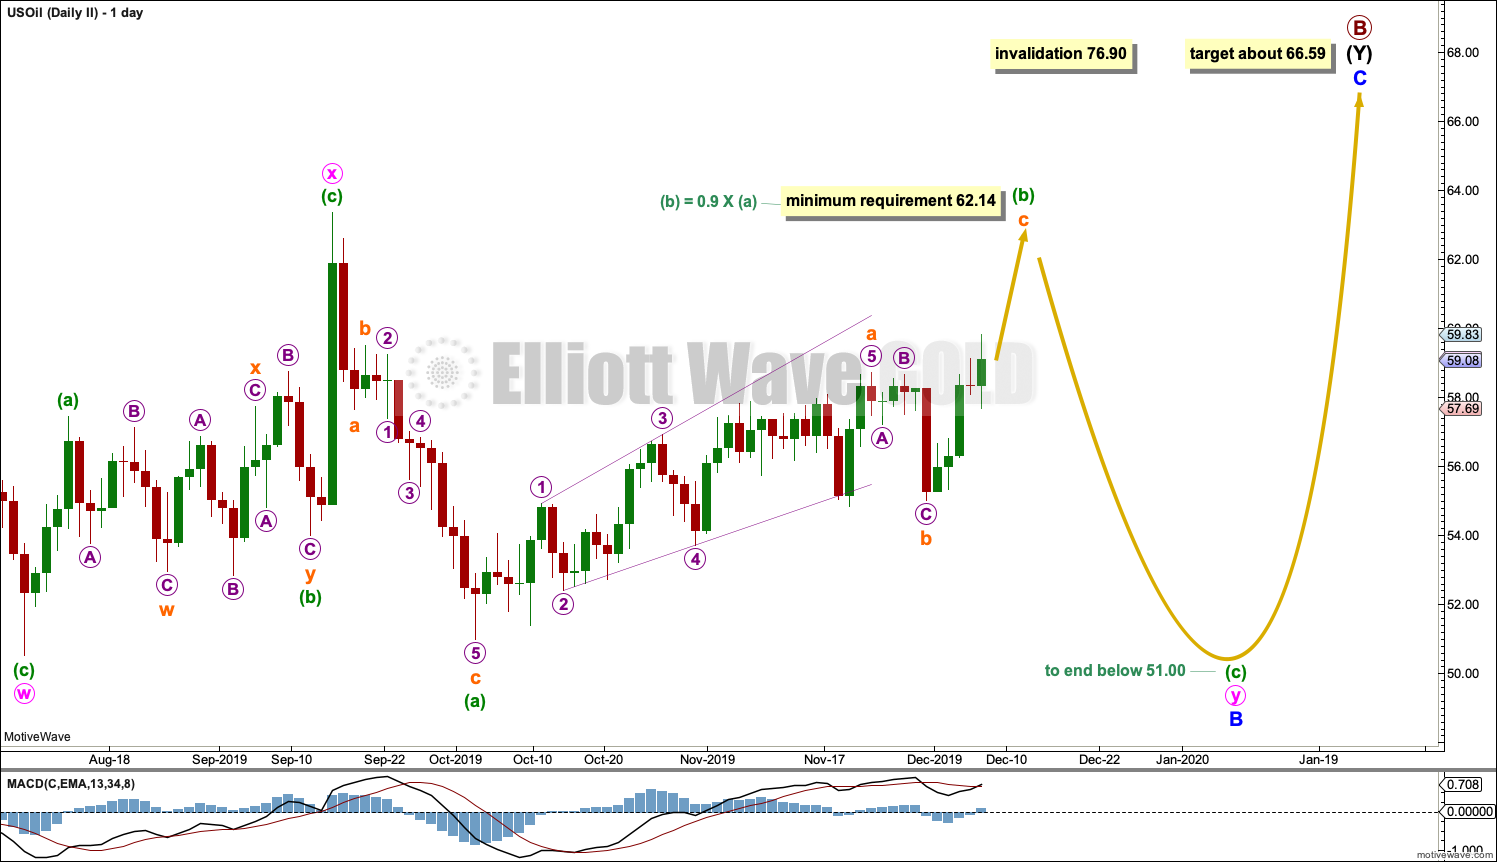
This daily chart begins from the end of minute wave w.
When an Elliott wave triangle is considered, it is essential that alternates are also considered. Too many times an Elliott wave triangle may look to be completing only for the structure to be invalidated; the correction turns out to be something else, and the something else is almost always a combination.
Primary wave B may be a double combination: zigzag – X – flat. Intermediate wave (W) fits as a zigzag. Intermediate wave (Y) may be unfolding as a flat correction.
Within intermediate wave (Y), minor wave A may be complete. Minor wave B may be an incomplete double combination.
Within minor wave B, minute wave w may be a complete zigzag. Minute wave x may join the double in the opposite direction as a zigzag. Minute wave y may now continue as a flat correction.
Within minute wave y, minuette wave (b) must subdivide as a corrective structure and must retrace a minimum 0.9 length of minuette wave (a) at 62.14 or higher.
When minuette wave (b) has met the minimum requirement and may be a complete corrective structure, then minuette wave (c) may begin and unfold lower to end below the end of minuette wave (a) at 51.00 to avoid a truncation.
The purpose of double combinations is to take up time and move price sideways. To achieve this purpose the second structure in the double usually ends about the same level as the first.
ALTERNATE ELLIOTT WAVE COUNT
MONTHLY CHART
Click chart to enlarge.
It is possible that the bear market is over for Oil and a new bull market has begun.
For a bullish wave count for Oil, the upwards wave from the major low at 26.06 in February 2016 must be seen as a complete five wave impulse. This is labelled cycle wave I.
Cycle wave II may be a complete zigzag at 0.679 the depth of cycle wave I.
A target is calculated for cycle wave III to reach a common Fibonacci ratio to cycle wave I.
Within cycle wave III, no second wave correction may move beyond the start of its first wave below 42.37.
WEEKLY CHART
Click chart to enlarge.
This weekly chart shows detail of cycle wave I as a five wave impulse.
Cycle wave II does look best as a three. This is the only part of this wave count that has a better look than the main wave count, which sees this downwards wave as a five.
The upwards wave of primary wave 1 within cycle wave III must be seen as a five wave structure for a bullish wave count to work. This movement at lower time frames does not subdivide well as a five; this reduces the probability of this wave count.
Cycle wave III may only subdivide as an impulse. Within cycle wave III, so far primary wave 1 may be complete. Primary wave 2 may be moving sideways as a double combination. Primary wave 2 may not move beyond the start of primary wave 1 below 42.37.
DAILY CHART
Click chart to enlarge.
This daily chart begins from the end of minor wave A.
Primary wave 2 may be continuing as a double combination.
The first structure in the double would be complete, a zigzag labelled intermediate wave (W). Within intermediate wave (W), minor wave C ends with a slight truncation for minute wave v. This is acceptable.
The double may be now joined by a complete three in the opposite direction, a zigzag labelled intermediate wave (X).
Intermediate wave (Y) may now be completing as a running contracting or barrier triangle.
Within the triangle of intermediate wave (Y), minor waves A, B and C may be complete.
Within a contracting triangle, minor wave D may not move beyond the end of minor wave B above 63.38.
Within a barrier triangle, minor wave D should end about the same level as minor wave B at 63.38, so that the B-D trend line looks essentially flat. In practice this means minor wave D may end very slightly above the end of minor wave B and the triangle may remain valid.
Minor wave D may be subdividing as a double zigzag. One of the five sub-waves of a triangle normally subdivides as a more complicated multiple; wave D is the most likely to do so. The structure of minor wave D at this stage for this wave count looks incomplete. It should move higher.
Finally, for both a contracting and barrier triangle, minor wave E may not move beyond the end of minor wave C below 51.00.
Primary wave 2 may not move beyond the start of primary wave 1 below 42.37.
When the structure of primary wave 2 may be complete for this bullish wave count, then an upwards breakout would be expected.
TECHNICAL ANALYSIS
MONTHLY CHART
Click chart to enlarge. Chart courtesy of StockCharts.com.
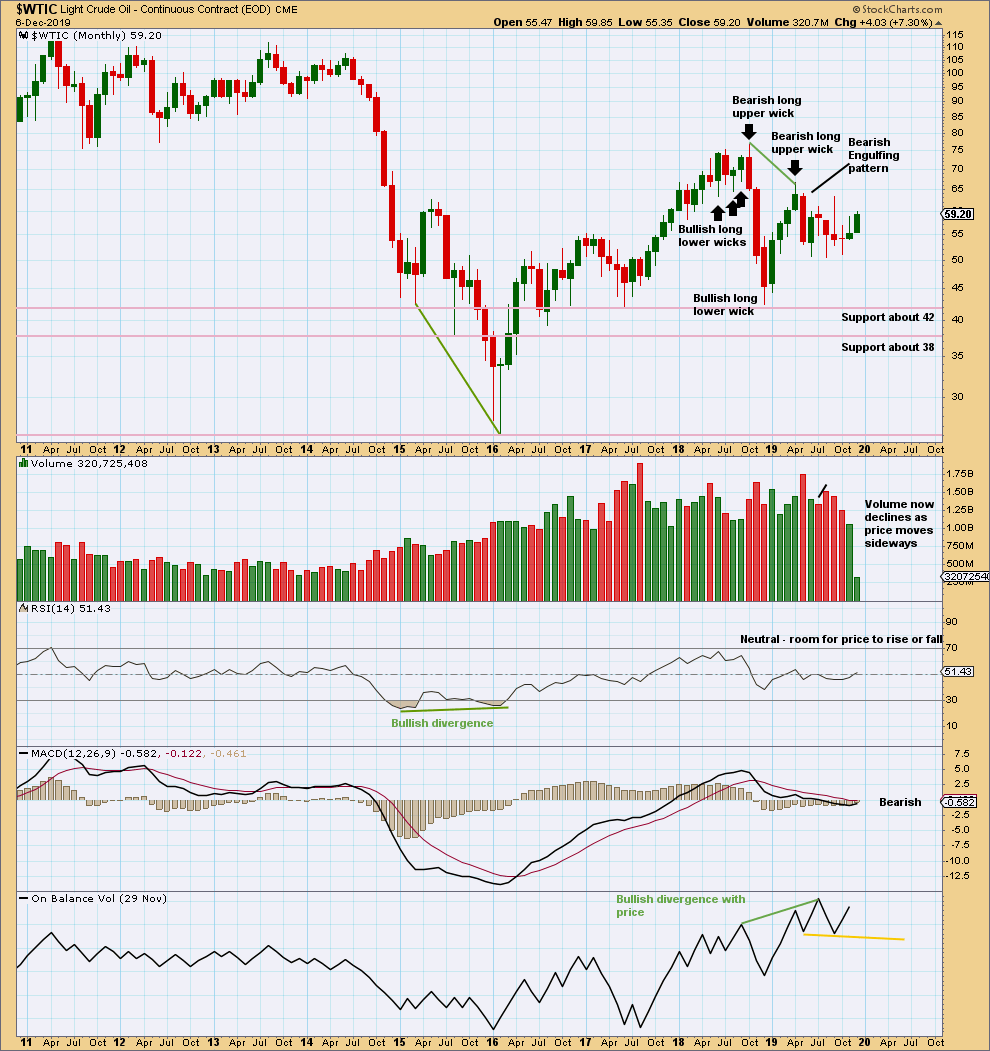
There is now double bullish divergence between price and On Balance Volume. This supports the alternate Elliott wave count.
Overall, price has been moving sideways for a few months now. Within this sideways movement, the downwards month of May has greatest range and volume; this supports the main Elliott wave count.
WEEKLY CHART
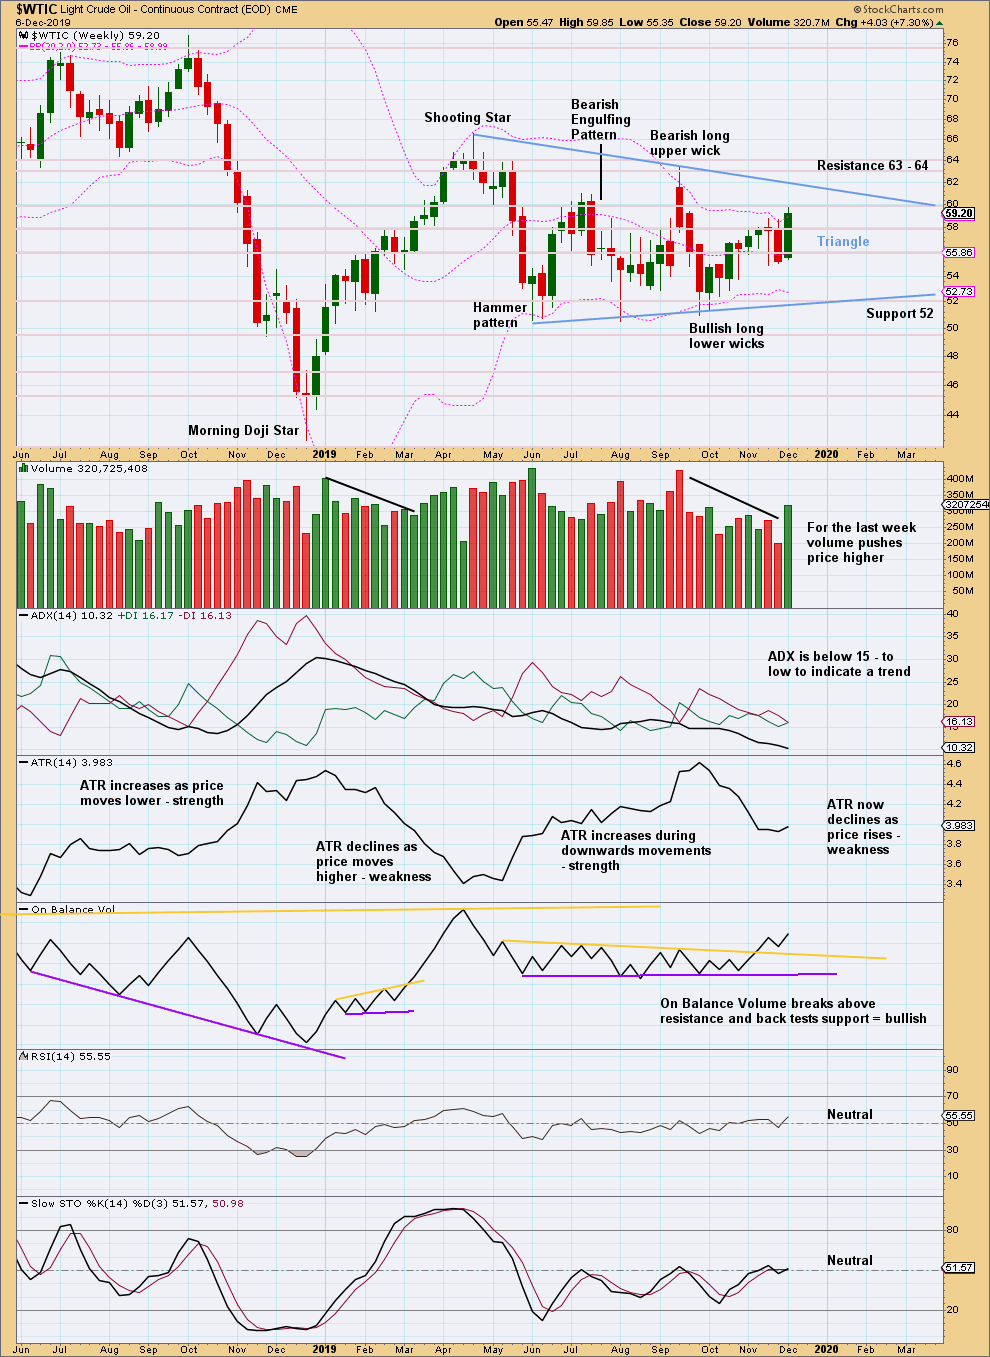
Click chart to enlarge. Chart courtesy of StockCharts.com.
A large triangle may be unfolding. Classic triangles may be either continuation or reversal patterns. A breakout is required before they may be acted on and a target may be calculated. This week a bullish signal from On Balance Volume suggests the breakout may be upwards.
DAILY CHART
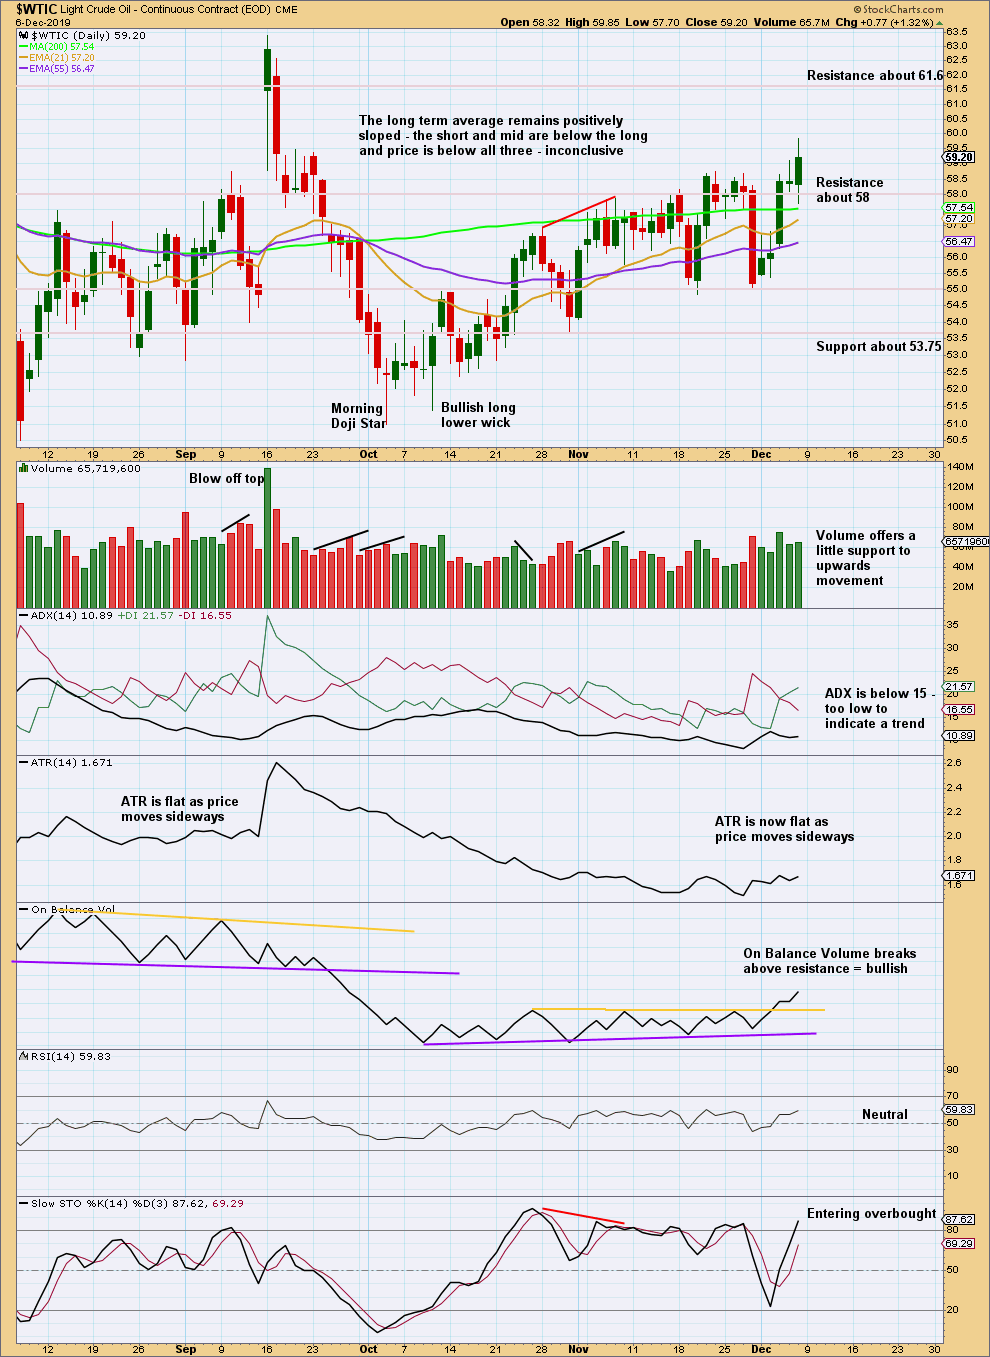
Click chart to enlarge. Chart courtesy of StockCharts.com.
Price remains range bound. There is no clear trend. A bullish signal from On Balance Volume suggests the breakout may be upwards.
Published @ 06:44 p.m. EST.
—
Careful risk management protects your trading account(s).
Follow my two Golden Rules:
1. Always trade with stops.
2. Risk only 1-5% of equity on any one trade.
—
New updates to this analysis are in bold.
0 Comments