
US OIL: Elliott Wave and Technical Analysis | Charts – January 31, 2020
When both a bullish and a bearish Elliott wave count expect the same direction for the short term, then more confidence may be had in a short-term direction. This is what has happened for three weeks now for Oil. Downwards movement continues as expected and the next Elliott wave target remains the same.
Summary: Both the bullish and bearish Elliott wave counts expect downwards movement to continue next week. The target is now at 48.81.
MAIN ELLIOTT WAVE COUNT – BEARISH
MONTHLY CHART
Click chart to enlarge.
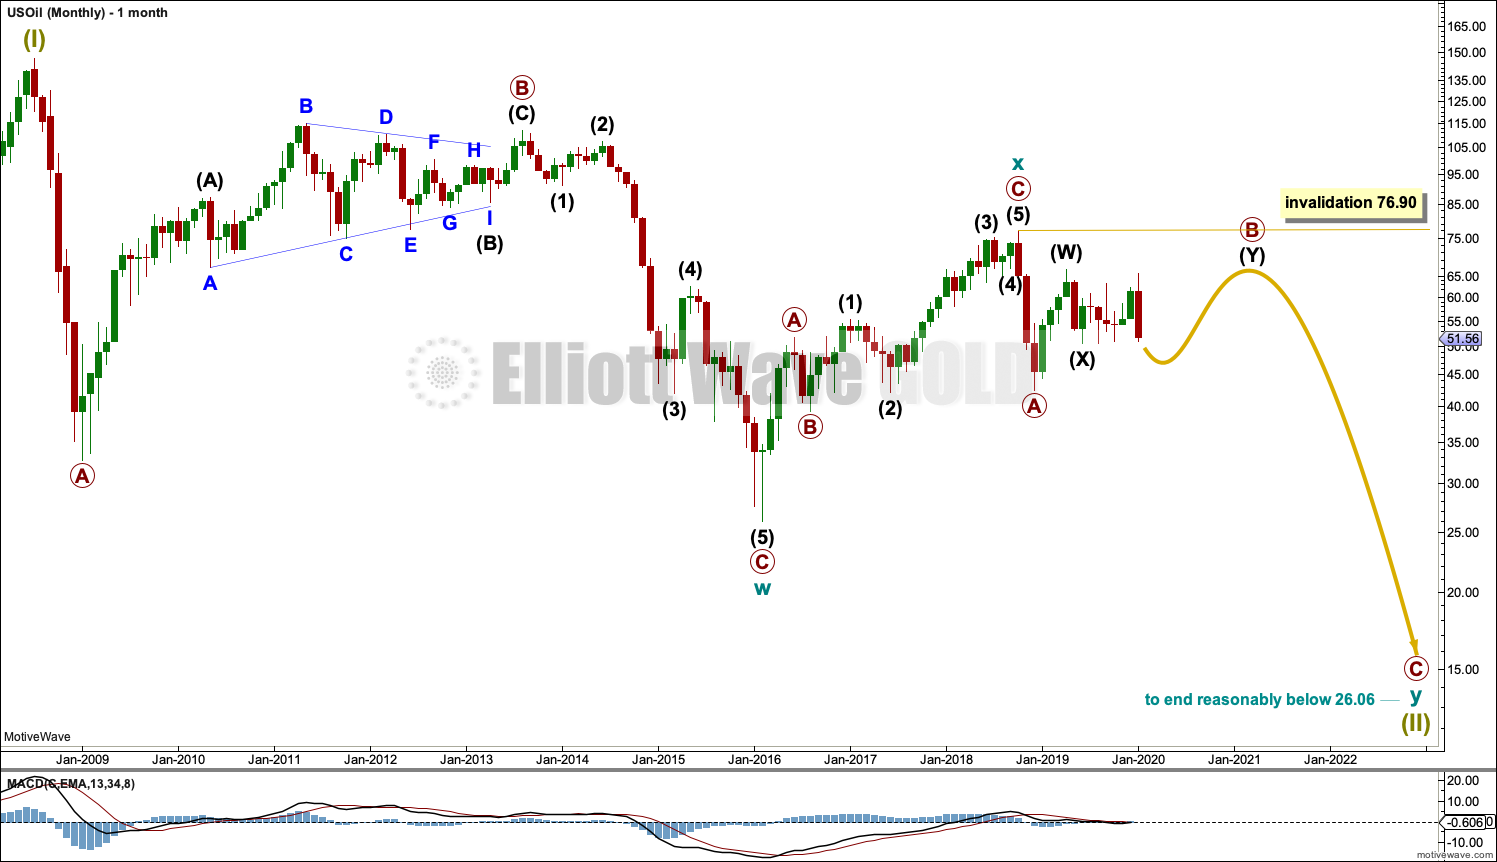
The basic Elliott wave structure is five steps forward and three steps back. This Elliott wave count expects that US Oil is still within a three steps back pattern, which began in July 2008. The Elliott wave count expects that the bear market for US Oil continues.
This Elliott wave corrective structure is a double zigzag, which is a fairly common structure. The correction is labelled Super Cycle wave (II).
The first zigzag in the double is complete and labelled cycle wave w. The double is joined by a three in the opposite direction labelled cycle wave x, which subdivides as a zigzag. The second zigzag in the double may now have begun, labelled cycle wave y.
The purpose of a second zigzag in a double zigzag is to deepen the correction when the first zigzag does not move price deep enough. To achieve this purpose cycle wave y may be expected to move reasonably below the end of cycle wave w at 26.06. When primary wave B may be complete then the start of primary wave C may be known and a target may be calculated.
Cycle wave y is expected to subdivide as a zigzag, which subdivides 5-3-5.
Cycle wave w lasted 7.6 years and cycle wave x lasted 2.7 years. Cycle wave y may be expected to last possibly about a Fibonacci 5 or 8 years.
Primary wave B may not move beyond the start of primary wave A above 76.90.
WEEKLY CHART
Click chart to enlarge.
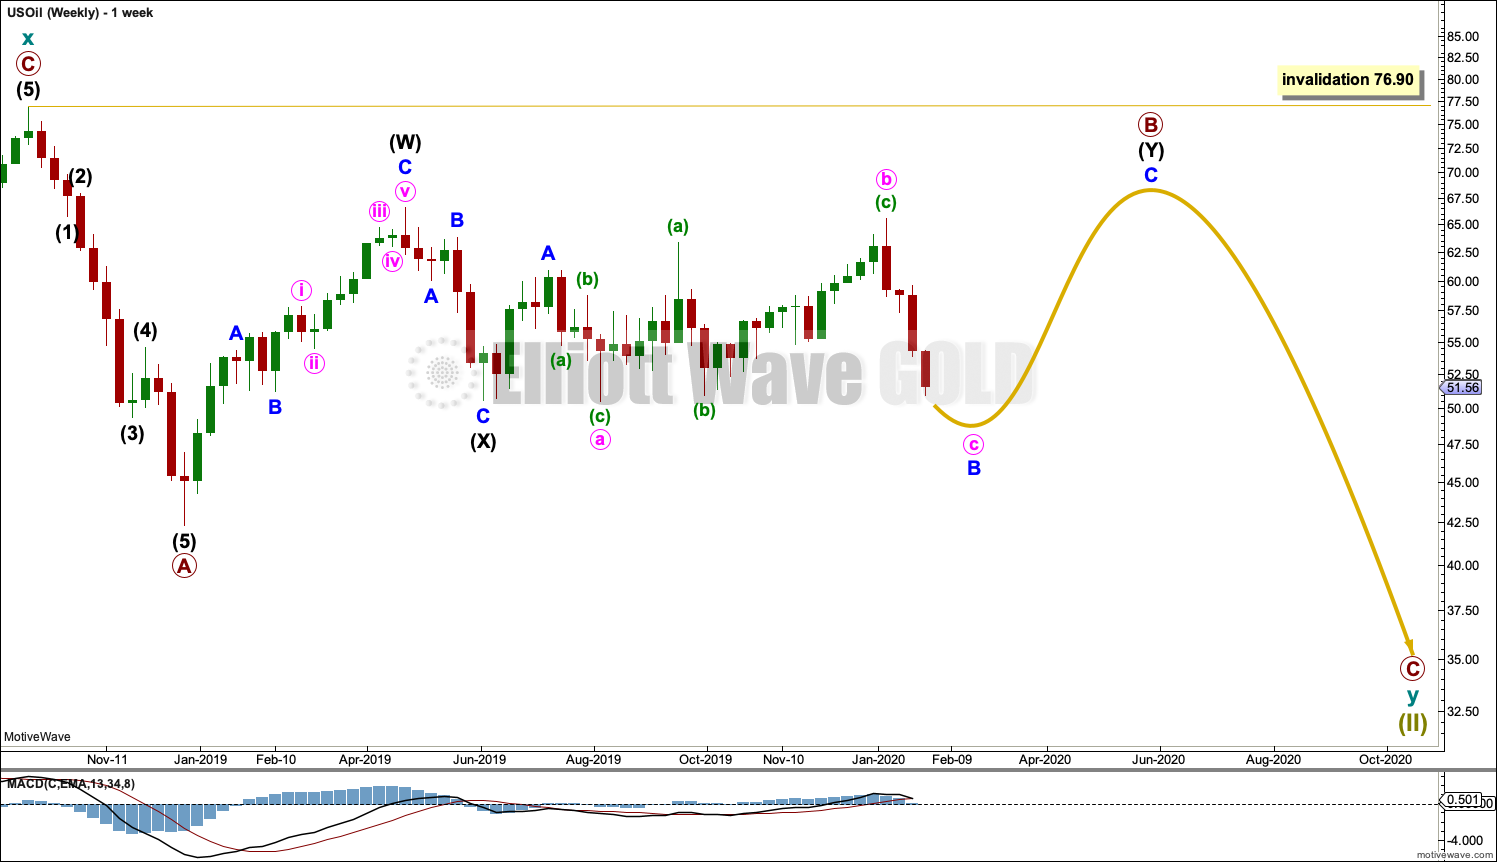
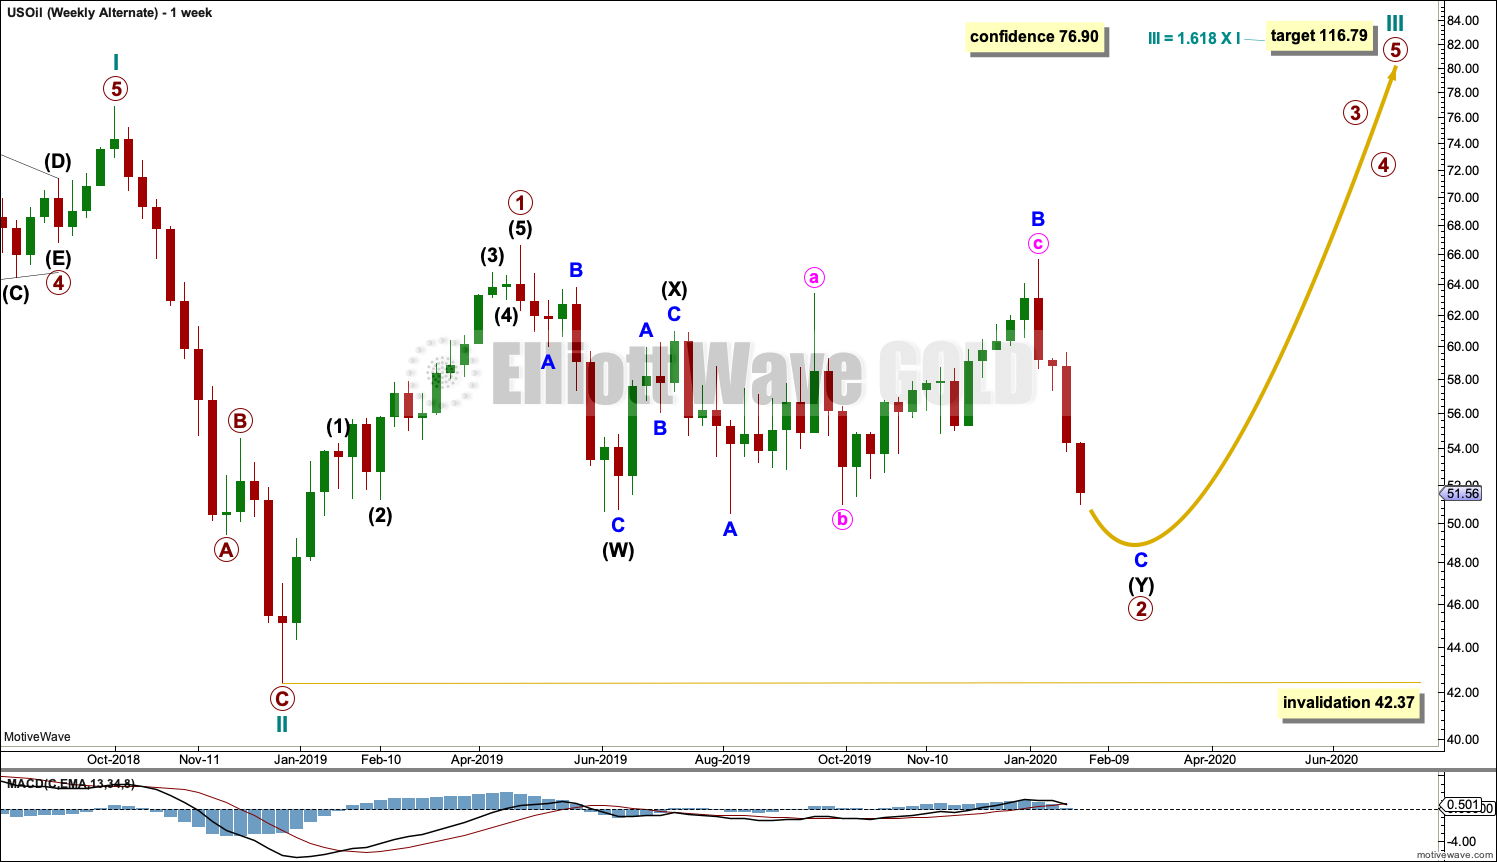
This weekly chart shows all of cycle wave y so far.
Cycle wave y is expected to subdivide as a zigzag. A zigzag subdivides 5-3-5. Primary wave A must subdivide as a five wave structure if this wave count is correct.
Primary wave A may be a complete five wave impulse at the last low.
Primary wave B may be a double combination: zigzag – X – flat. Intermediate wave (W) fits as a zigzag. Intermediate wave (Y) may be unfolding as a flat correction.
Within intermediate wave (Y), minor wave A may be complete. Minor wave B may be an incomplete expanded flat.
When primary wave B may be complete, then a downwards breakout would be expected for primary wave C.
Primary wave B may not move beyond the start of primary wave A above 76.90.
DAILY CHART
Click chart to enlarge.
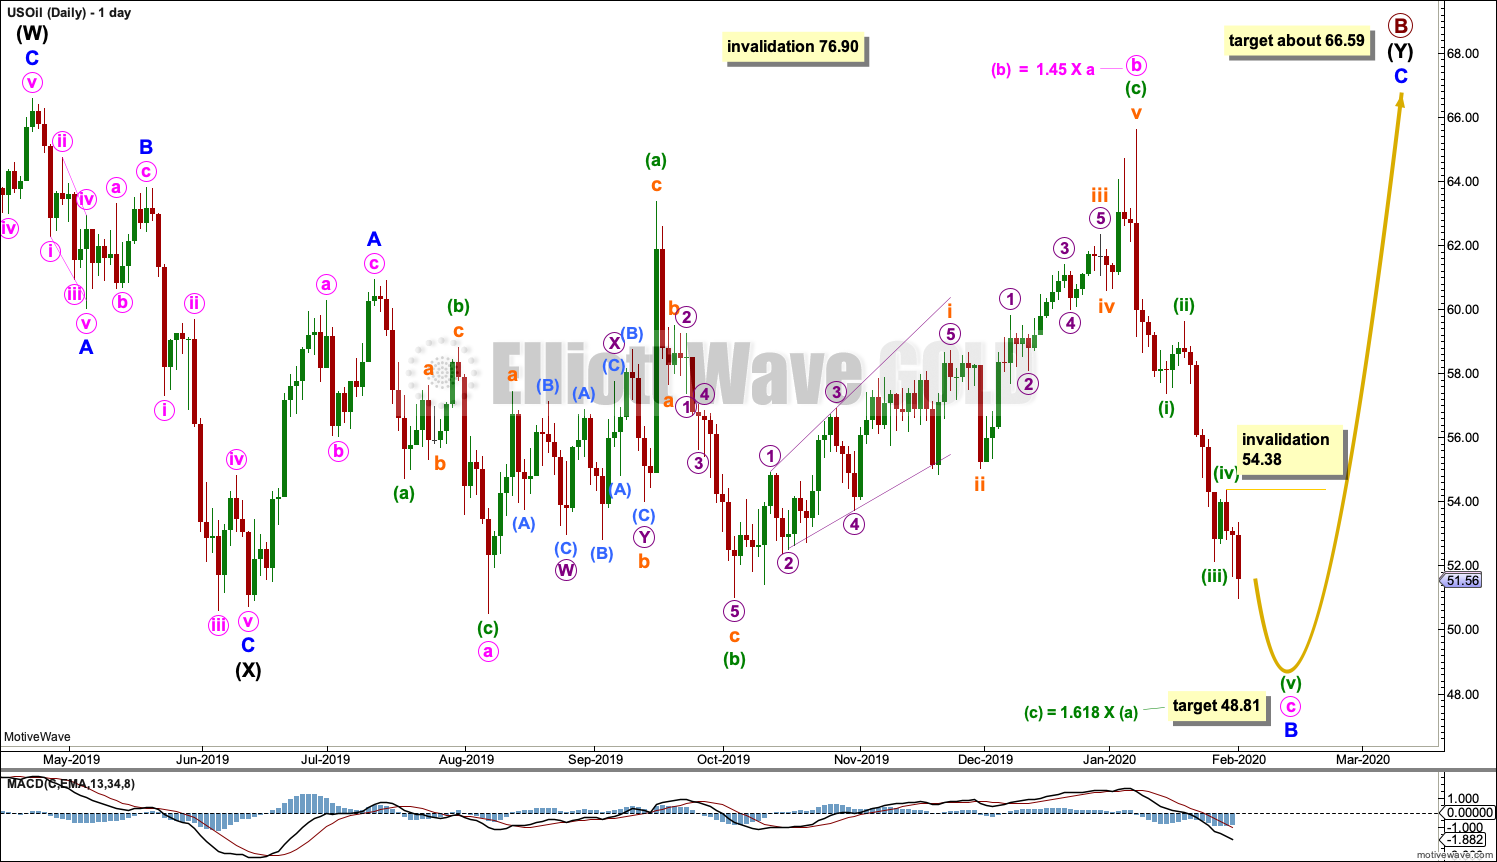
This daily chart shows all of intermediate waves (X) and (Y).
Intermediate wave (Y) may be subdividing as a flat correction. Within the flat, minor wave A subdivides as a three and minor wave B may be an incomplete three. At its end, minor wave B must retrace a minimum 0.9 of minor wave A at 51.74. This minimum has now been met.
The analysis of minor wave B has changed. The new labelling has a better fit.
Minor wave B may be subdividing as an expanded flat. Within the expanded flat, both minute waves a and b may be complete and both subdivide as threes. Minute wave c should now continue lower as a five wave structure that would be very likely to make at least a slight new low below the end of minute wave a at 50.53 to avoid a truncation and a very rare running flat.
The target is recalculated. It is now the same for both wave counts. This target expects minute wave c to exhibit a common Fibonacci ratio to minute wave a.
When minor wave B may be complete, then minor wave C should move higher to end above the end of minor wave A at 60.93.
As soon as price makes at least a slight new low below 50.53, then minor wave B may be complete at any stage. A trend change may then occur and a new upwards swing may begin.
Within minuette wave (v), no second wave correction may move beyond its start above 54.38. After a new low below 50.53, then a new high above 54.38 would indicate the downwards swing is over and a new upwards swing has begun.
ALTERNATE ELLIOTT WAVE COUNT
MONTHLY CHART
Click chart to enlarge.
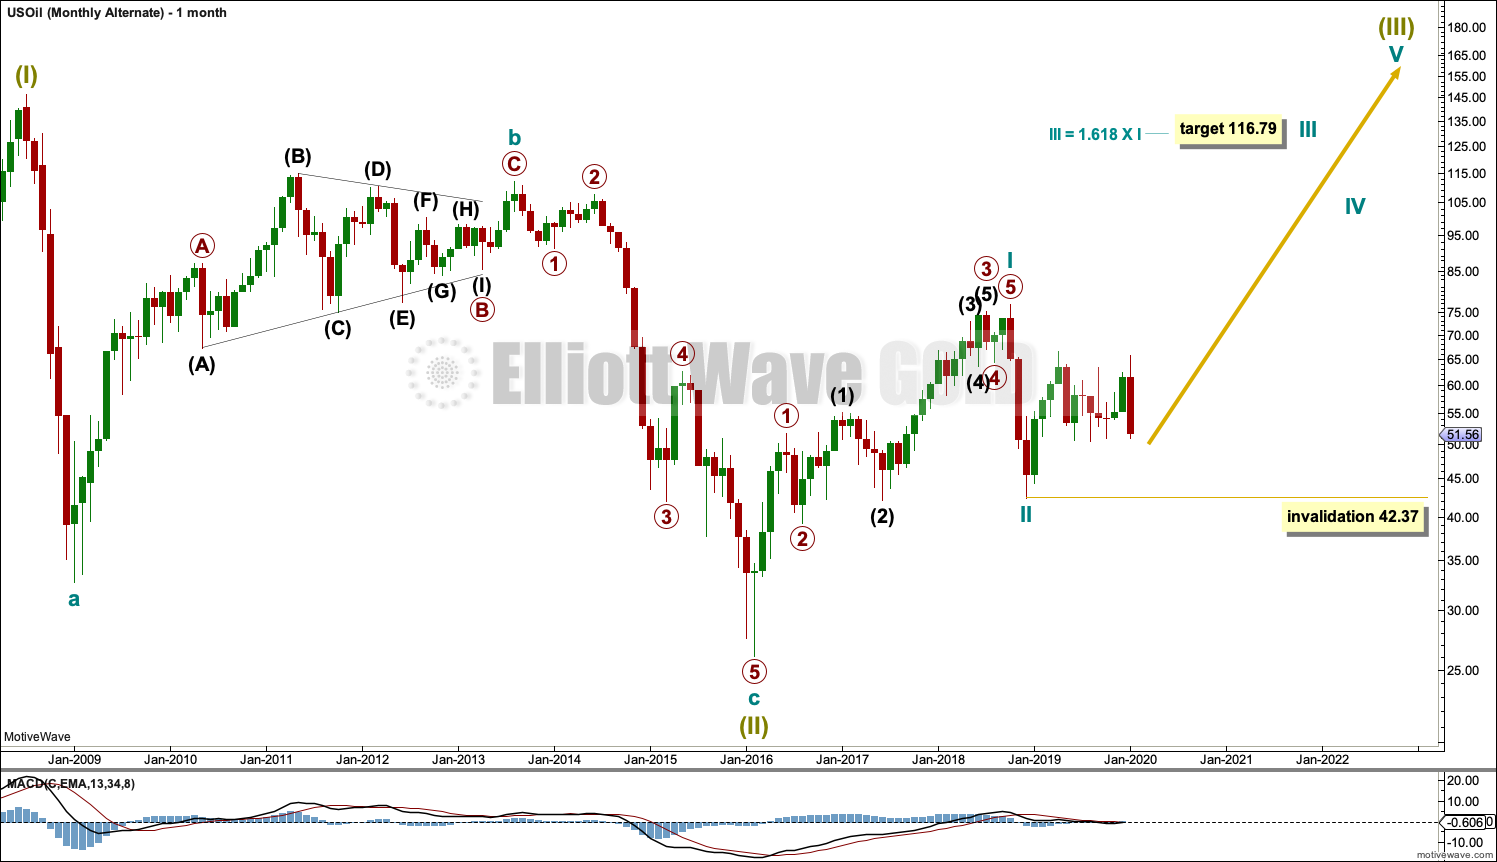
It is possible that the bear market is over for Oil and a new bull market has begun.
For a bullish wave count for Oil, the upwards wave from the major low at 26.06 in February 2016 must be seen as a complete five wave impulse. This is labelled cycle wave I.
Cycle wave II may be a complete zigzag at 0.679 the depth of cycle wave I.
A target is calculated for cycle wave III to reach a common Fibonacci ratio to cycle wave I.
Within cycle wave III, no second wave correction may move beyond the start of its first wave below 42.37.
WEEKLY CHART
Click chart to enlarge.
Cycle wave II does look best as a three. This is the only part of this wave count that has a better look than the main wave count, which sees this downwards wave as a five.
The upwards wave of primary wave 1 within cycle wave III must be seen as a five wave structure for a bullish wave count to work. This movement at lower time frames does not subdivide well as a five; this reduces the probability of this wave count.
Cycle wave III may only subdivide as an impulse. Within cycle wave III, so far primary wave 1 may be complete. Primary wave 2 may be moving sideways as a double combination. Primary wave 2 may not move beyond the start of primary wave 1 below 42.37.
Primary wave 2 may be continuing as a double combination.
The first structure in the double would be complete, a zigzag labelled intermediate wave (W). Within intermediate wave (W), minor wave C ends with a slight truncation for minute wave v. This is acceptable.
The double may be now joined by a complete three in the opposite direction, a zigzag labelled intermediate wave (X).
Intermediate wave (Y) may now be completing as an expanded flat correction.
DAILY CHART
Click chart to enlarge.
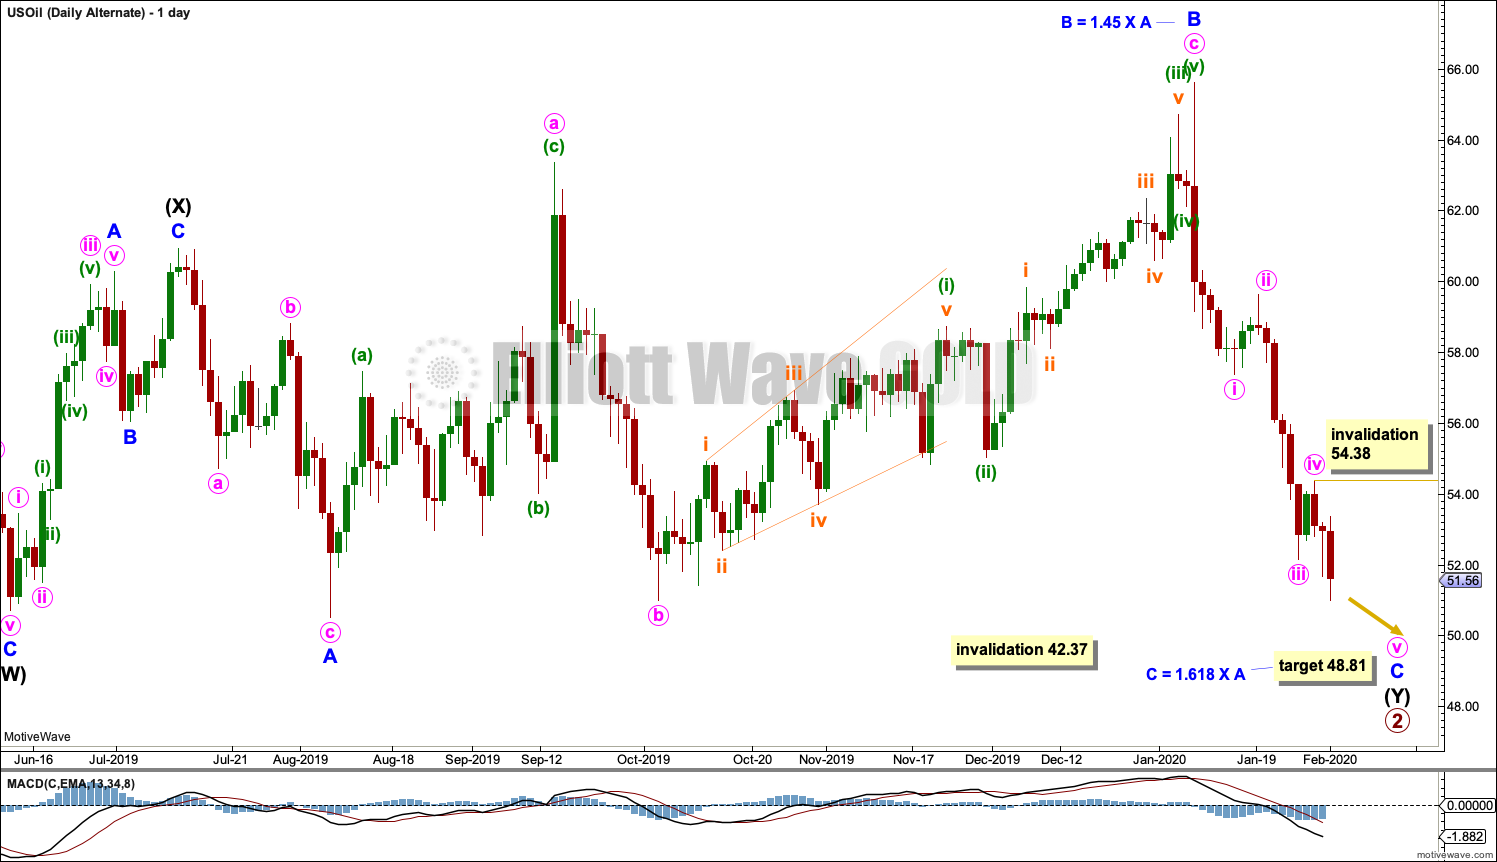
Intermediate wave (Y) may be unfolding as an expanded flat correction. Within the expanded flat, minor wave A subdivides as a three and minor wave B may now be a complete three that is just beyond the normal range of 1 to 1.38 times the length of minor wave A. This is still acceptable. The wave count remains valid.
A target is calculated for minor wave C that expects a common Fibonacci ratio to minor wave A. Minor wave C would be likely to make at least a slight new low below the end of minor wave A at 50.53 to avoid a truncation and a very rare running flat.
Minor wave C must subdivide as a five wave structure, most likely an impulse. Within the impulse, minute waves i through to iv may now be complete. Within minute wave v, no second wave correction may move beyond its start above 54.38.
Primary wave 2 may not move beyond the start of primary wave 1 below 42.37.
TECHNICAL ANALYSIS
MONTHLY CHART
Click chart to enlarge. Chart courtesy of StockCharts.com.
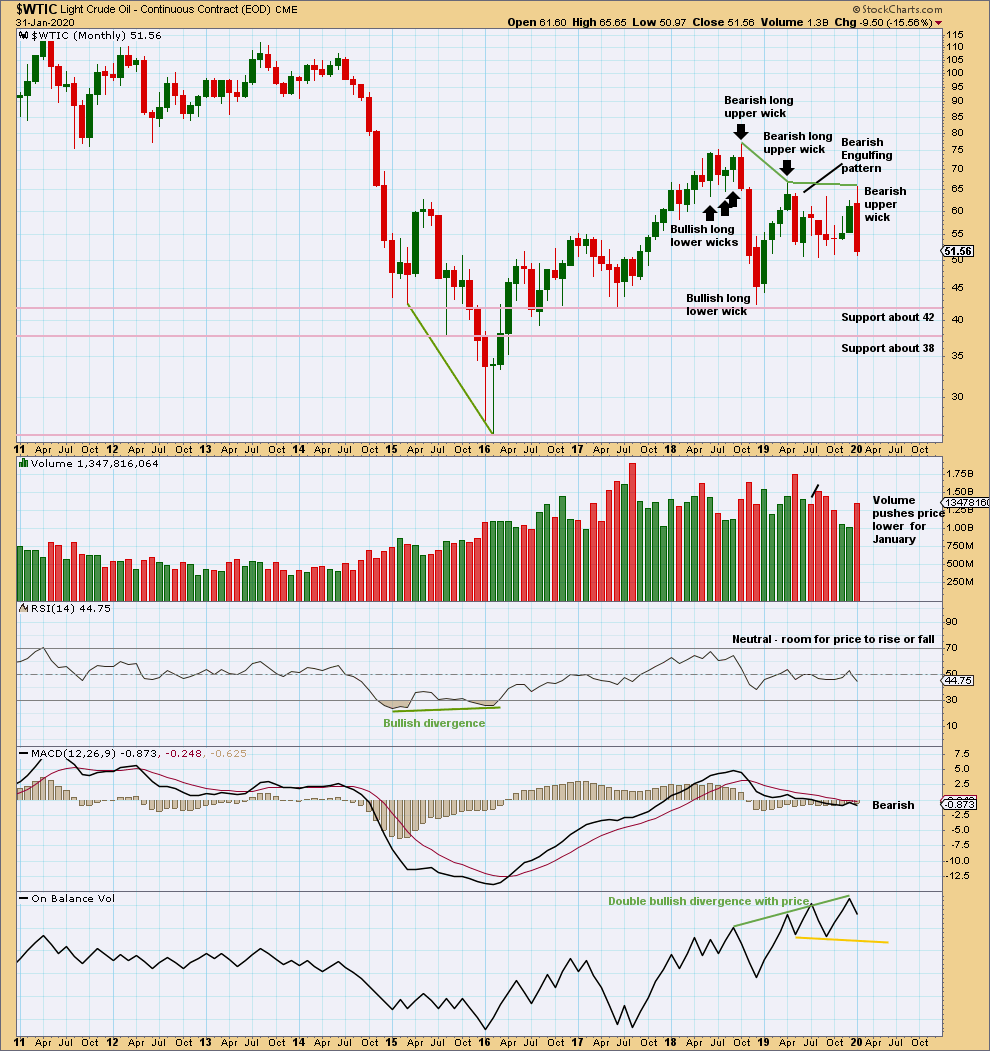
There is now double bullish divergence between price and On Balance Volume. This supports the alternate Elliott wave count.
Overall, price has been moving sideways for a few months now. Within this sideways movement, the downwards month of May has greatest range and volume; this supports the main Elliott wave count. Upwards movement for December lacks support from volume. Now downwards movement for January exhibits increased range and support from volume. The volume profile remains bearish; this supports the main Elliott wave count.
WEEKLY CHART
Click chart to enlarge. Chart courtesy of StockCharts.com.
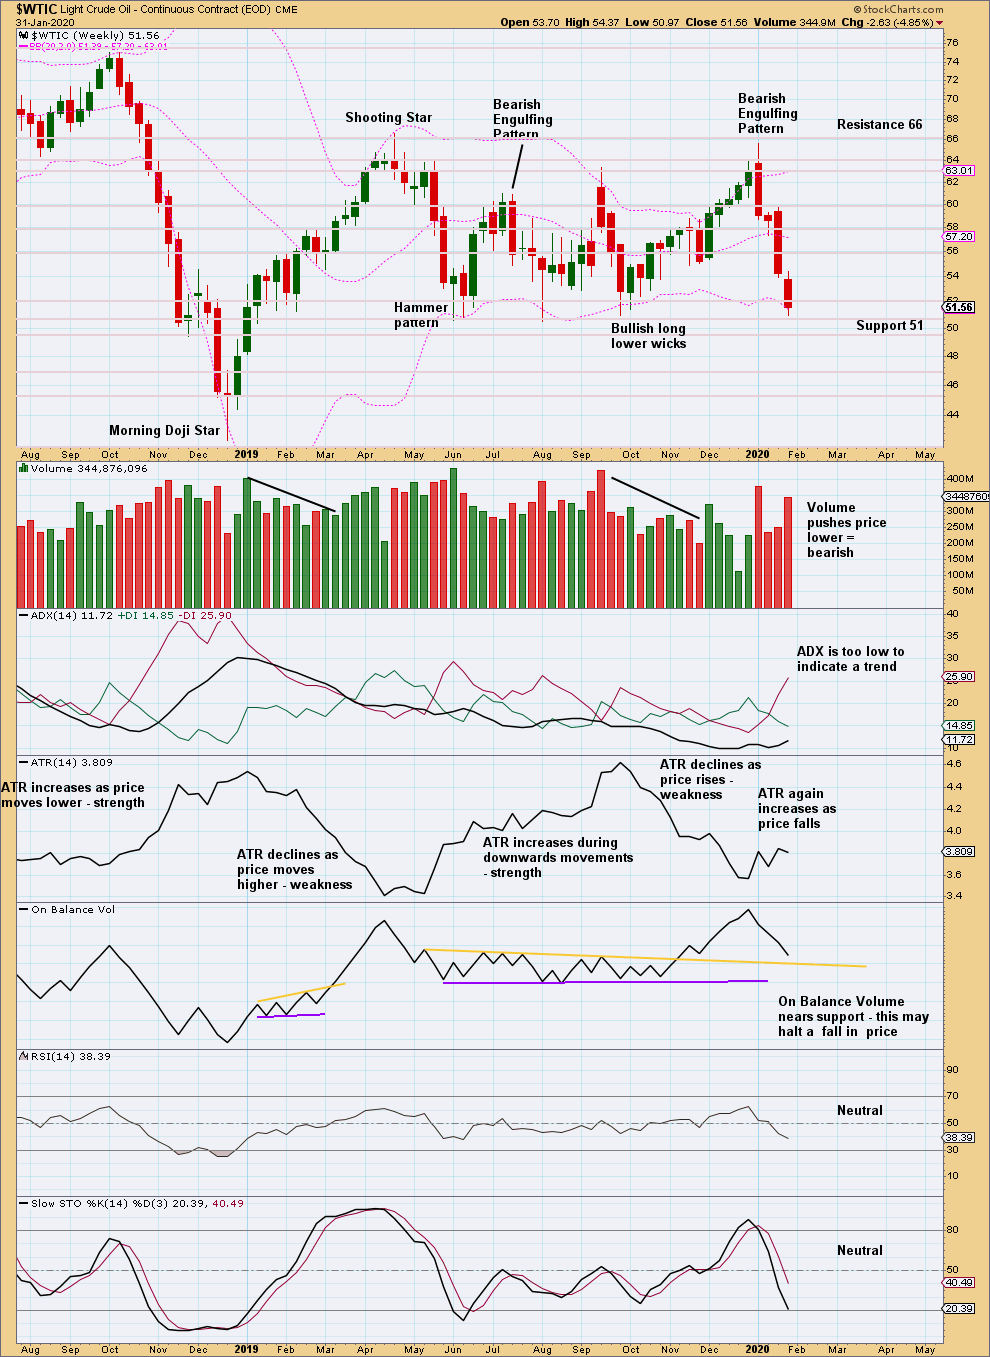
Price is consolidating, swinging from support to resistance and back again. Support is about 51 and resistance is about 66. Currently, a downwards swing is now at support at 51. Next support below is about 50. Stochastics is not yet oversold, but it is close. Look for downwards movement to end when Stochastics reaches oversold; this may be in one more downwards week.
Volume is pushing price lower this week. This suggests another downwards week next week.
When price consolidates, each swing is normally very choppy and overlapping. Do not expect price to move in a straight line.
DAILY CHART
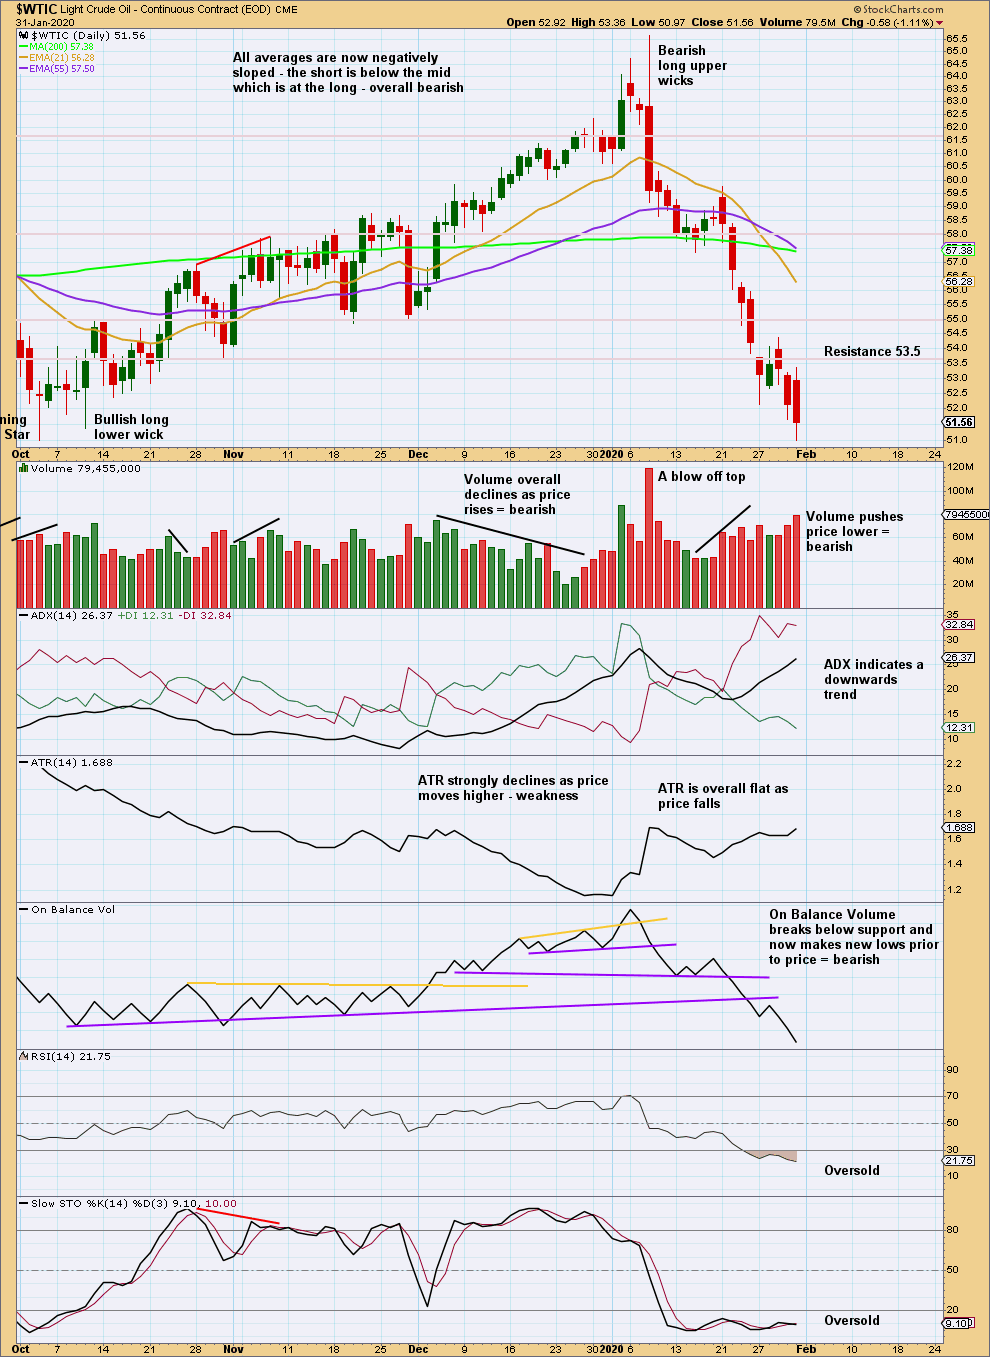
Click chart to enlarge. Chart courtesy of StockCharts.com.
The weekly time frame is best to view the larger consolidation. This daily time frame focusses more on each swing within the larger consolidation.
At this time frame, the downwards swing is a downwards trend. The trend is not extreme although RSI and Stochastics are oversold. With volume pushing price lower, expect downwards movement to continue for at least a few more days.
Published @ 10:04 p.m. EST.
—
Careful risk management protects your trading account(s).
Follow my two Golden Rules:
1. Always trade with stops.
2. Risk only 1-5% of equity on any one trade.
—
New updates to this analysis are in bold.
0 Comments