
US OIL: Elliott Wave and Technical Analysis | Charts – February 28, 2020
Downwards movement has broken below support. Both the main and alternate Elliott wave counts are reanalysed to accept a downwards breakout. The invalidation point for the alternate Elliott wave count is now very close by.
Summary: A downwards breakout happened this week with support from volume. Next target for a multi-week interruption to the downwards trend is at 28.24.
MAIN ELLIOTT WAVE COUNT – BEARISH
MONTHLY CHART
Click chart to enlarge.
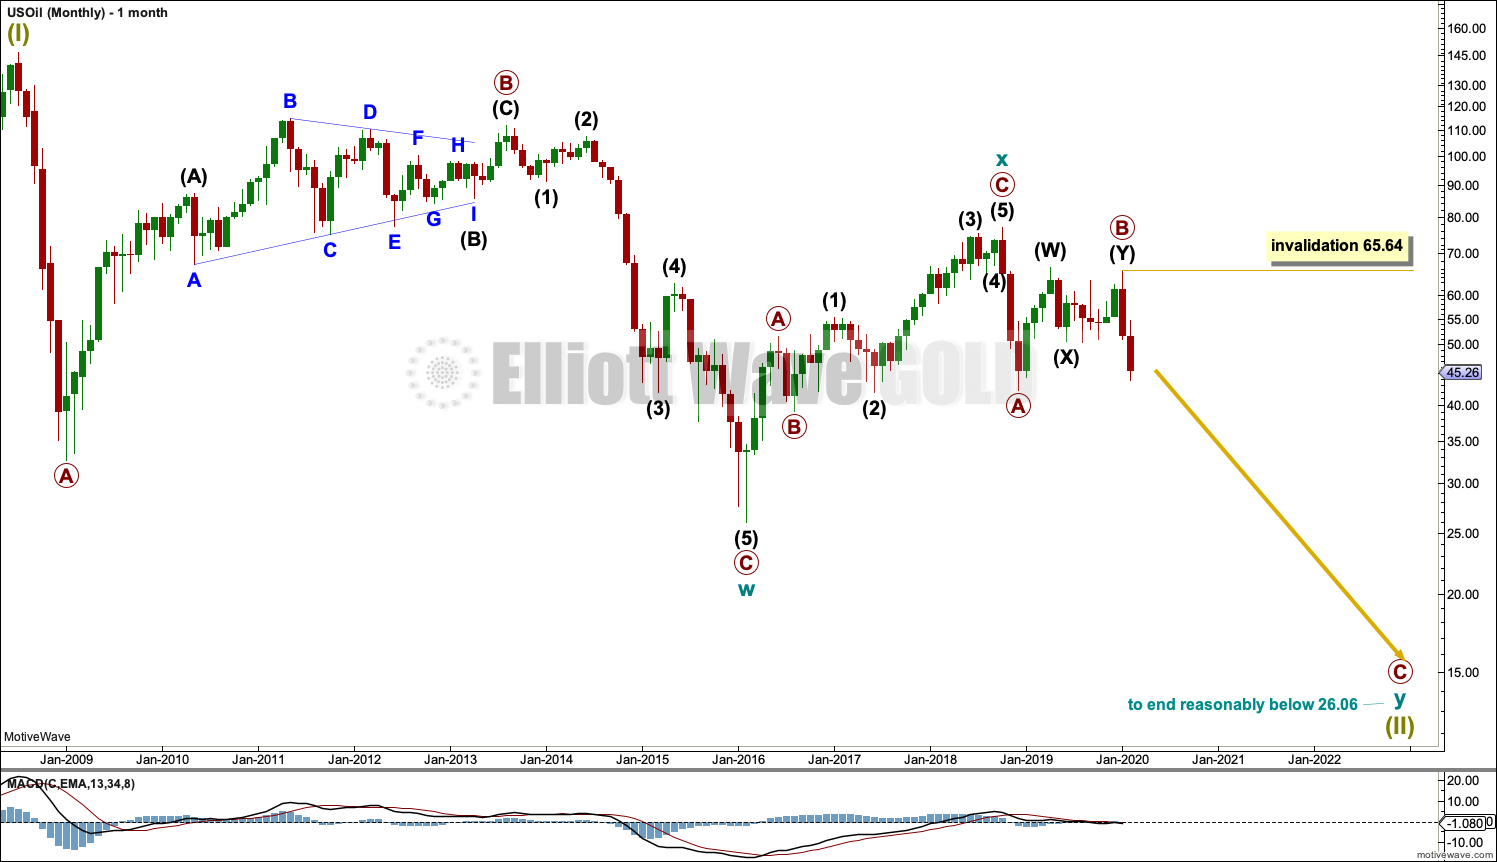
The basic Elliott wave structure is five steps forward and three steps back. This Elliott wave count expects that US Oil is still within a three steps back pattern, which began in July 2008. The Elliott wave count expects that the bear market for US Oil continues.
This Elliott wave corrective structure is a double zigzag, which is a fairly common structure. The correction is labelled Super Cycle wave (II).
The first zigzag in the double is complete and labelled cycle wave w. The double is joined by a three in the opposite direction labelled cycle wave x, which subdivides as a zigzag. The second zigzag in the double may now have begun, labelled cycle wave y.
The purpose of a second zigzag in a double zigzag is to deepen the correction when the first zigzag does not move price deep enough. To achieve this purpose cycle wave y may be expected to move reasonably below the end of cycle wave w at 26.06. When the alternate bullish Elliott wave count below is invalidated, then a target for this bearish wave count for primary wave C to complete cycle wave y and Super Cycle wave (II) will be calculated.
Cycle wave y is expected to subdivide as a zigzag, which subdivides 5-3-5.
Cycle wave w lasted 7.6 years and cycle wave x lasted 2.7 years. Cycle wave y may be expected to last possibly about a Fibonacci 5 or 8 years.
Within primary wave C, no second wave correction may move beyond the start of its first wave above 65.64.
WEEKLY CHART
Click chart to enlarge.
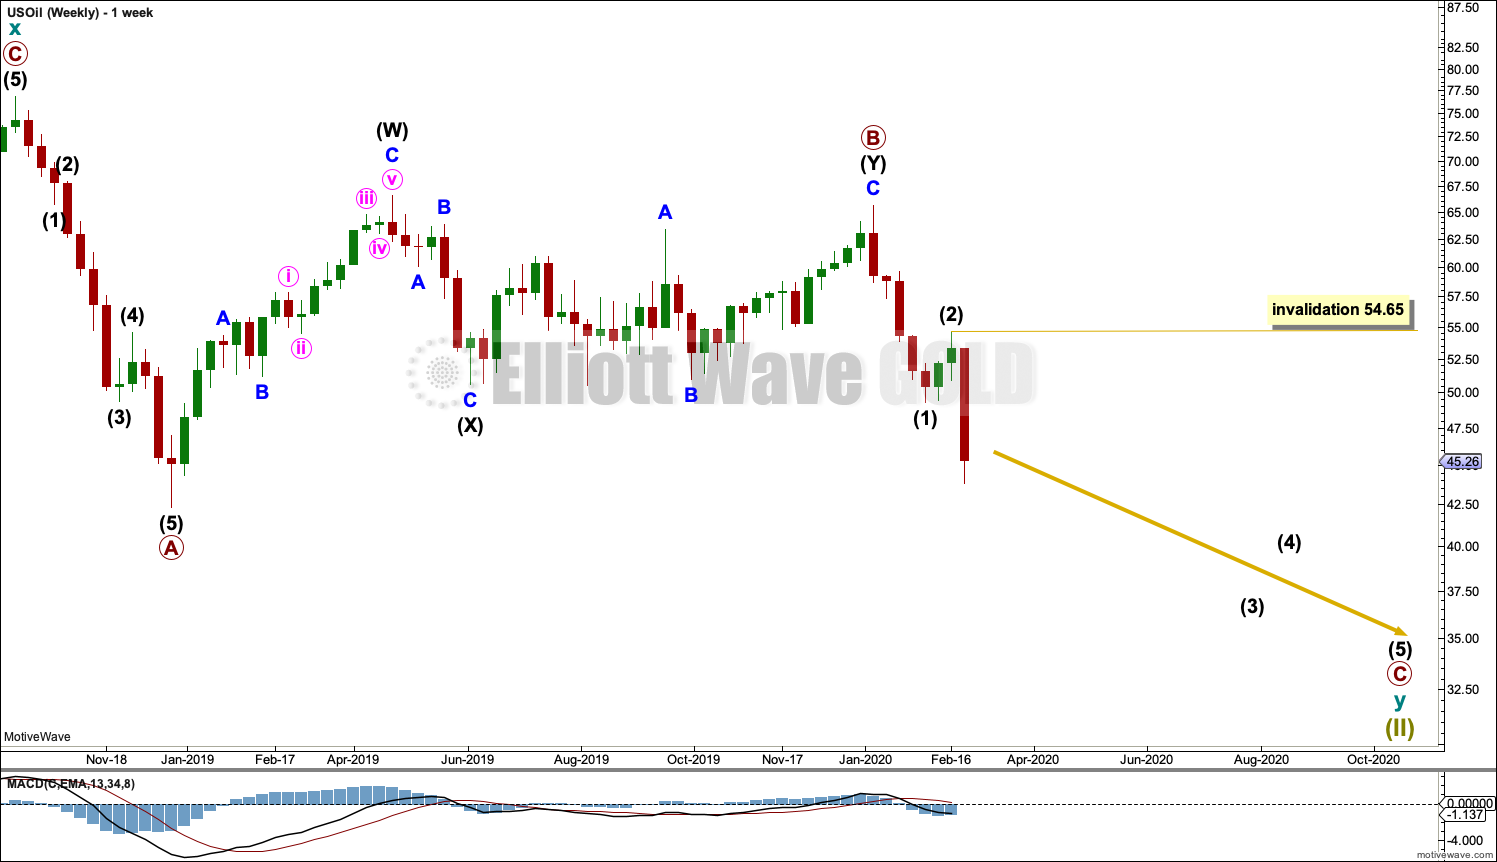
This weekly chart shows all of cycle wave y so far.
Cycle wave y is expected to subdivide as a zigzag. A zigzag subdivides 5-3-5. Primary wave A must subdivide as a five wave structure if this wave count is correct.
Primary wave A may be a complete five wave impulse at the last low.
Primary wave B may be a complete double combination: zigzag – X – flat. Intermediate wave (W) fits as a zigzag. Intermediate wave (Y) may be a complete regular flat correction.
Primary wave C must subdivide as a five wave motive structure, most likely an impulse. Within primary wave C, intermediate waves (1) and (2) may be complete. Within intermediate wave (3), no second wave correction may move beyond the start of its first wave above 54.65.
DAILY CHART
Click chart to enlarge.
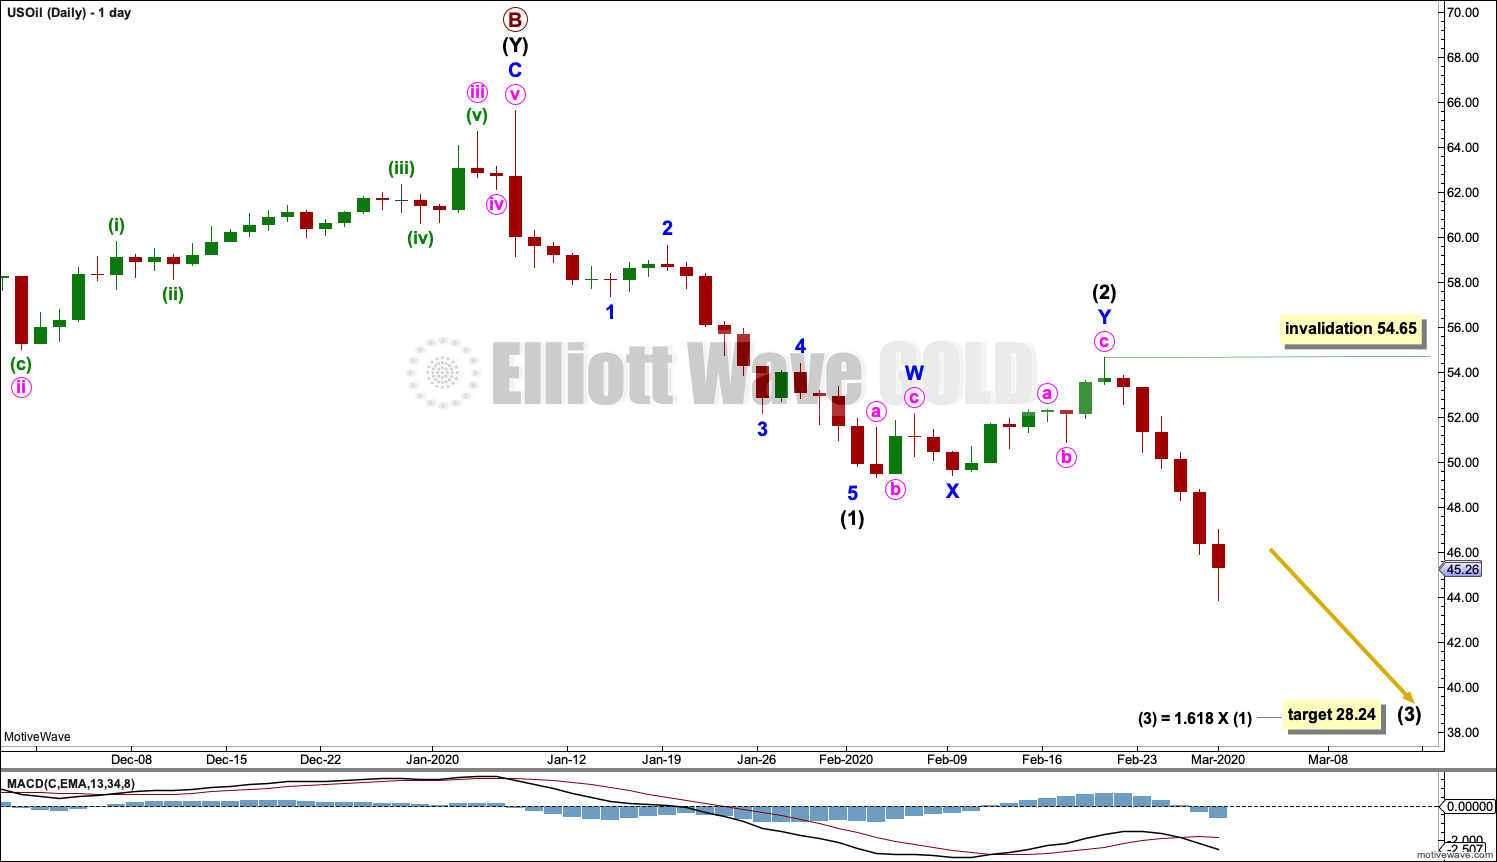
Primary wave C must subdivide as a five wave motive structure, most likely an impulse. Within primary wave C, intermediate wave (1) subdivides as a complete impulse, intermediate wave (2) may be a complete double zigzag, and intermediate wave (3) may have begun.
Within intermediate wave (3), no second wave correction may move beyond the start of its first wave above 54.65.
ALTERNATE ELLIOTT WAVE COUNT
MONTHLY CHART
Click chart to enlarge.
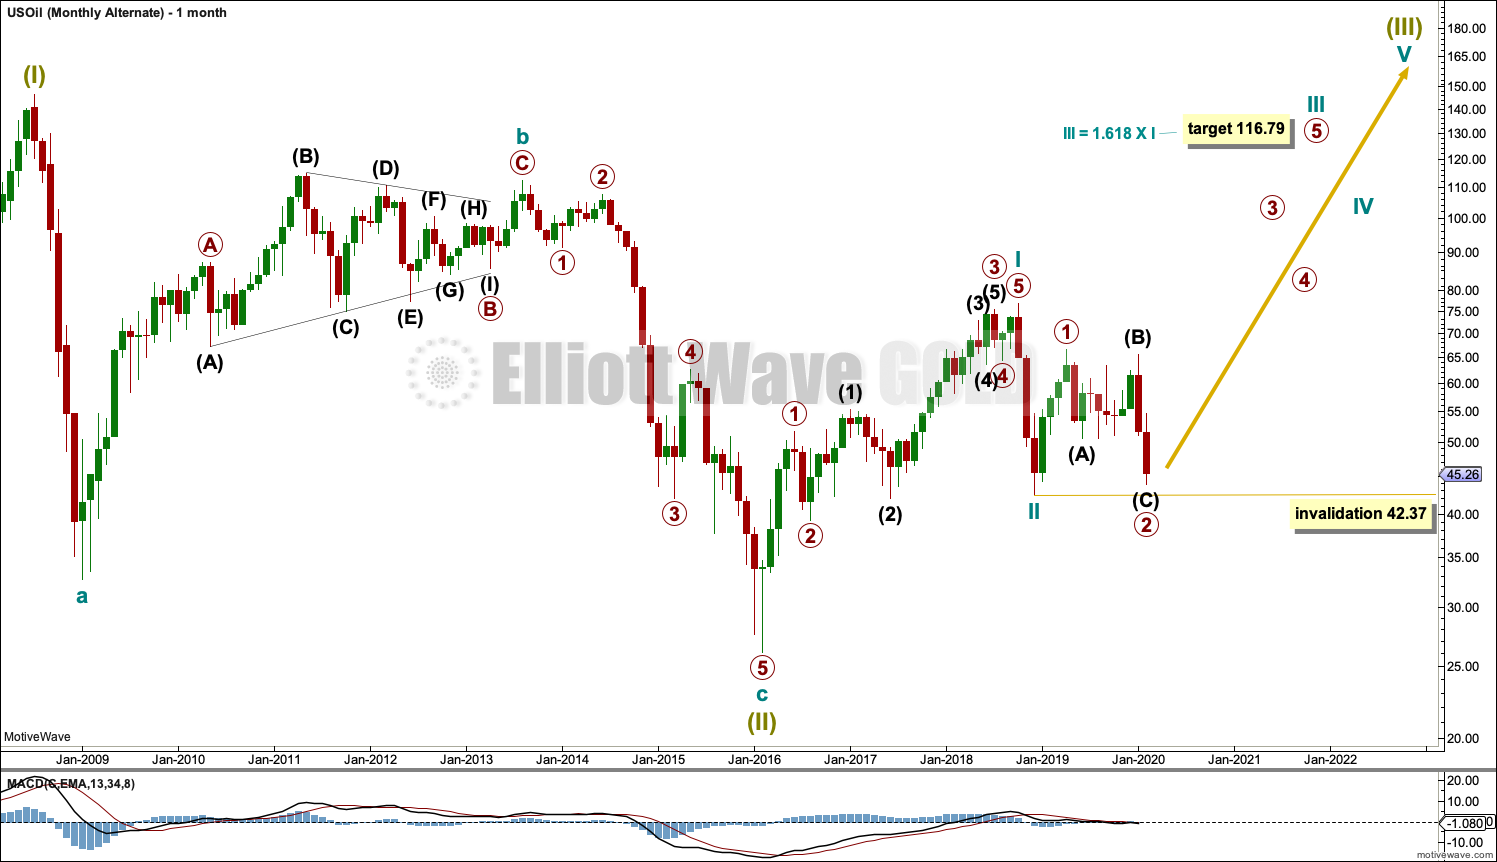
It is possible that the bear market is over for Oil and a new bull market has begun.
For a bullish wave count for Oil, the upwards wave from the major low at 26.06 in February 2016 must be seen as a complete five wave impulse. This is labelled cycle wave I.
Cycle wave II may be a complete zigzag at 0.679 the depth of cycle wave I.
A target is calculated for cycle wave III to reach a common Fibonacci ratio to cycle wave I.
Within cycle wave III, primary wave 2 may not move beyond the start of primary wave 1 below 42.37.
WEEKLY CHART
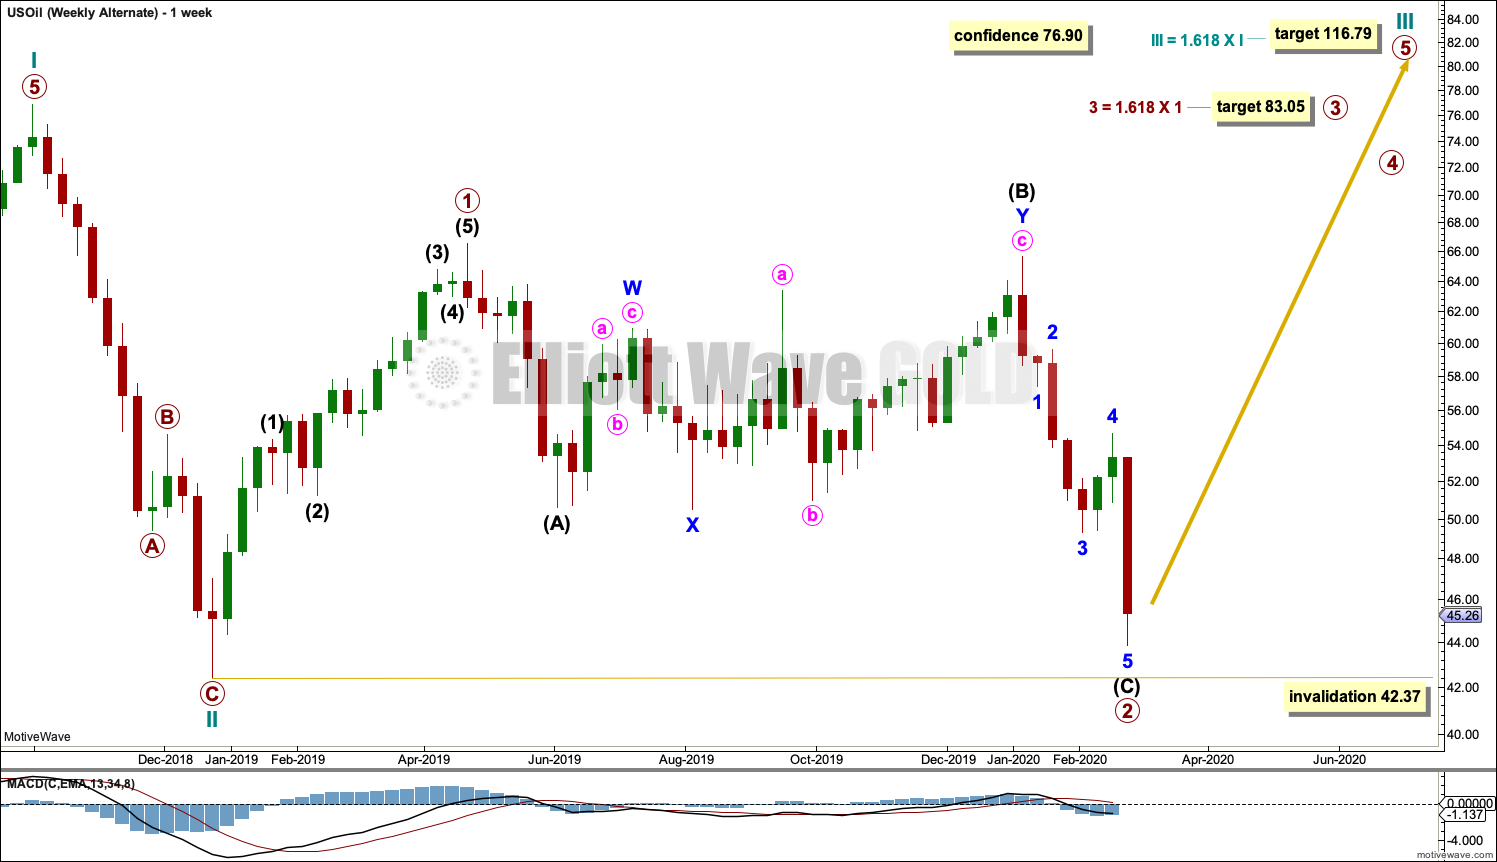
Click chart to enlarge.
Cycle wave II does look best as a three. This is the only part of this wave count that has a better look than the main wave count, which sees this downwards wave as a five.
The upwards wave of primary wave 1 within cycle wave III must be seen as a five wave structure for a bullish wave count to work. This movement at lower time frames does not subdivide well as a five; this reduces the probability of this wave count.
Cycle wave III may only subdivide as an impulse. Within cycle wave III, so far primary waves 1 and 2 may be complete. If it continues any lower, then primary wave 2 may not move beyond the start of primary wave 1 below 42.37.
A target calculated for primary wave 3 expects it to exhibit a common Fibonacci ratio to primary wave 1.
DAILY CHART
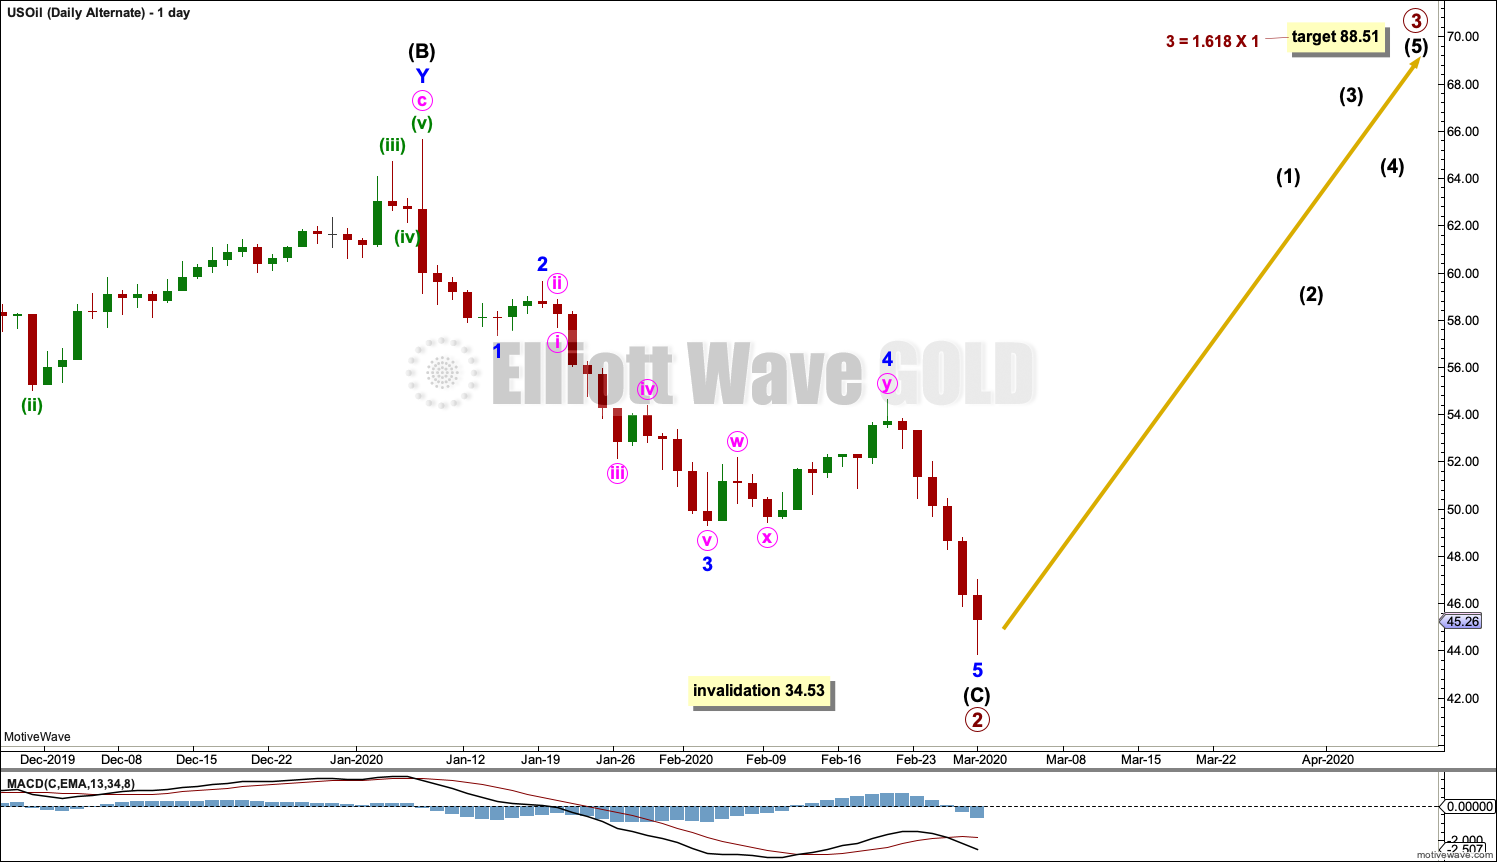
Click chart to enlarge.
Primary wave 2 may now be a complete regular flat. If it continues further, there is now very little room for it to move into. Primary wave 2 may not move beyond the start of primary wave 1 below 34.53.
Primary wave 3 may only subdivide as an impulse.
TECHNICAL ANALYSIS
MONTHLY CHART
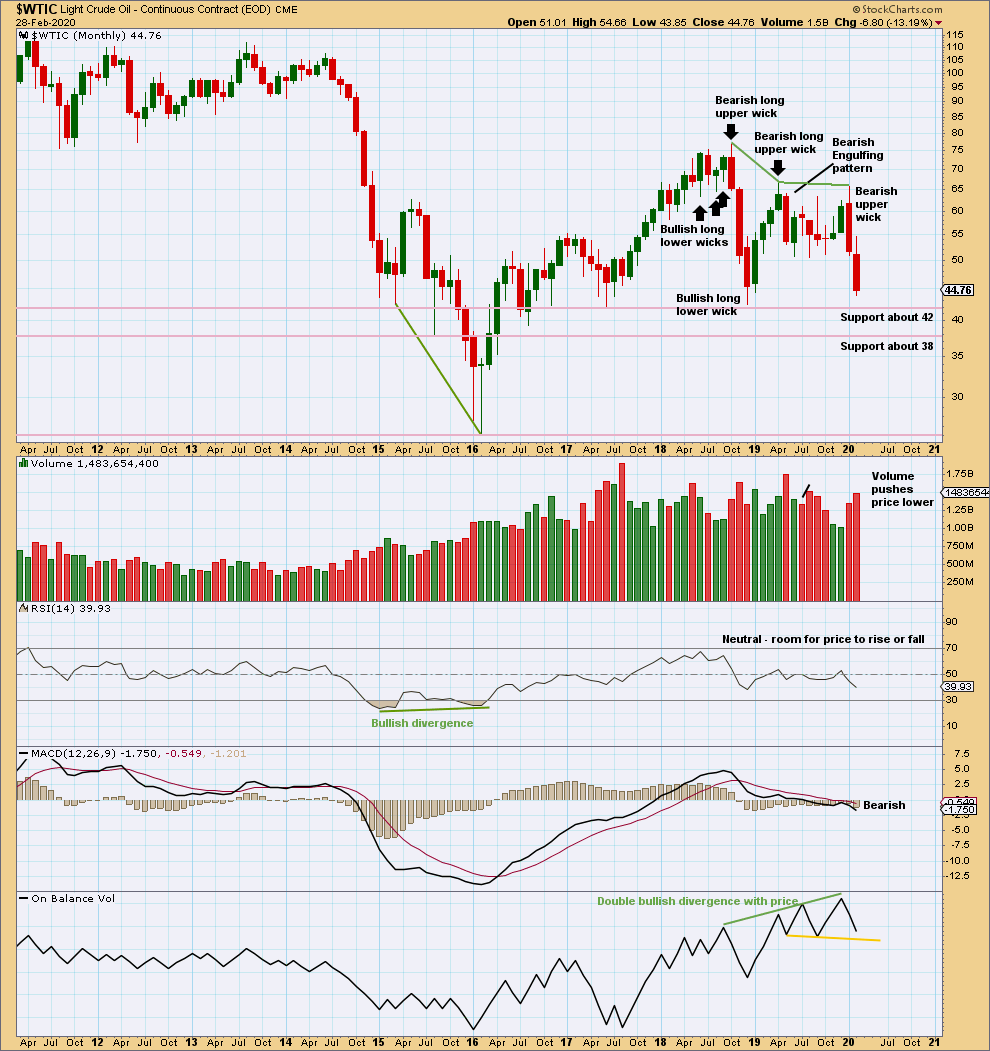
Click chart to enlarge. Chart courtesy of StockCharts.com.
Both January and February have increased range and volume for downwards movement. This supports the main Elliott wave count.
A close below support about 42 on a downwards day with support from volume would be a significant downwards breakout at this time frame.
WEEKLY CHART
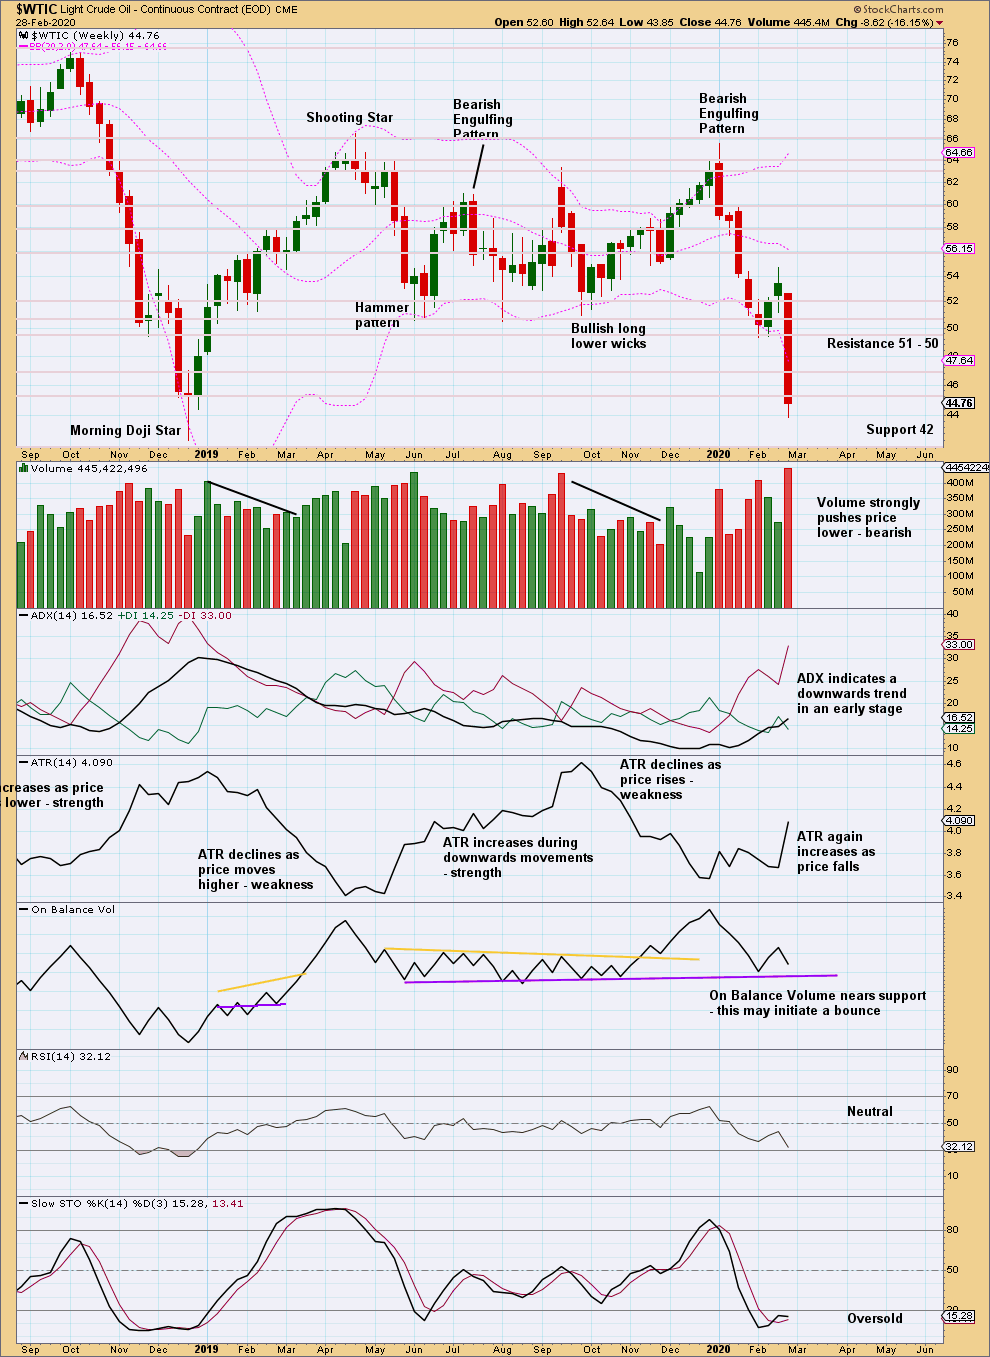
Click chart to enlarge. Chart courtesy of StockCharts.com.
This week a downwards breakout below prior support about 51 – 50 has been effected. This breakout has support from volume, so some confidence may be had in it. A target taken from the range of the prior consolidation would be about 34.37.
DAILY CHART
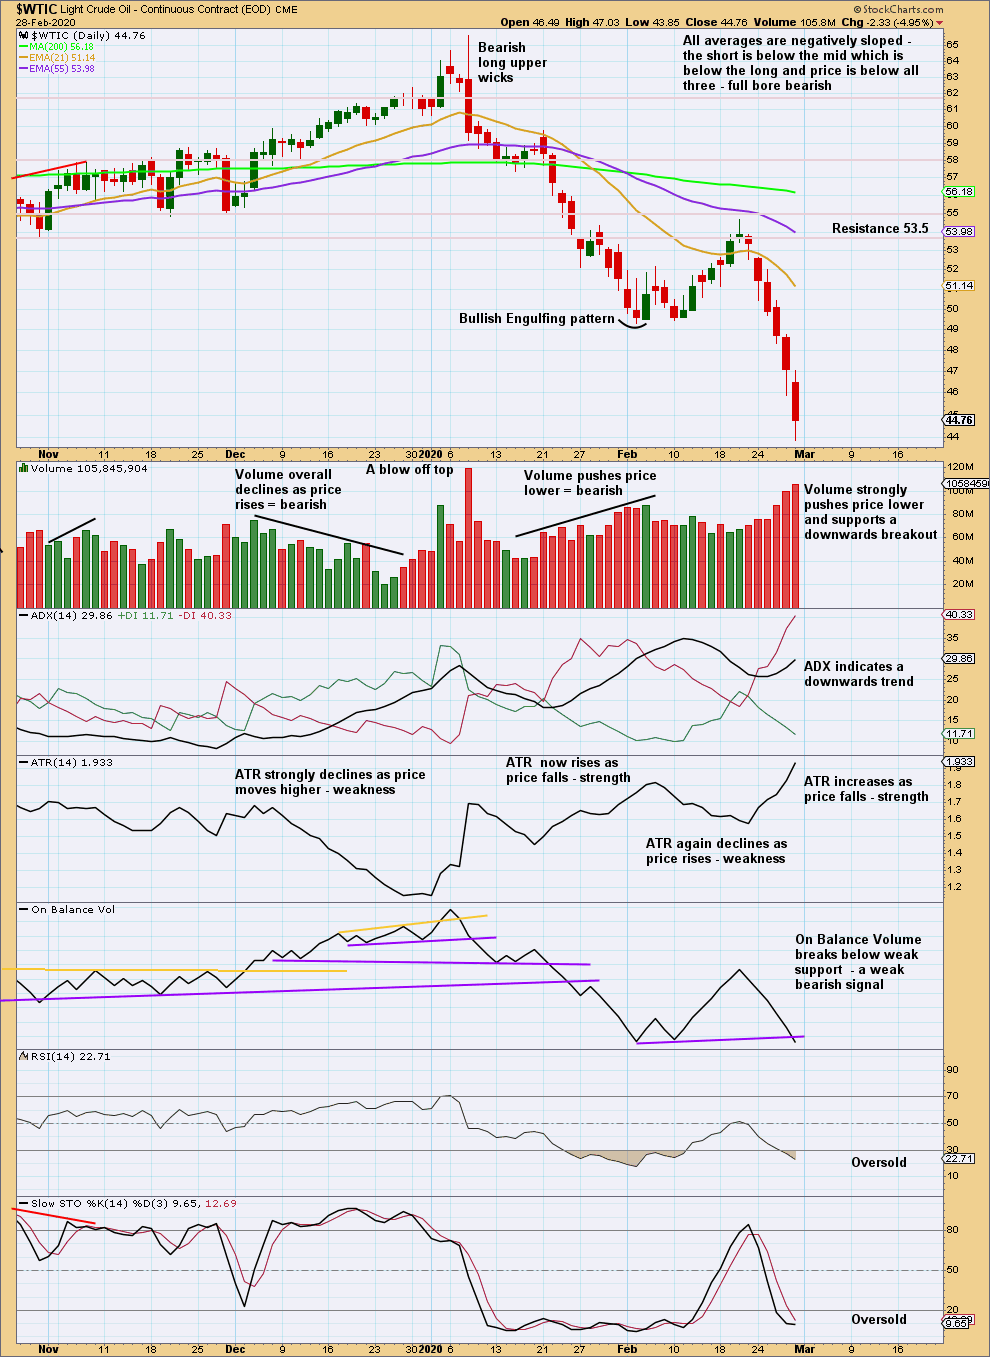
Click chart to enlarge. Chart courtesy of StockCharts.com.
A downwards trend is now in place at both daily and weekly time frames. Both volume and range support this trend.
RSI and Stochastics may remain very extreme for reasonable periods of time when this market trends.
Published @ 08:38 p.m. EST.
—
Careful risk management protects your trading account(s).
Follow my two Golden Rules:
1. Always trade with stops.
2. Risk only 1-5% of equity on any one trade.
—
New updates to this analysis are in bold.
0 Comments