
SILVER: Elliott Wave and Technical Analysis | Charts – March 20, 2020
Only one wave count remains. The final target remains the same. A new short-term target for a bounce is calculated.
Summary: A bounce may occur about 10.405. The final target is at 5.806.
ELLIOTT WAVE COUNTS
MAIN WAVE COUNT
MONTHLY CHART

Click chart to enlarge.
The bear market for Silver may be incomplete. Within a bearish movement, in the middle there should be a large interruption to the trend in the form of a B wave; bearish movements should have a three wave look to them. This wave count expects that normal look.
This Elliott wave structure for this bear market is labelled as a single zigzag for Grand Super Cycle wave II. Single zigzags are the most common Elliott wave corrective structure.
Within the zigzag, Super Cycle wave (a) subdivides as a five wave impulse, and Super Cycle wave (b) may now be a complete double combination. Super Cycle wave (c) may have begun and must subdivide as a five wave motive structure, either an impulse (much more likely) or an ending diagonal (less likely but still possible).
A target is now calculated for Super Cycle wave (c) to complete the zigzag for Grand Super Cycle wave II. Calculations using the more common ratios of equality and 0.618 yield negative results, so the next Fibonacci ratio in the sequence of 0.382 is used.
Within Super Cycle wave (c), no second wave correction may move beyond its start above 19.628.
Draw a channel about the zigzag of Grand Super Cycle wave II: draw the first trend line from the start of Super Cycle wave (a) to the end of Super Cycle wave (b), then place a parallel copy on the end of Super Cycle wave (a). The lower edge of then channel may provide support and may show where Grand Super Cycle wave II finally ends.
WEEKLY CHART
Click chart to enlarge.
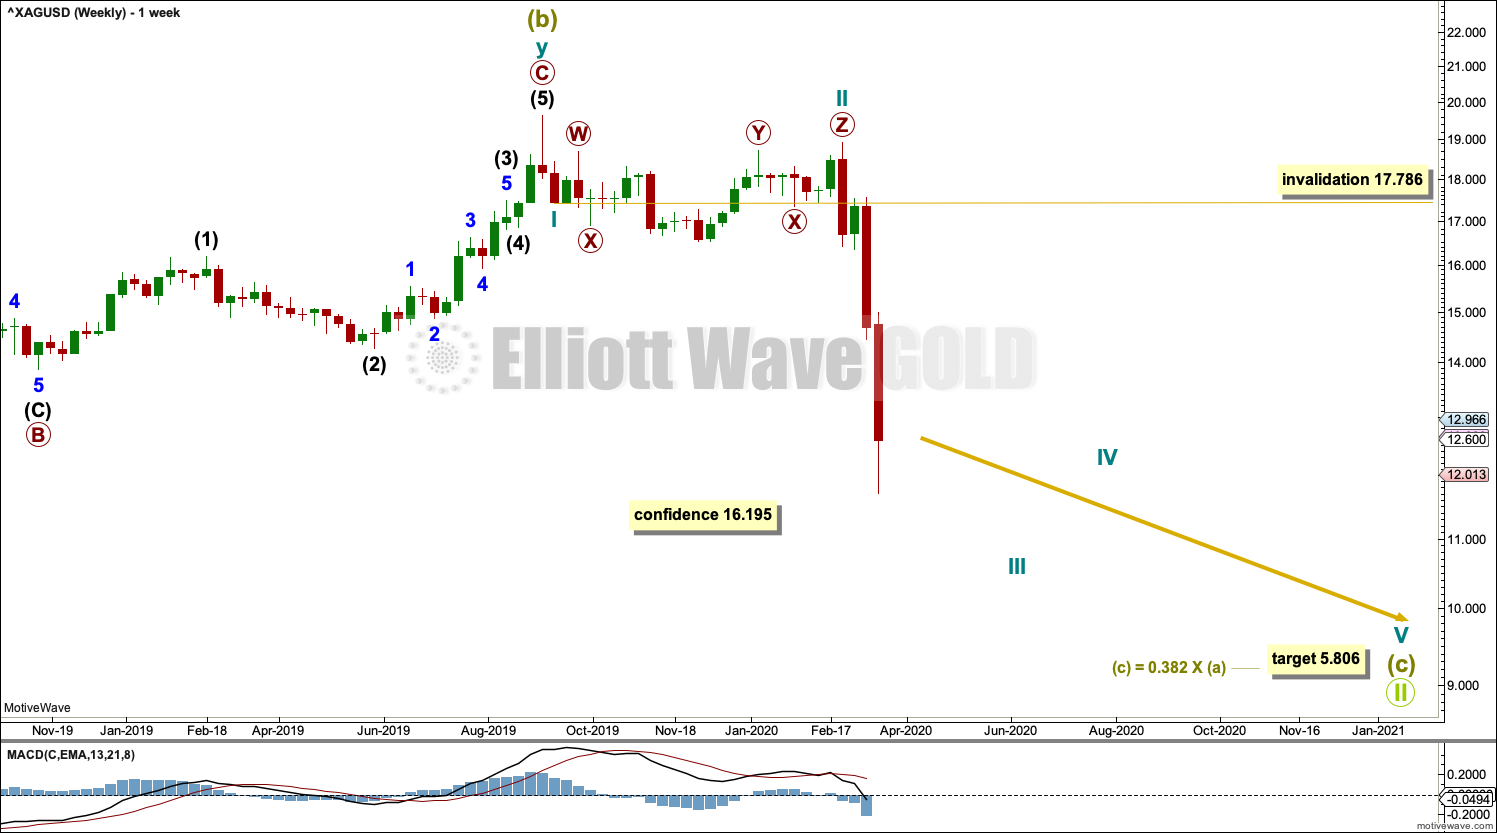
Super Cycle wave (b) may be a complete double combination.
Super Cycle wave (c) must subdivide as a five wave motive structure, most likely an impulse. This week labelling within Super Cycle wave (c) is moved up one degree.
Cycle waves I and II may be complete. This last two weeks of very strong downwards movement may have been the middle of cycle wave III. Cycle wave IV may not move into cycle wave I price territory above 17.786.
DAILY CHART
Click chart to enlarge.
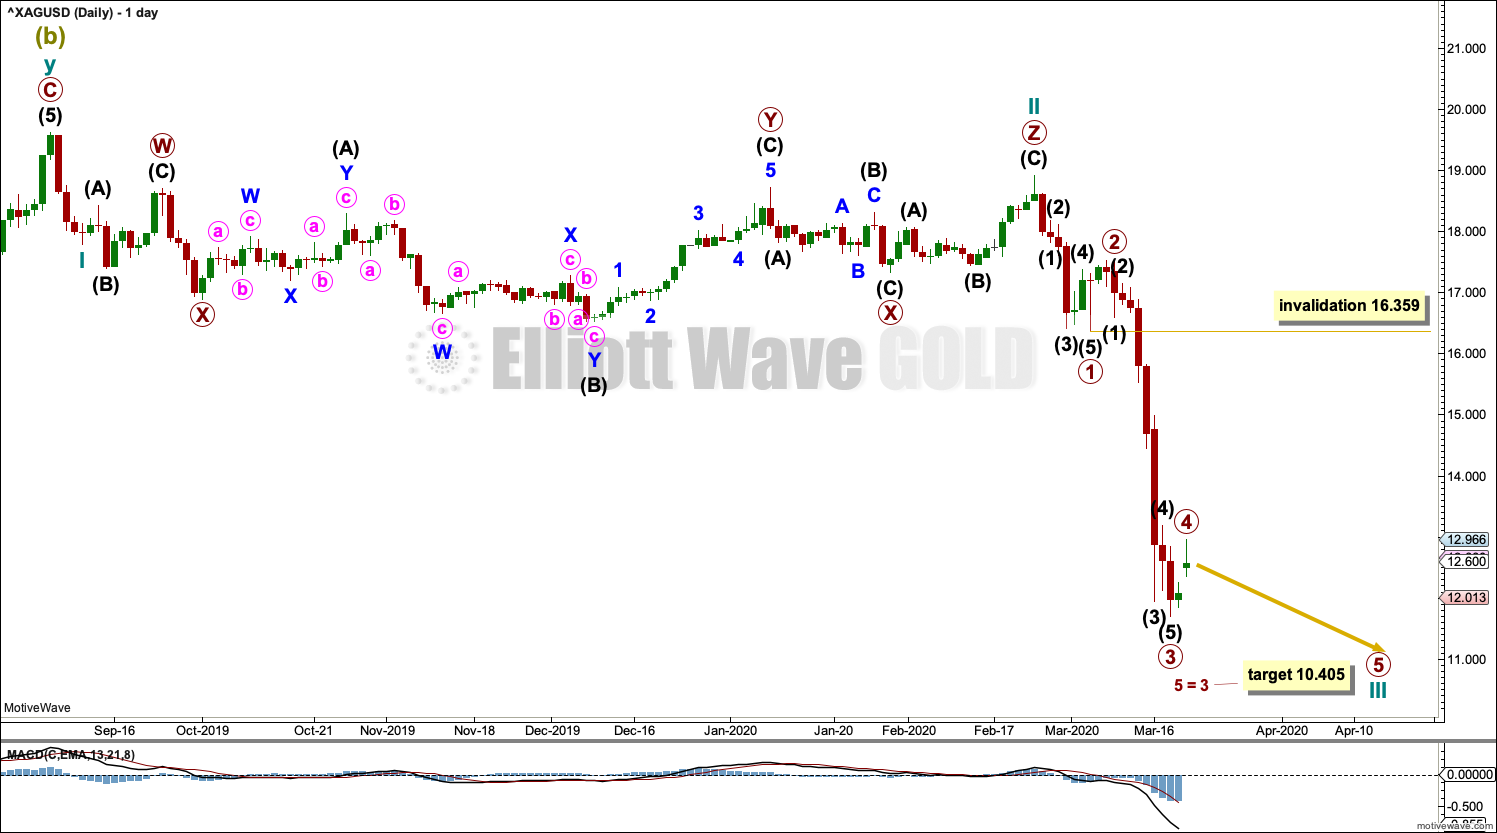
Cycle waves I and II may be complete. Cycle wave III may only subdivide as an impulse and may be incomplete.
Within cycle wave III, primary waves 1 through to 4 may be complete. A target is calculated for cycle wave III to end based upon primary degree. If primary wave 4 moves higher, then the target must be recalculated.
Primary wave 4 may not move into primary wave 1 price territory above 16.359.
Primary wave 5 to end cycle wave III may show a further increase in downwards momentum. It may end with a selling climax.
ALTERNATE WAVE COUNT
This week a new low below 13.882 has fully invalidated any bullish alternate.
TECHNICAL ANALYSIS
WEEKLY CHART
Click chart to enlarge. Chart courtesy of StockCharts.com.
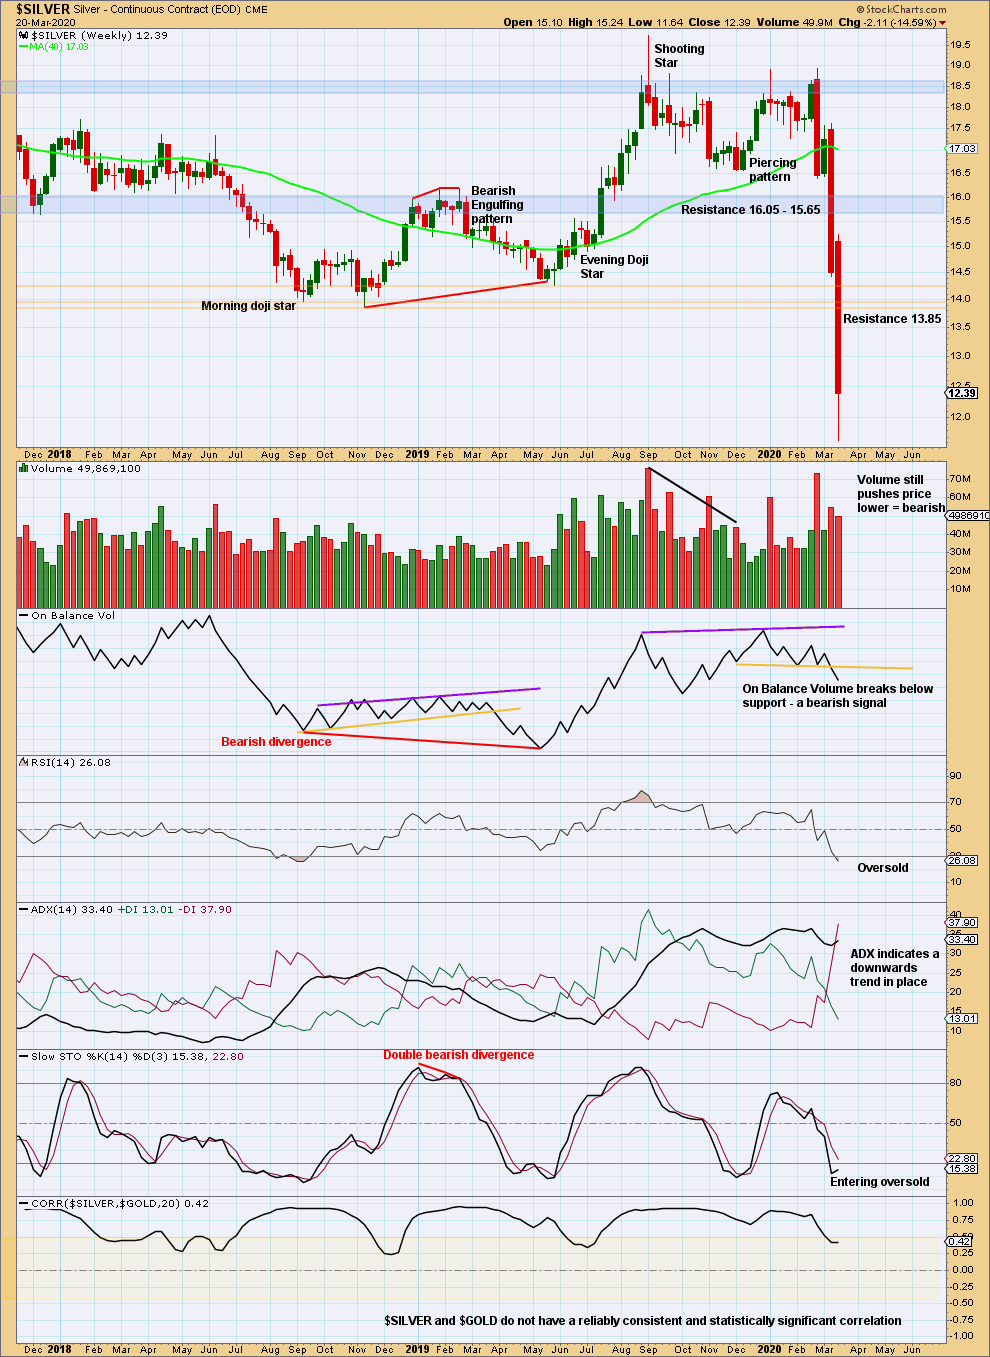
A slightly long lower wick this week suggests a bounce; but if price does bounce here, it may be short lived. At this stage, there is no evidence of a sustainable low in place.
DAILY CHART
Click chart to enlarge. Chart courtesy of StockCharts.com.
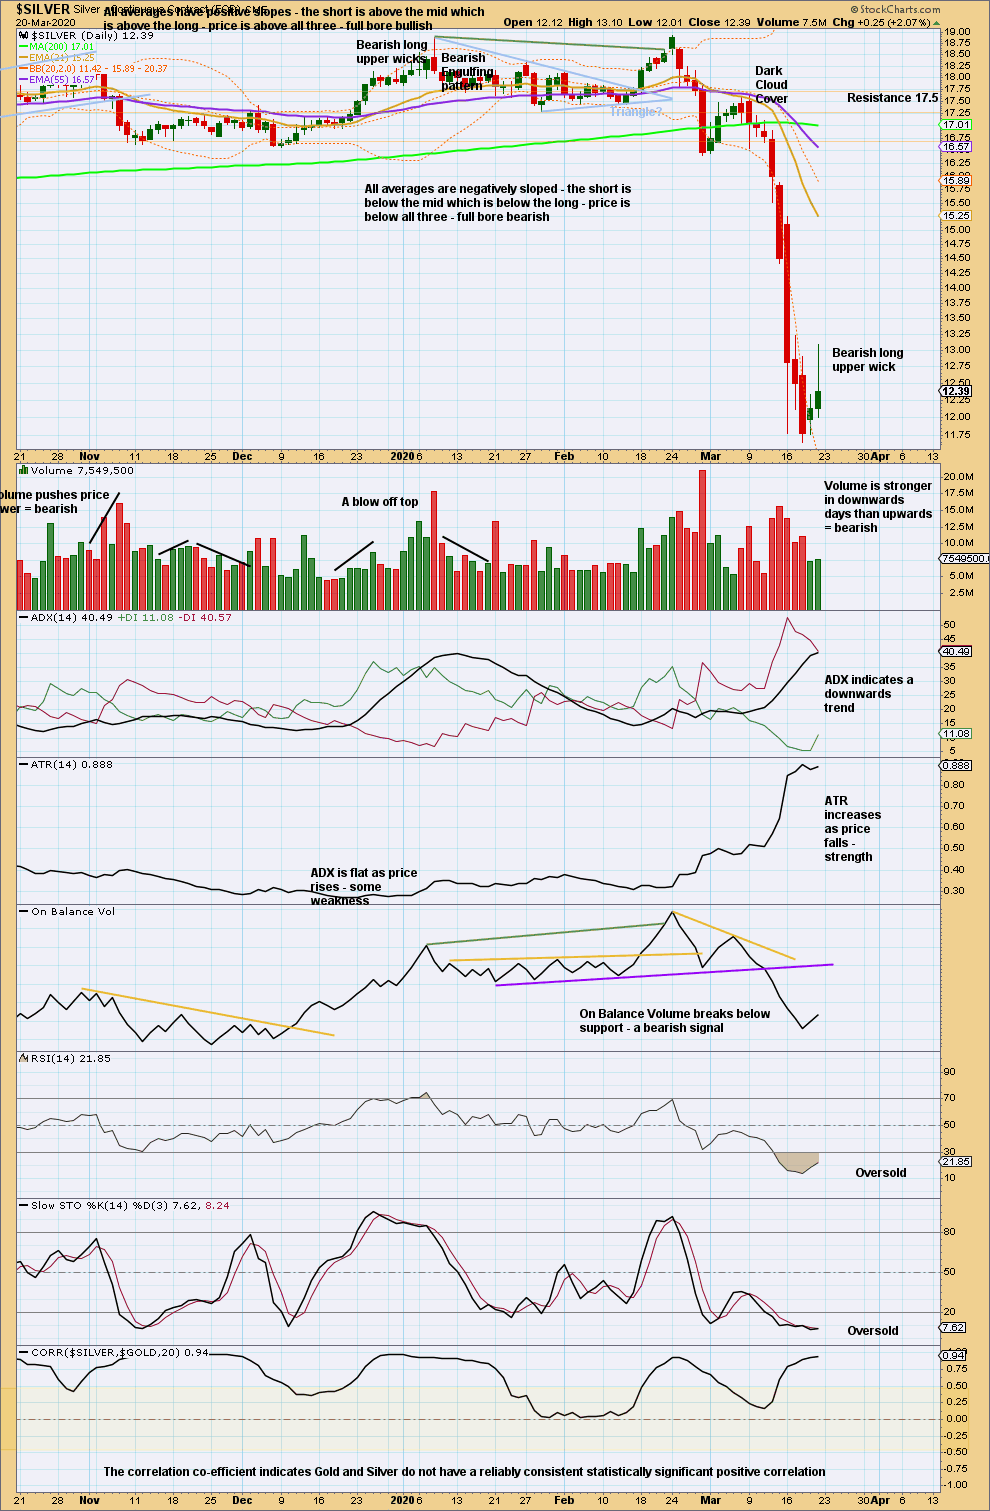
There is a downwards trend. RSI may reach further oversold and Stochastics may remain oversold for long periods of time when this market trends.
For the short term, the bearish upper wick suggests this bounce may be over here or very soon.
Published @ 09:46 p.m. EST.
—
Careful risk management protects your trading account(s).
Follow my two Golden Rules:
1. Always trade with stops.
2. Risk only 1-5% of equity on any one trade.
—
New updates to this analysis are in bold.