
US OIL: Elliott Wave and Technical Analysis | Charts – March 20, 2020
Price continues to fall toward the final target.
Summary: A short to mid-term target for intermediate wave (3) is at 11.92. Intermediate wave (4) may be a multi-day interruption to the downwards trend. Thereafter, the downwards trend may resume to a final target at 9.77.
MAIN ELLIOTT WAVE COUNT – BEARISH
MONTHLY CHART
Click chart to enlarge.
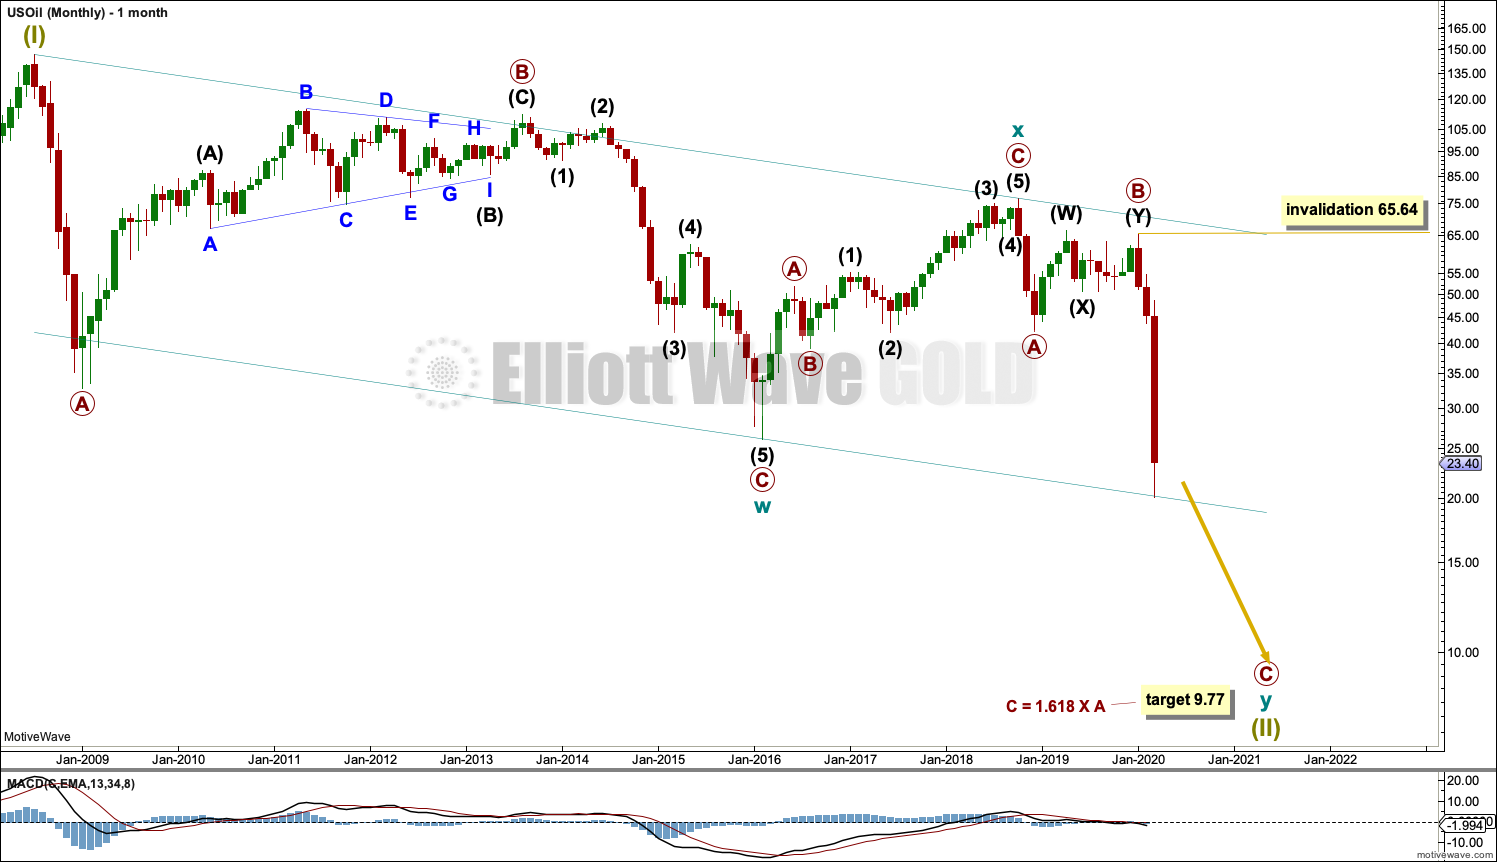
The basic Elliott wave structure is five steps forward and three steps back. This Elliott wave count expects that US Oil is still within a three steps back pattern, which began in July 2008. The Elliott wave count expects that the bear market for US Oil continues.
This Elliott wave corrective structure is a double zigzag, which is a fairly common structure. The correction is labelled Super Cycle wave (II).
The first zigzag in the double is complete and labelled cycle wave w. The double is joined by a three in the opposite direction labelled cycle wave x, which subdivides as a zigzag. The second zigzag in the double may now have begun, labelled cycle wave y.
The purpose of a second zigzag in a double zigzag is to deepen the correction when the first zigzag does not move price deep enough. To achieve this purpose cycle wave y may be expected to move reasonably below the end of cycle wave w at 26.06. This purpose has now been achieved. The next thing to look for is a complete structure within primary wave C.
Primary wave C has passed equality in length with primary wave A at 31.11. The next Fibonacci ratio of 1.618 is used to calculate a target for primary wave C and cycle wave y to end.
Cycle wave y is expected to subdivide as a zigzag, which subdivides 5-3-5.
Cycle wave w lasted 7.6 years and cycle wave x lasted 2.7 years. Cycle wave y now looks like it may be over within a few more months.
Within primary wave C, no second wave correction may move beyond the start of its first wave above 65.64.
A channel is drawn about Super Cycle wave (II): draw the first trend line from the start of cycle wave w to the end of cycle wave x, then place a parallel copy on the end of cycle wave w. Currently, price is bouncing up off the lower edge of the channel. This lower trend line may provide support and initiate a multi-day or multi-week bounce prior to the next target.
WEEKLY CHART
Click chart to enlarge.
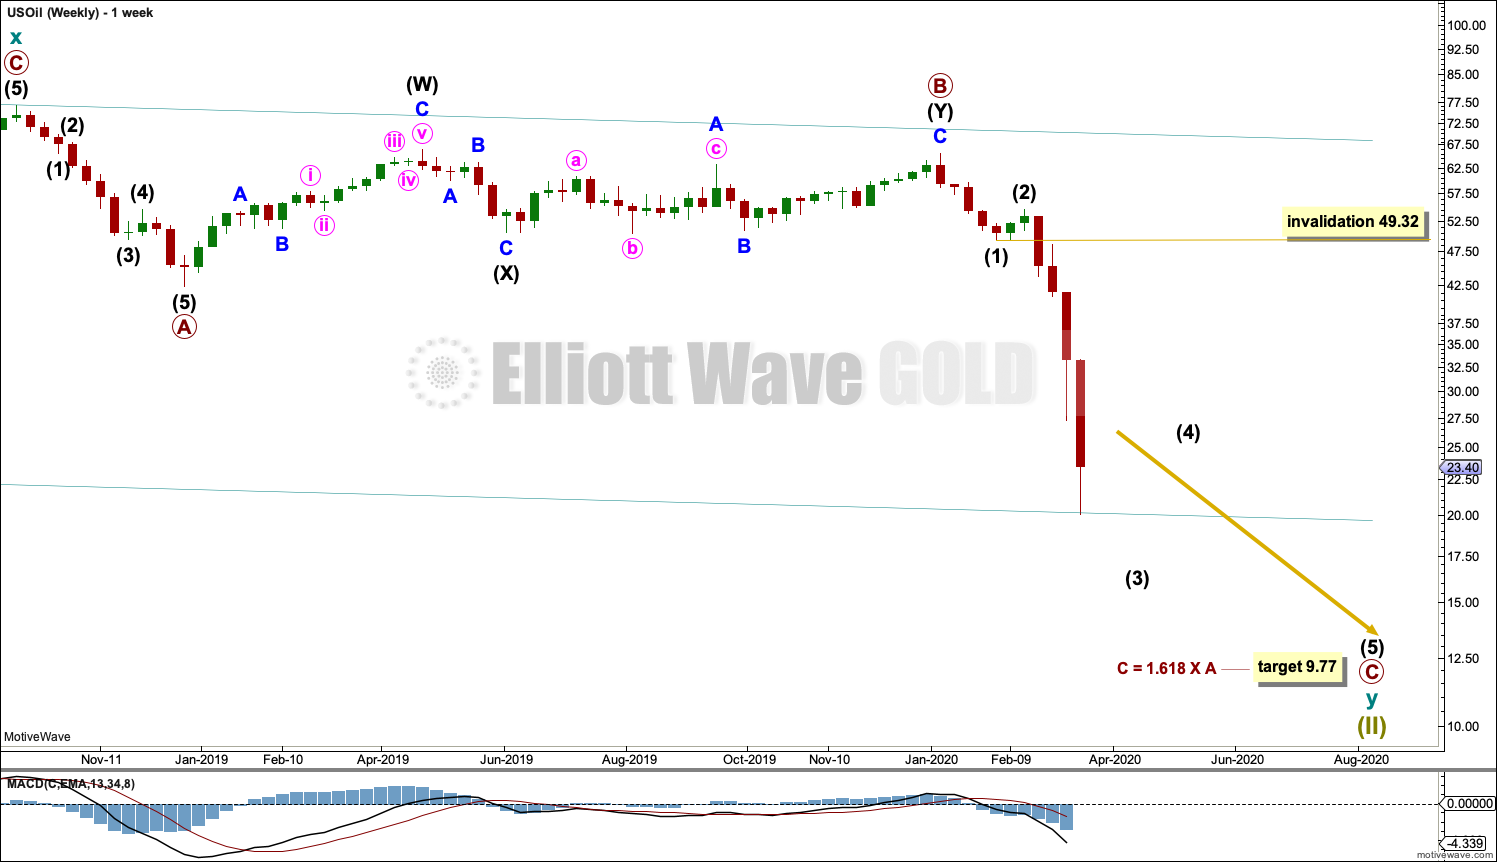
This weekly chart shows all of cycle wave y so far.
Cycle wave y is expected to subdivide as a zigzag. A zigzag subdivides 5-3-5.
Primary wave C must subdivide as a five wave motive structure, most likely an impulse. Within primary wave C, intermediate waves (1) and (2) may be complete. Intermediate wave (3) may be incompete.
If this analysis is wrong, it may be in expecting intermediate wave (3) to continue lower. It is possible that intermediate wave (3) may end here at support at the lower edge of the large channel copied over from the monthly chart. For confidence in the short to mid-term target on the daily chart below, the lower edge of the channel needs to be breached.
Intermediate wave (4) may not move into intermediate wave (1) price territory above 49.32.
DAILY CHART
Click chart to enlarge.
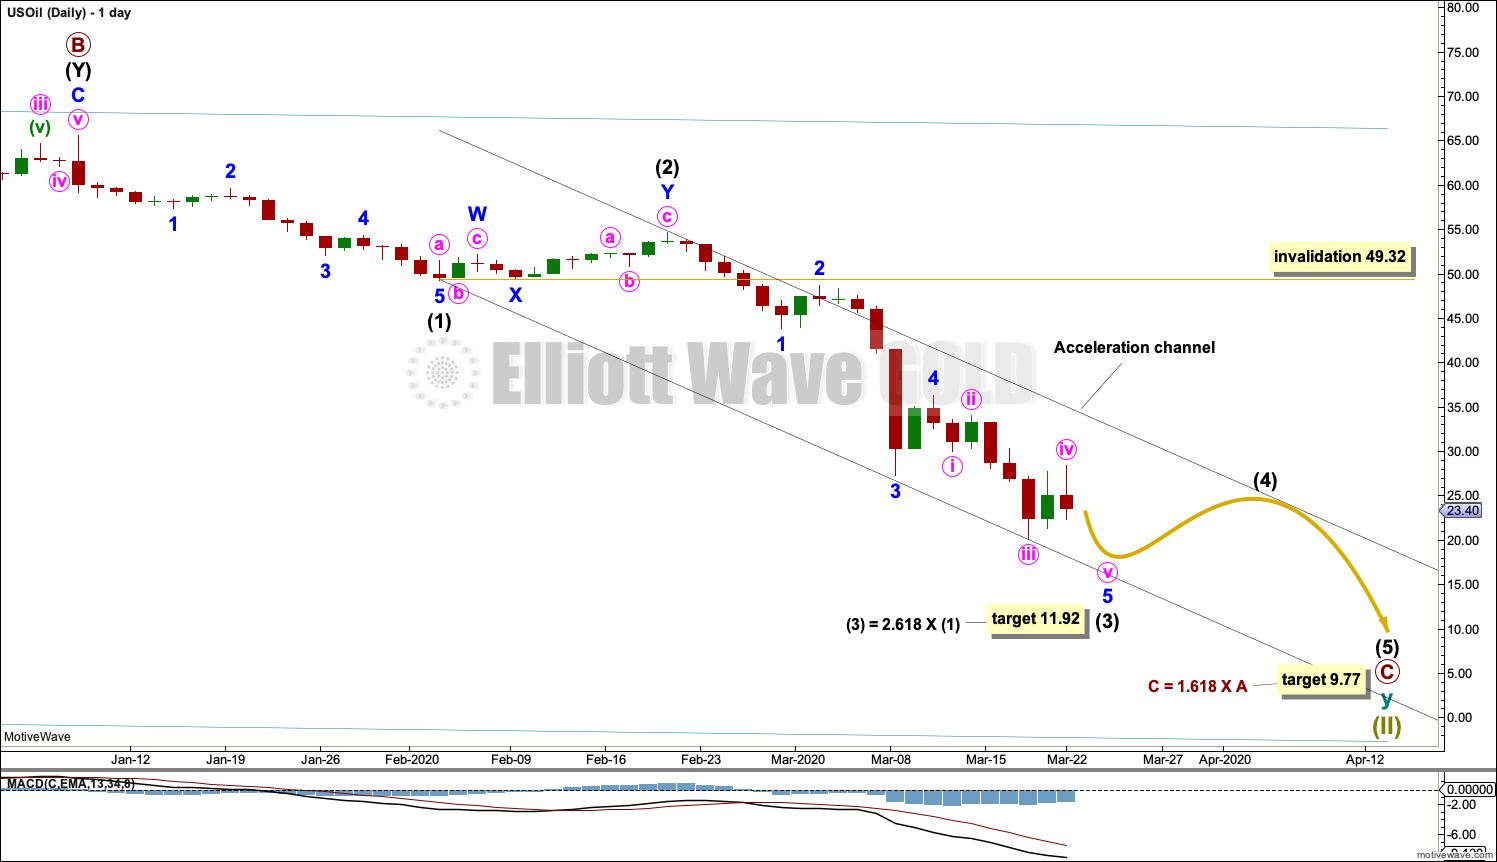
Primary wave C must subdivide as a five wave motive structure, most likely an impulse. Within primary wave C, intermediate waves (1) and (2) may now be complete.
A new target is calculated for intermediate wave (3) to end.
Draw an acceleration channel about primary wave C: draw the first trend line from the end of intermediate wave (1) to the last low, then place a parallel copy on the end of intermediate wave (2). Keep redrawing the channel as price moves lower. Intermediate wave (4) may find resistance at the upper edge of the channel.
When intermediate wave (4) may be complete, then the final target may be calculated at intermediate, primary and cycle degrees. At that stage, the target may change or may widen to a zone.
ALTERNATE ELLIOTT WAVE COUNT
This week the alternate bullish wave count (which was judged to have a lower probability) has been invalidated with a new low below 26.06. There is now only wave count left for Oil.
TECHNICAL ANALYSIS
MONTHLY CHART
Click chart to enlarge. Chart courtesy of StockCharts.com.
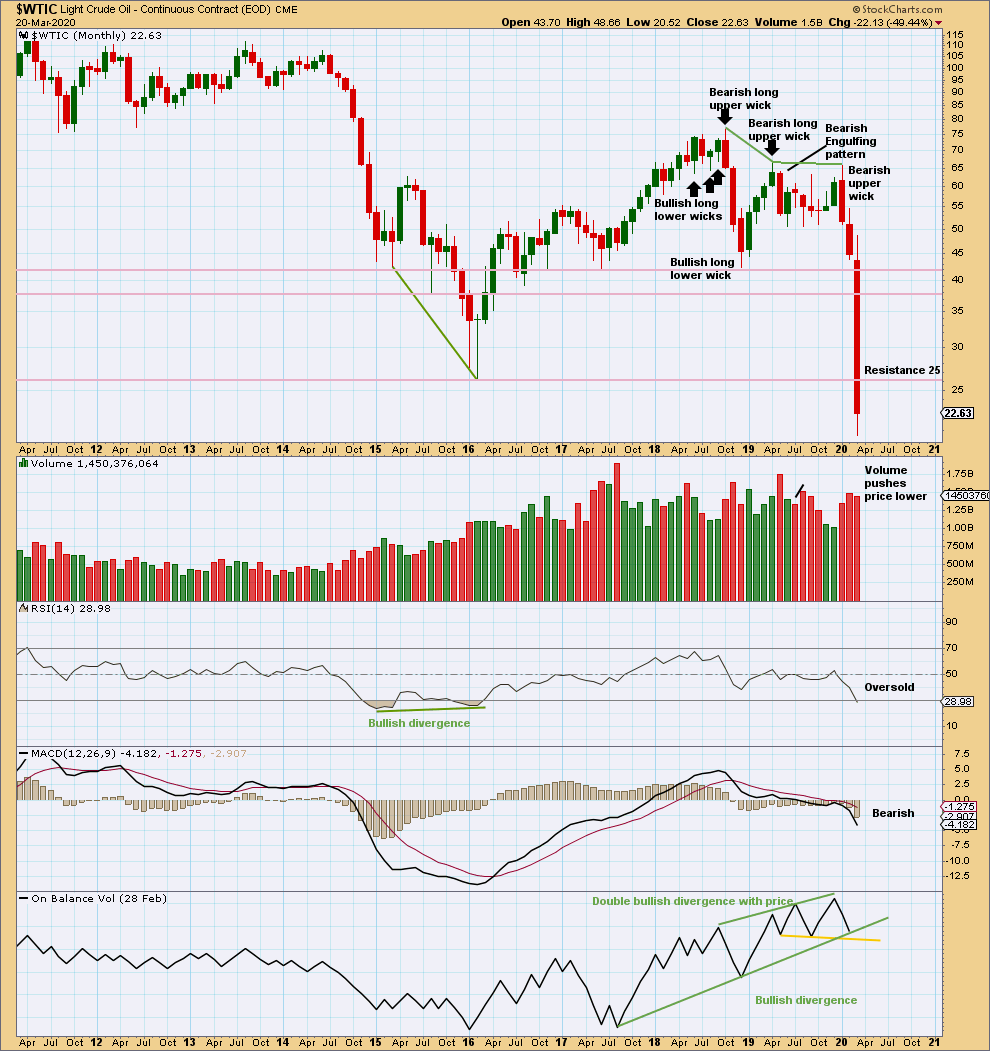
When this market trends strongly down, it can reach extreme and yet price can continue for a reasonable distance.
A sustainable low may not yet be in place. Look for RSI to reach more deeply oversold and then to exhibit bullish divergence with price at swing lows.
WEEKLY CHART
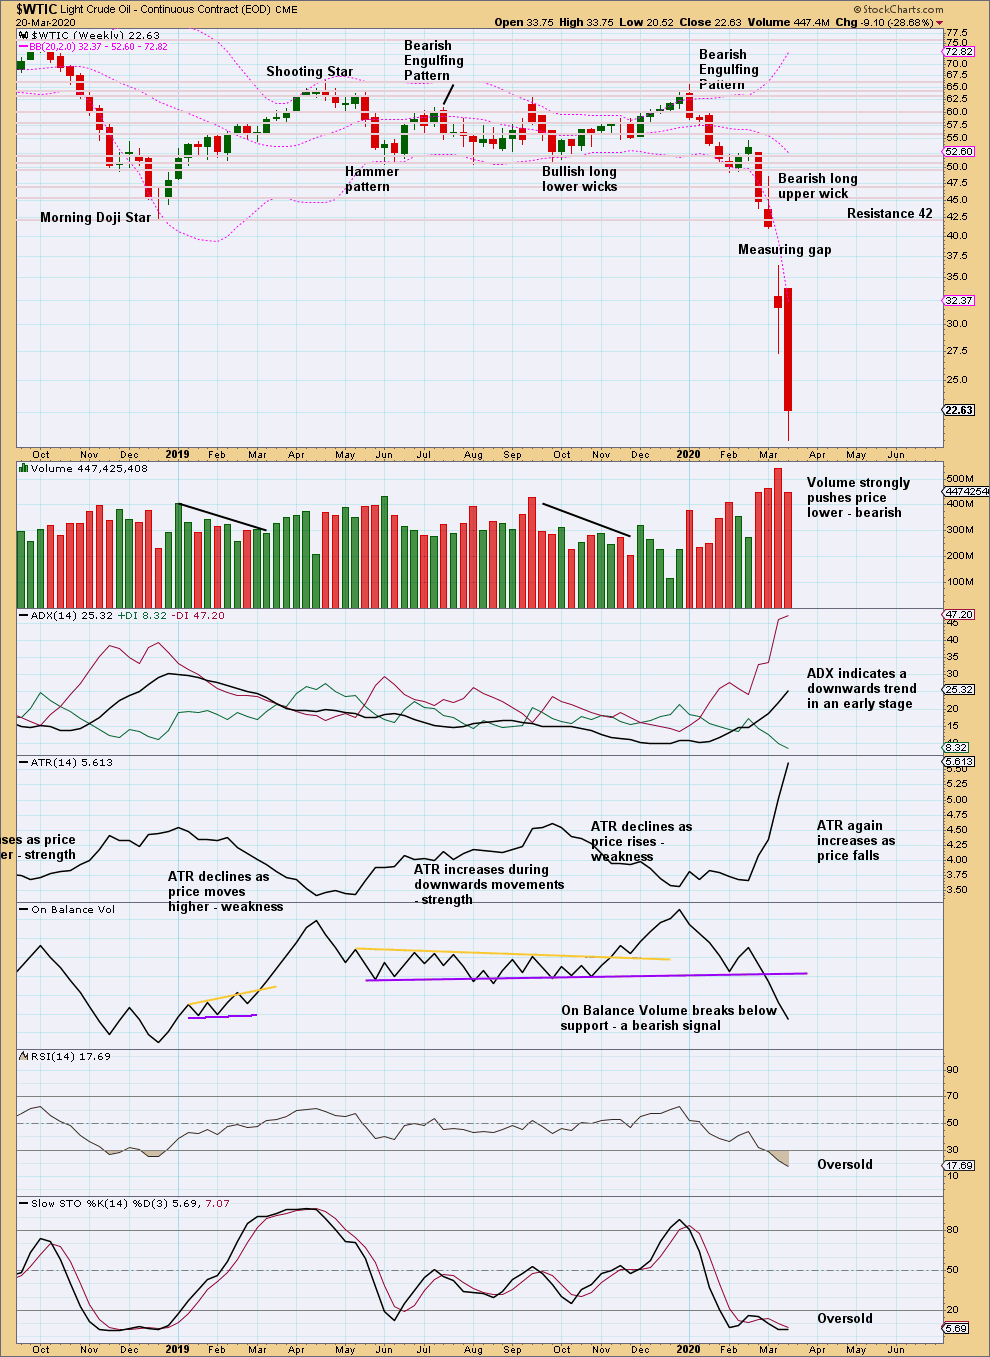
Click chart to enlarge. Chart courtesy of StockCharts.com.
This measuring gap gives a target at 22.74, which has now been met and slightly exceeded. A bounce may develop about here.
Overall, expect the downwards trend to continue (but keep in mind price does not move in straight lines).
DAILY CHART
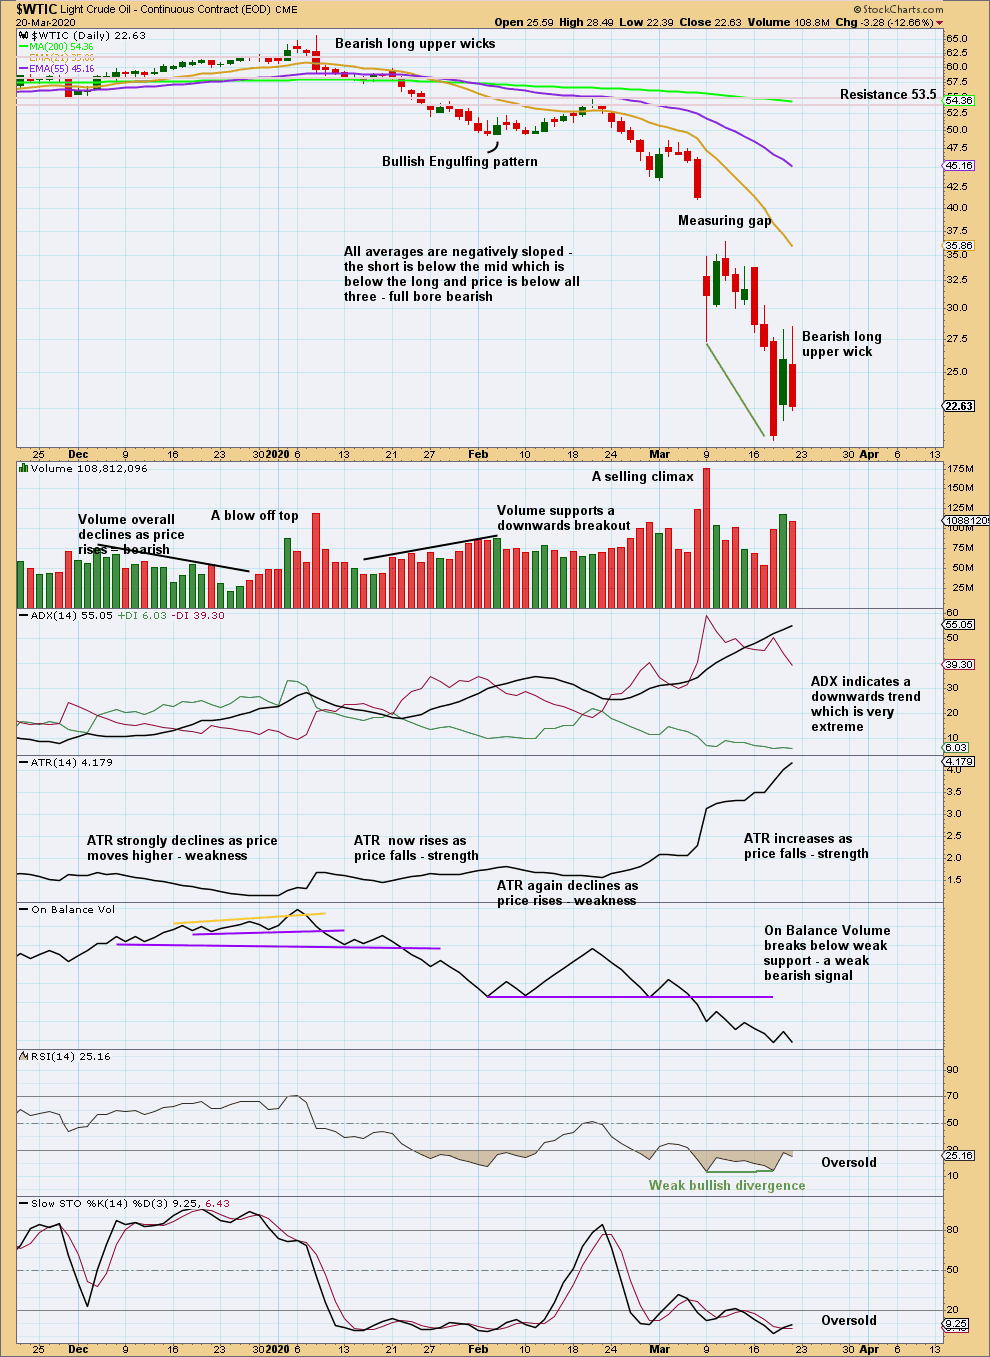
Click chart to enlarge. Chart courtesy of StockCharts.com.
A downwards trend is now in place at all time frames. Both volume and range support this trend.
RSI and Stochastics may remain very extreme for reasonable periods of time when this market trends. ADX may also remain very extreme for reasonable periods of time.
Bullish divergence between price and RSI is too weak to indicate a sustainable low.
Published @ 08:55 p.m. EST.
—
Careful risk management protects your trading account(s).
Follow my two Golden Rules:
1. Always trade with stops.
2. Risk only 1-5% of equity on any one trade.
—
New updates to this analysis are in bold.