
SILVER: Elliott Wave and Technical Analysis | Charts – April 10, 2020
Sideways movement was expected to continue with resistance about 14.46 or 16.16. Price remains within this range with a high this week at 15.492.
Summary: A bounce may end about 16.783. Thereafter, the downwards trend may resume. The final target is at 5.806.
ELLIOTT WAVE COUNTS
MAIN WAVE COUNT
MONTHLY CHART
Click chart to enlarge.
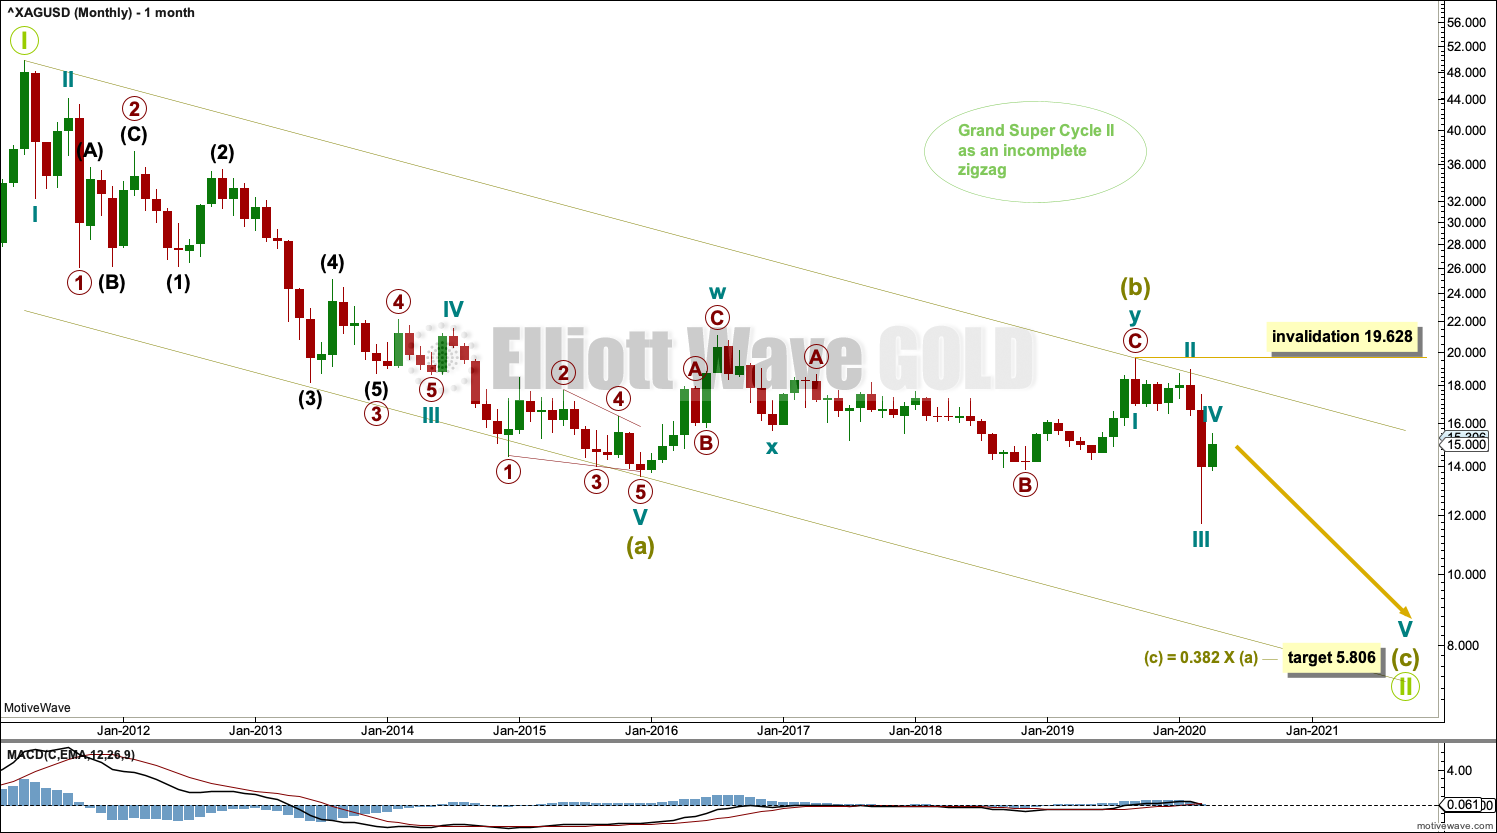
The bear market for Silver may be incomplete. Within a bearish movement, in the middle there should be a large interruption to the trend in the form of a B wave; bearish movements should have a three wave look to them. This wave count expects that normal look.
This Elliott wave structure for this bear market is labelled as a single zigzag for Grand Super Cycle wave II. Single zigzags are the most common Elliott wave corrective structure.
Within the zigzag, Super Cycle wave (a) subdivides as a five wave impulse, and Super Cycle wave (b) may now be a complete double combination. Super Cycle wave (c) may have begun and must subdivide as a five wave motive structure, either an impulse (much more likely) or an ending diagonal (less likely but still possible).
A target is now calculated for Super Cycle wave (c) to complete the zigzag for Grand Super Cycle wave II. Calculations using the more common ratios of equality and 0.618 yield negative results, so the next Fibonacci ratio in the sequence of 0.382 is used.
Within Super Cycle wave (c), no second wave correction may move beyond its start above 19.628.
Draw a channel about the zigzag of Grand Super Cycle wave II: draw the first trend line from the start of Super Cycle wave (a) to the end of Super Cycle wave (b), then place a parallel copy on the end of Super Cycle wave (a). The lower edge of then channel may provide support and may show where Grand Super Cycle wave II finally ends.
WEEKLY CHART
Click chart to enlarge.
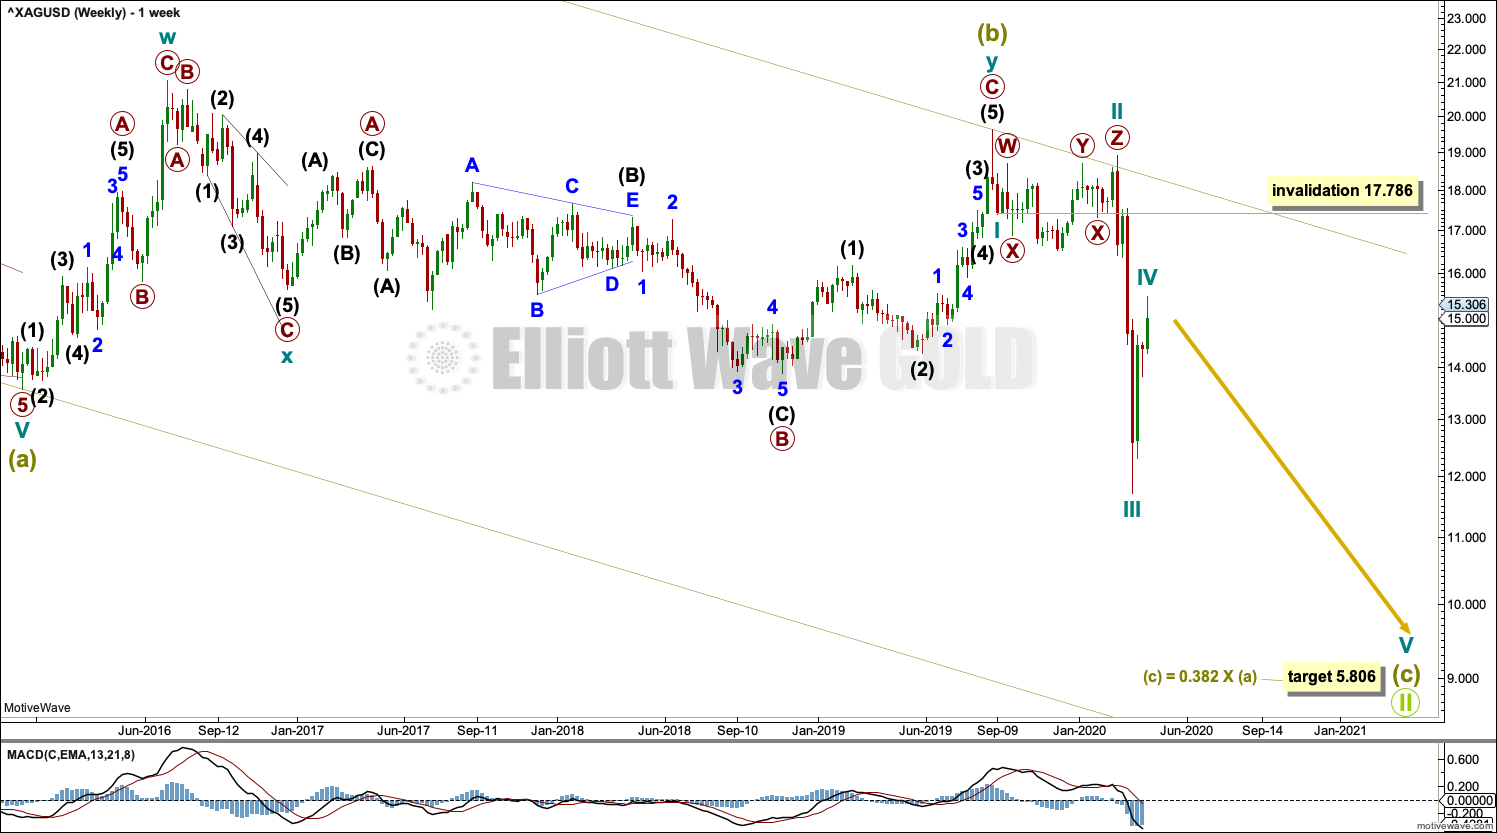
Super Cycle wave (b) may be a complete double combination.
Super Cycle wave (c) must subdivide as a five wave motive structure, most likely an impulse.
Cycle waves I through to III may be complete. Cycle wave IV may not move into cycle wave I price territory above 17.786.
DAILY CHART
Click chart to enlarge.
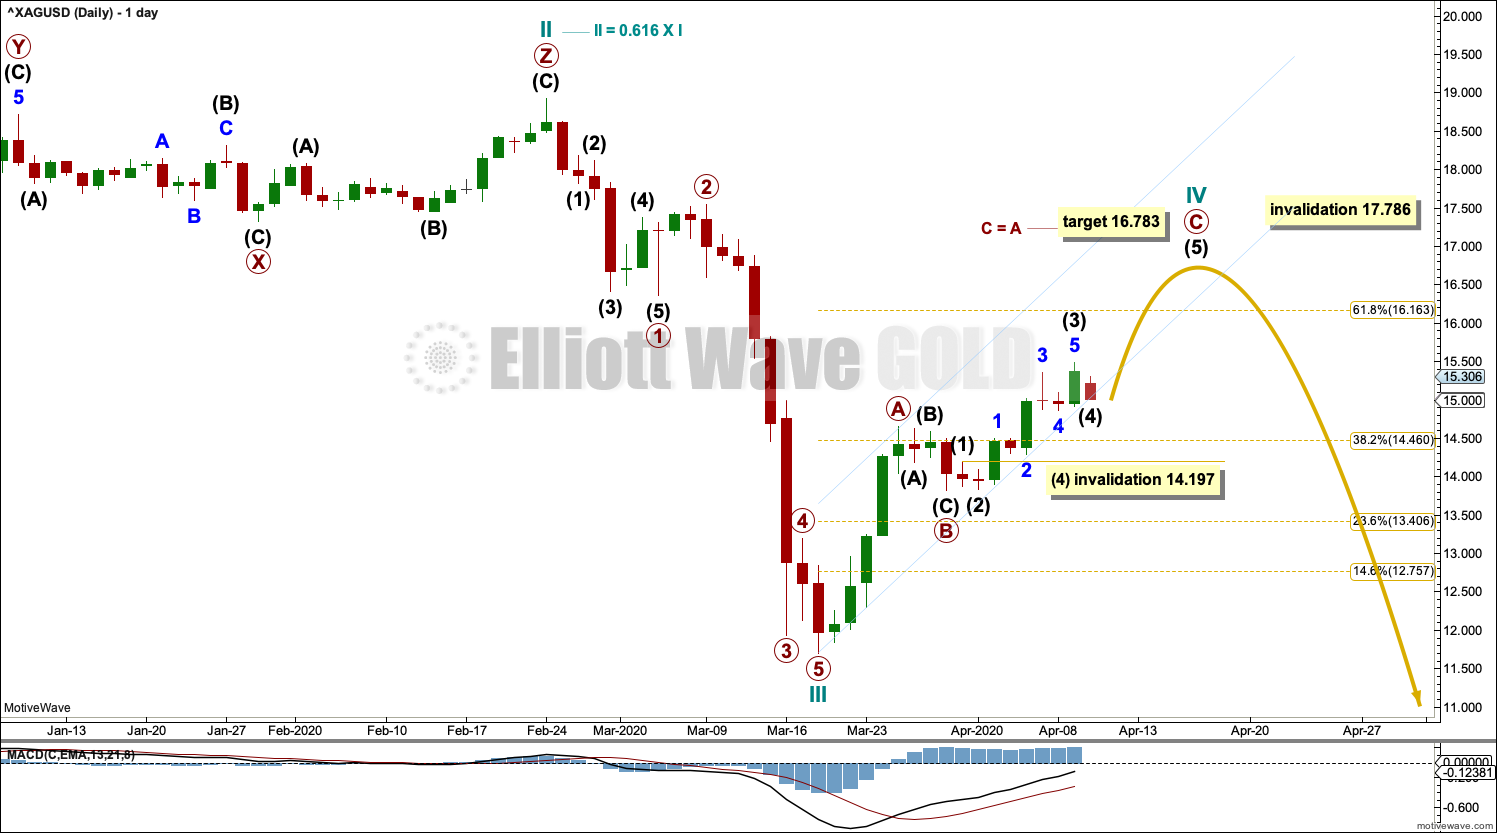
Cycle wave IV has begun. Cycle wave IV may not move into cycle wave I price territory above 17.786.
Cycle wave II was a rare triple combination that lasted 24 weeks and was deep at 0.616 of cycle wave I. Cycle wave IV may exhibit alternation as a zigzag, although it may subdivide as any Elliott wave corrective structure. Cycle wave IV is no longer shallow and may not exhibit alternation in depth. Alternation is a guideline and not a rule, and is not always seen.
Cycle wave IV may be more brief than cycle wave II; fourth waves tend to be more brief than second waves in commodities, particularly if fourth waves are zigzags. However, it may still be expected to last at least a few weeks.
Cycle wave IV may be subdividing as a zigzag. Within Cycle wave IV: primary wave B may be complete and primary wave C may be continuing higher. Within primary wave C: intermediate wave (4) may not move into intermediate wave (1) price territory below 14.197.
Draw a best fit channel about the zigzag of cycle wave IV. Assume the bounce may continue while price remains within the channel. If price breaks below the channel with a full daily candlestick below and not touching the lower edge, then assume cycle wave IV may be over and the downwards trend may have resumed. A new low below 14.197 would add confidence that the downwards trend may have resumed.
TECHNICAL ANALYSIS
WEEKLY CHART
Click chart to enlarge. Chart courtesy of StockCharts.com.
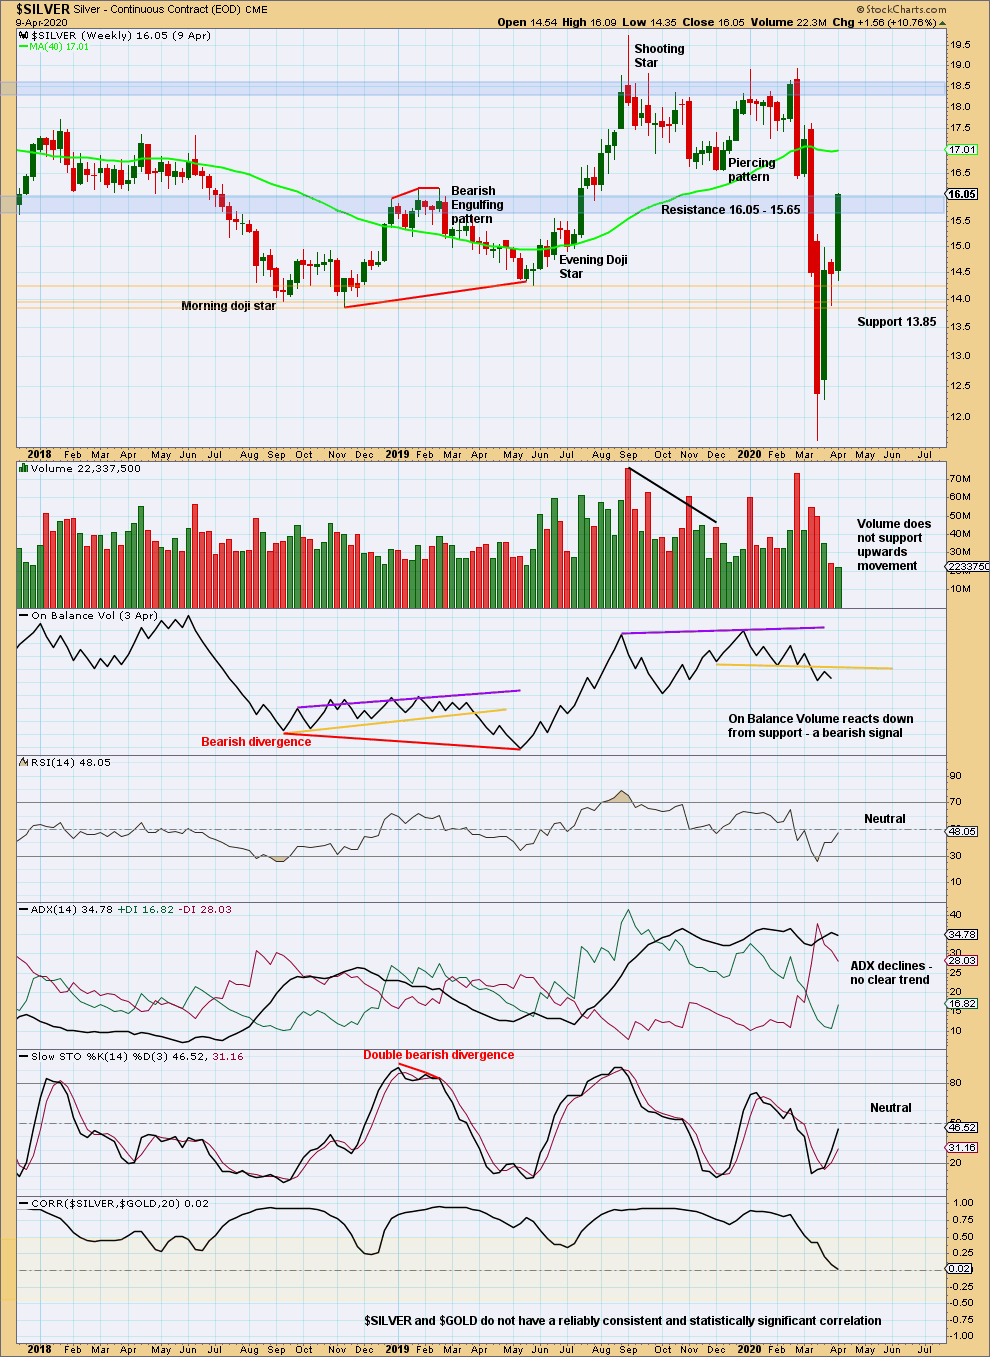
A close near highs for the week suggests more upwards movement next week. It may be limited though because volume does not support upwards movement.
DAILY CHART
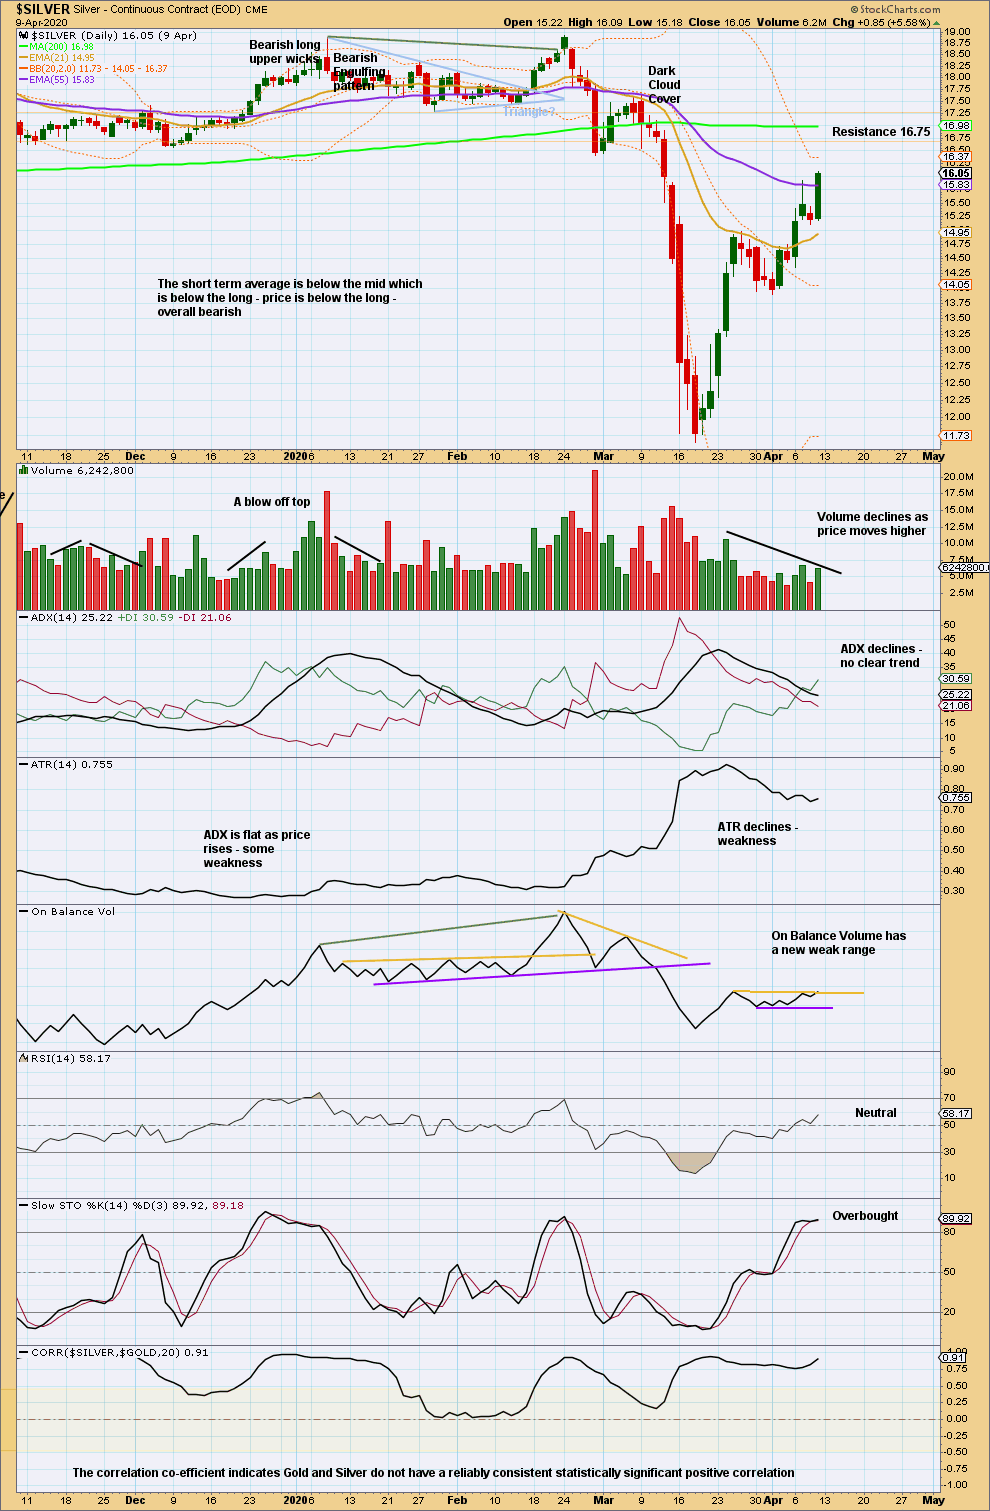
Click chart to enlarge. Chart courtesy of StockCharts.com.
A close near highs for the last session suggests more upwards movement next week. Overall, volume does not support upwards movement, but with a small increase for the last session for the short term more upwards movement is suggested.
Published @ 12:05 p.m. EST on April 11, 2020.
—
Careful risk management protects your trading account(s).
Follow my two Golden Rules:
1. Always trade with stops.
2. Risk only 1-5% of equity on any one trade.
—
New updates to this analysis are in bold.