
US OIL: Elliott Wave and Technical Analysis | Charts – April 17, 2020
Downwards movement continues towards long held targets exactly as expected.
Summary: Assume the downwards trend remains while price remains within the channel on the daily chart. There are now two final targets. The first is at 12.82. If price reaches this first target and the structure is incomplete, or if price keeps falling through this first target, then the second target is at 9.77.
A new high now above the upper edge of the black channel the daily charts would suggest it could be possible a sustainable low may be in place. This view would require a new high above 49.32 for confidence.
MAIN ELLIOTT WAVE COUNT – BEARISH
MONTHLY CHART
Click chart to enlarge.
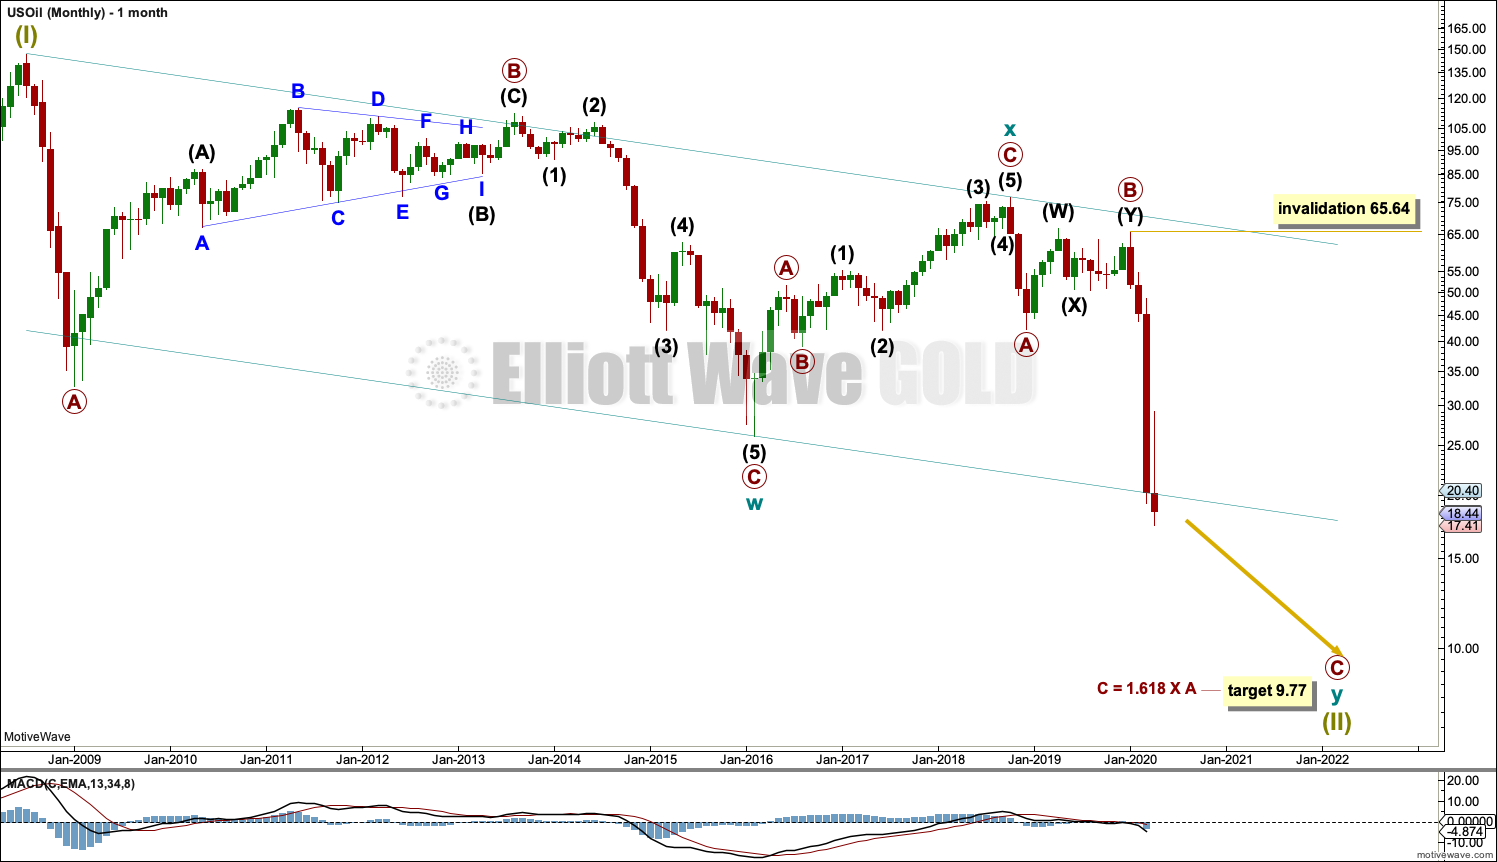
The basic Elliott wave structure is five steps forward and three steps back. This Elliott wave count expects that US Oil is still within a three steps back pattern, which began in July 2008. The Elliott wave count expects that the bear market for US Oil continues.
This Elliott wave corrective structure is a double zigzag, which is a fairly common structure. The correction is labelled Super Cycle wave (II).
The first zigzag in the double is complete and labelled cycle wave w. The double is joined by a three in the opposite direction labelled cycle wave x, which subdivides as a zigzag. The second zigzag in the double is almost complete, labelled cycle wave y.
The purpose of a second zigzag in a double zigzag is to deepen the correction when the first zigzag does not move price deep enough. To achieve this purpose cycle wave y may be expected to move reasonably below the end of cycle wave w at 26.06. This purpose has now been achieved. The next thing to look for is a complete structure within primary wave C.
Primary wave C has passed equality in length with primary wave A at 31.11. The next Fibonacci ratio of 1.618 is used to calculate a target for primary wave C and cycle wave y to end.
Cycle wave y is expected to subdivide as a zigzag, which subdivides 5-3-5.
Cycle wave w lasted 7.6 years and cycle wave x lasted 2.7 years. Cycle wave y now looks like it may be over within a few more weeks.
Within primary wave C, no second wave correction may move beyond the start of its first wave above 65.64.
A channel is drawn about Super Cycle wave (II): draw the first trend line from the start of cycle wave w to the end of cycle wave x, then place a parallel copy on the end of cycle wave w. Price has bounced up off the channel. The target expects this trend line to be breached.
WEEKLY CHART
Click chart to enlarge.
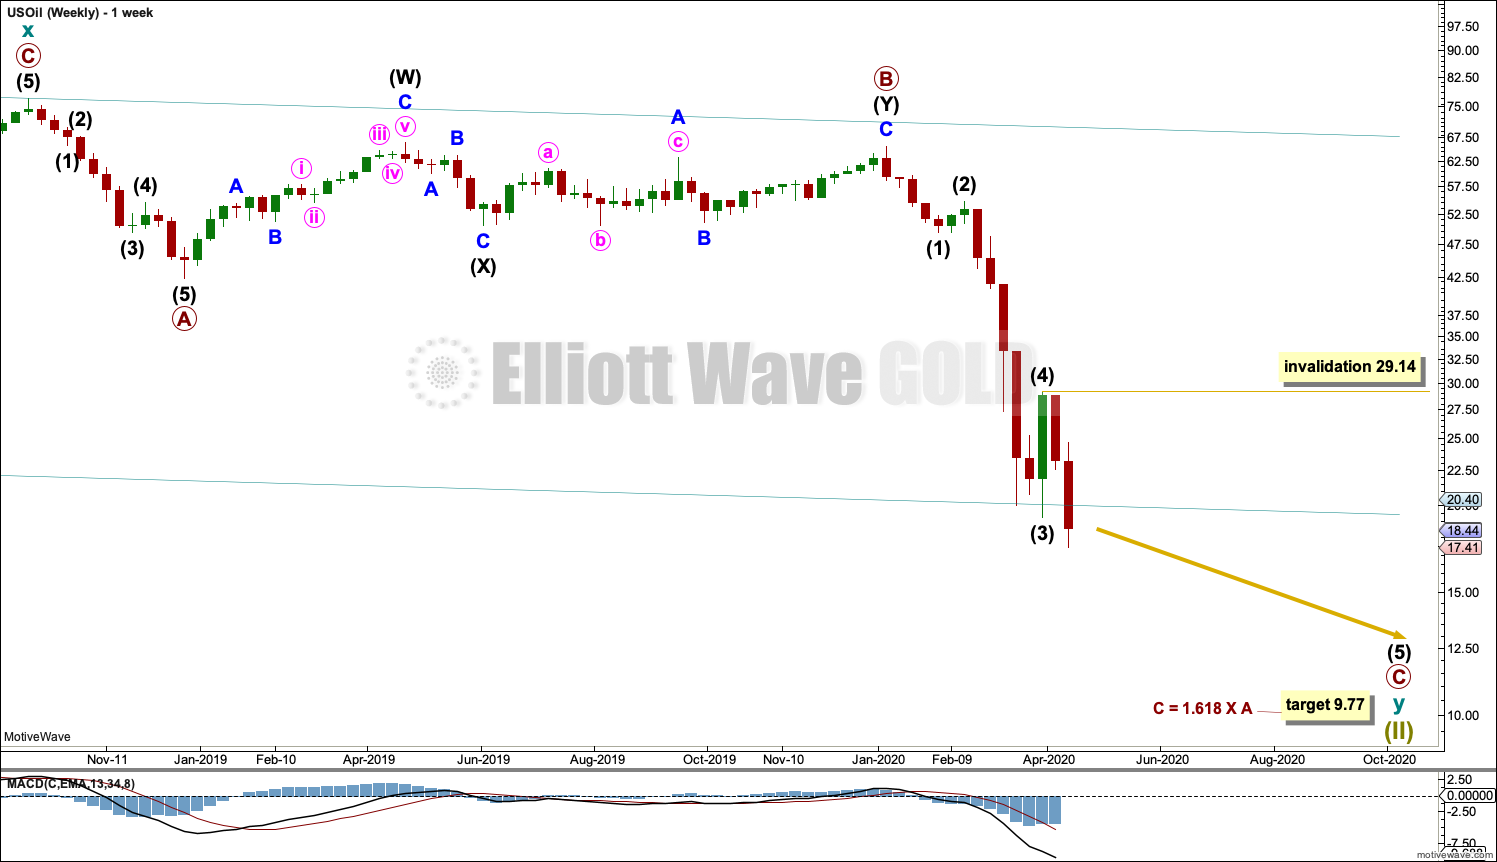
This weekly chart shows all of cycle wave y so far.
Cycle wave y is expected to subdivide as a zigzag. A zigzag subdivides 5-3-5.
Primary wave C must subdivide as a five wave motive structure, most likely an impulse. Within primary wave C, intermediate waves (1) through to (4) may now all be complete. Intermediate wave (5) may be underway.
Within intermediate wave (5): no second wave correction may move beyond its start above 29.14.
DAILY CHART
Click chart to enlarge.
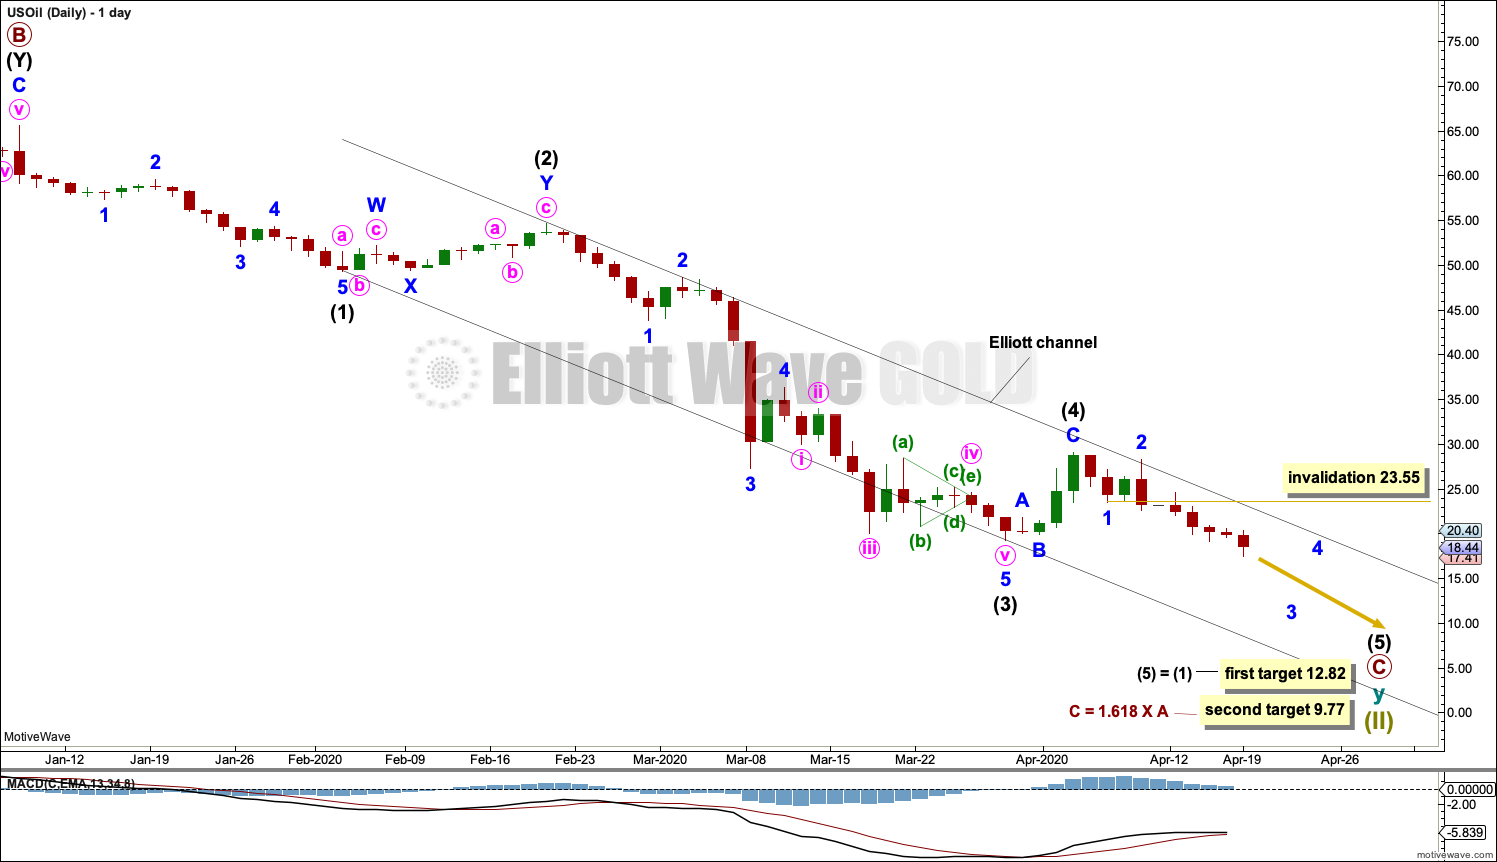
Primary wave C must subdivide as a five wave motive structure, most likely an impulse. Within primary wave C, intermediate waves (1) through to (4) may now be complete.
Draw an Elliott channel about primary wave C: draw the first trend line from the end of intermediate wave (1) to the end of intermediate wave (3), then place a parallel copy on the end of intermediate wave (2). Intermediate wave (4) has found resistance at the upper edge of the channel.
Intermediate wave (5) may only subdivide as a five wave motive structure. It is unfolding as an impulse. Within the impulse: minor wave 4 may not move into minor wave 1 price territory above 23.55.
A new target is calculated at intermediate degree. If price reaches the first target and either the structure is incomplete or price keeps falling, then the second target would be used.
If the Elliott channel is breached by upwards (not sideways) movement, then the alternate wave count below would increase in probability.
ALTERNATE DAILY CHART
Click chart to enlarge.
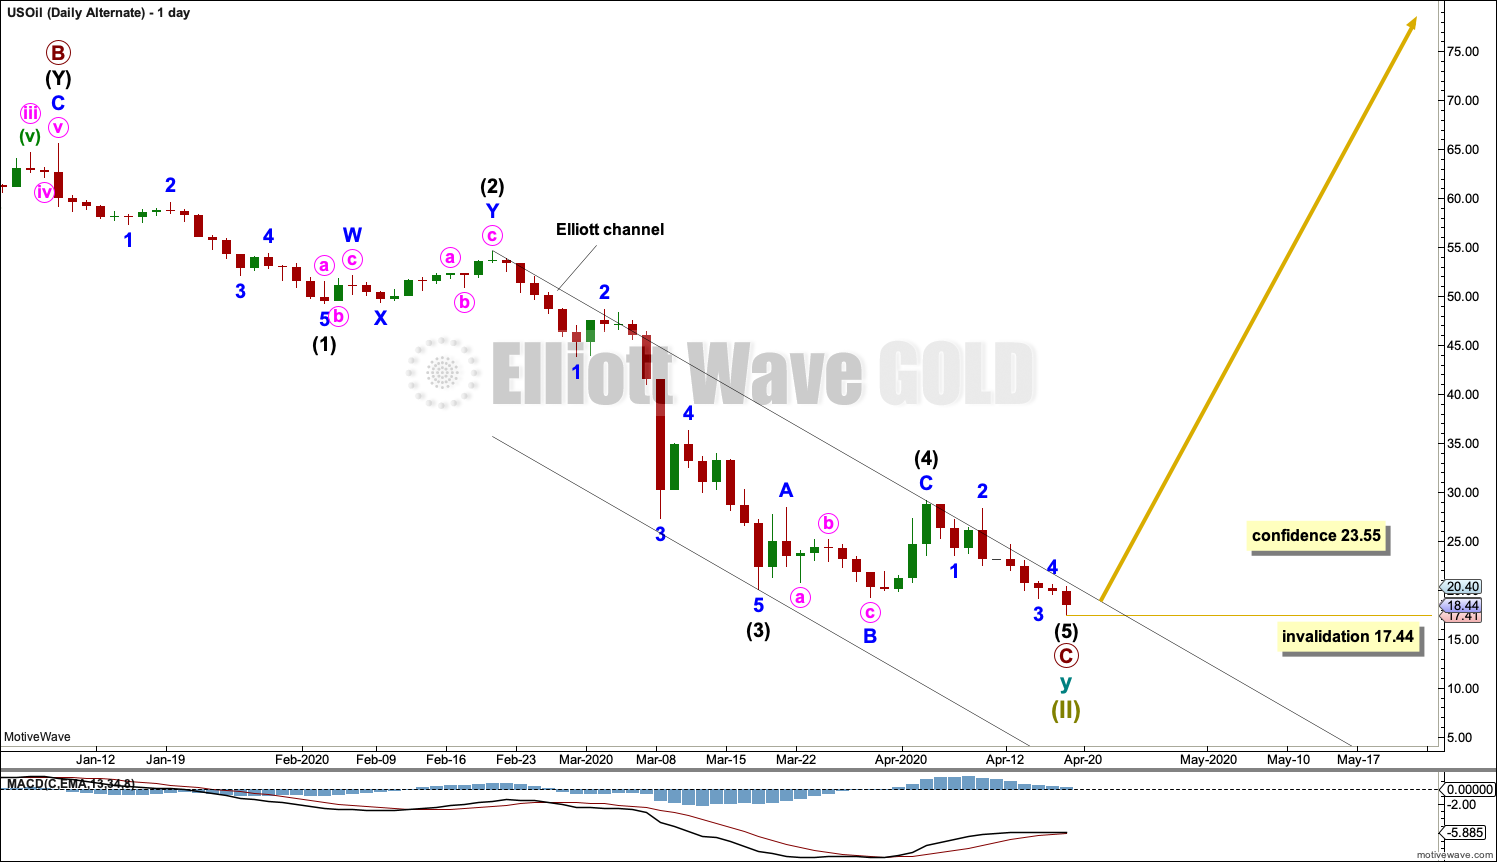
It is again possible that the bear market may now be complete for Oil. Grand Super Cycle wave (II) may be complete at all degrees.
This wave count requires a new high above 23.55 for confidence.
TECHNICAL ANALYSIS
MONTHLY CHART
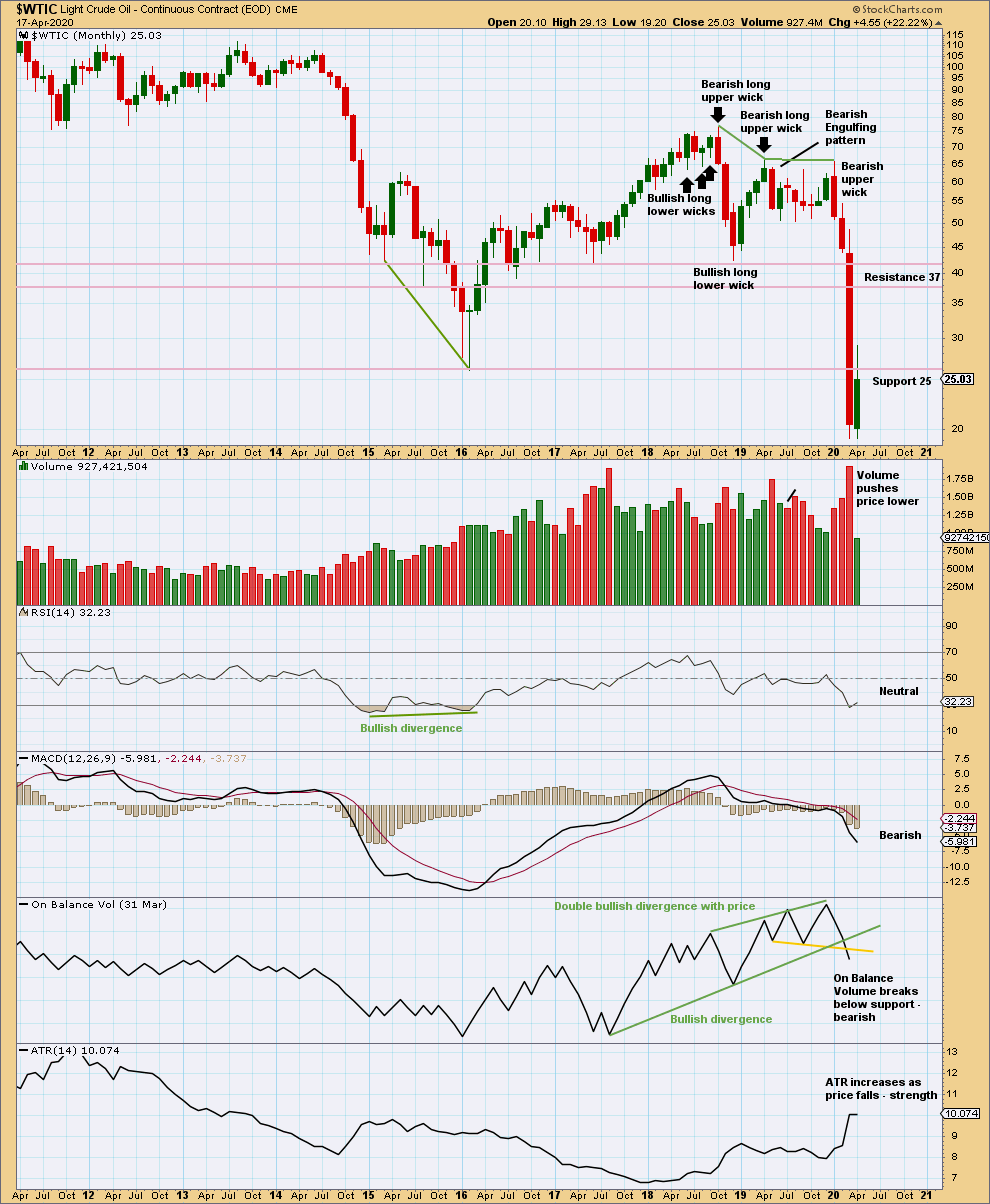
Click chart to enlarge. Chart courtesy of StockCharts.com.
When this market trends strongly down, it can reach extreme and yet price can continue for a reasonable distance.
A sustainable low may not yet be in place. Look for RSI to reach more deeply oversold and then to exhibit bullish divergence with price at swing lows.
WEEKLY CHART
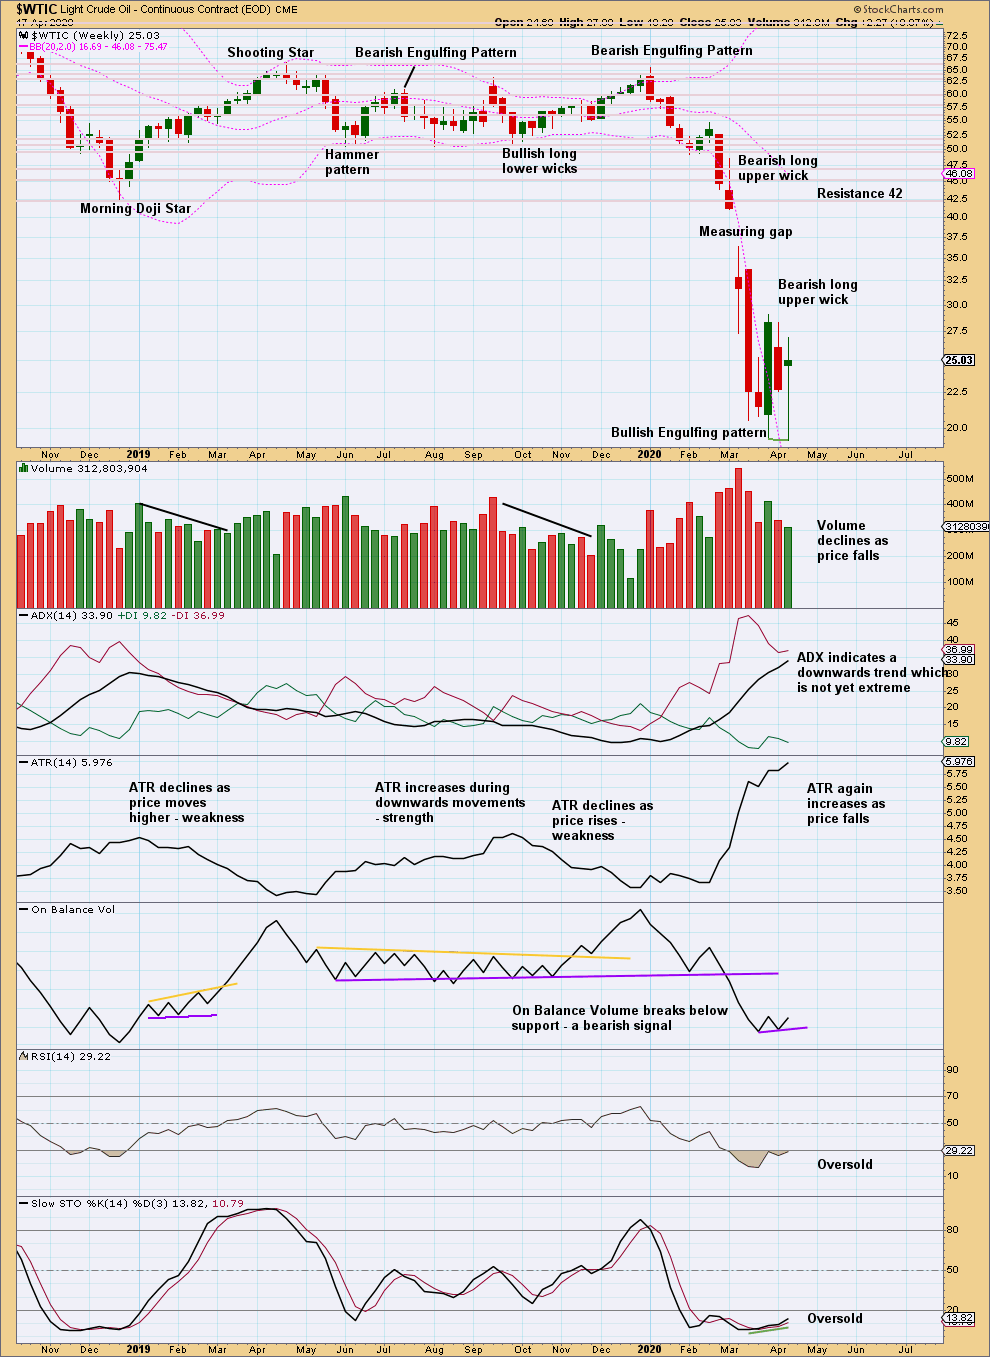
Click chart to enlarge. Chart courtesy of StockCharts.com.
The last weekly candlestick is suspicious in that it looks like the data may not be correct. I have contacted Stockcharts to check their data.
There is now single short-term bullish divergence between price and RSI. The downwards trend is not yet extreme.
DAILY CHART
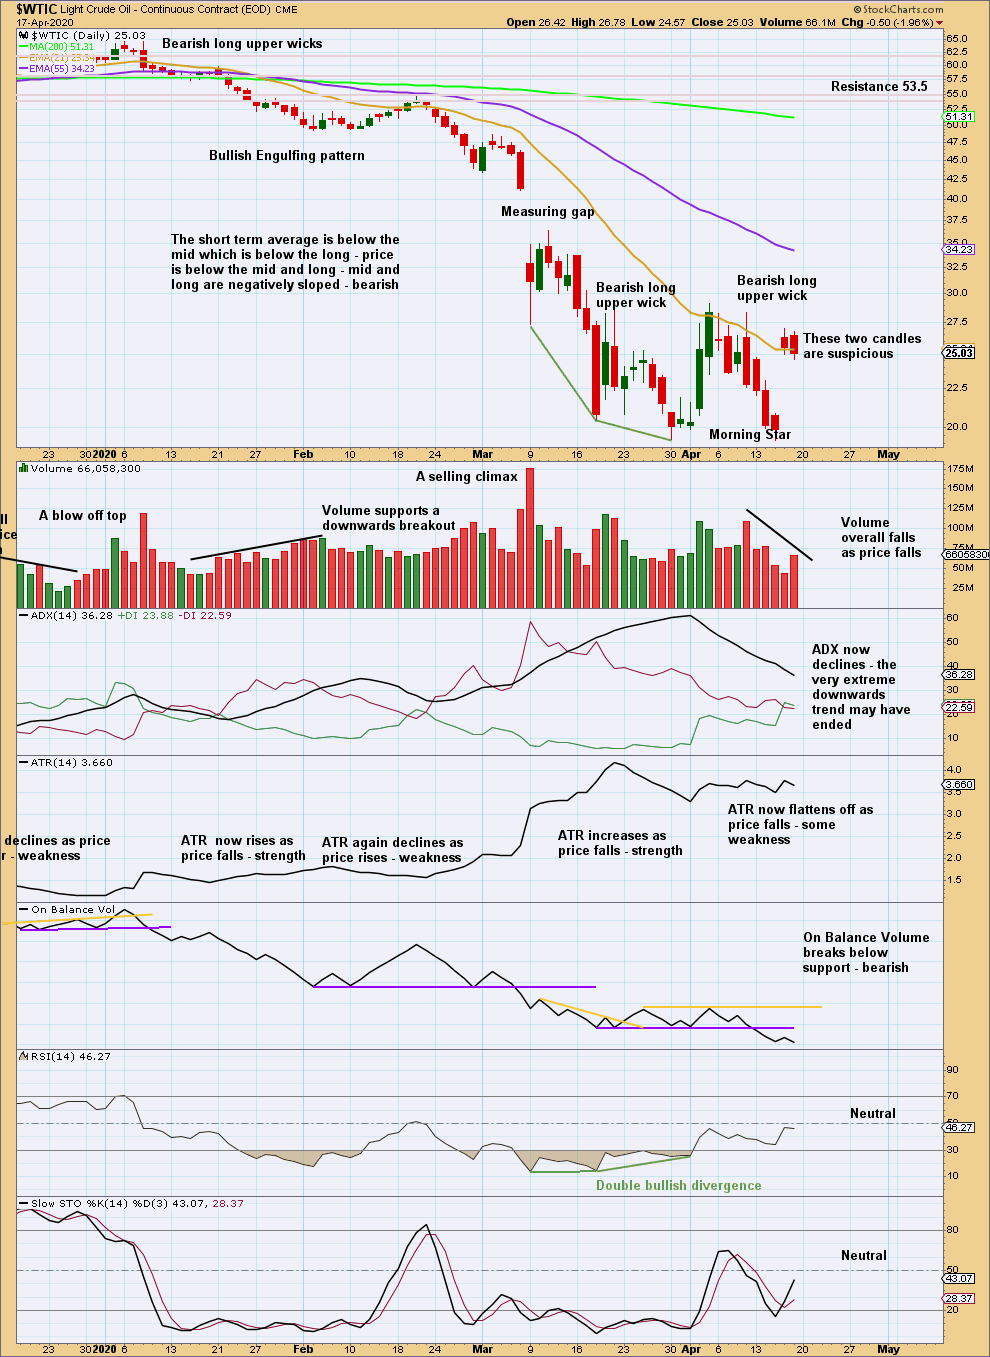
Click chart to enlarge. Chart courtesy of StockCharts.com.
The daily technical analysis assumes the last two candlesticks have incorrect data (from StockCharts) and that data may be more accurately shown on the Elliott wave counts (data from Barchart).
There is now bullish divergence between lows after RSI reached oversold. An end to this downwards trend may now come sooner rather than later.
Published @ 06:06 p.m. EST.
—
Careful risk management protects your trading account(s).
Follow my two Golden Rules:
1. Always trade with stops.
2. Risk only 1-5% of equity on any one trade.
—
New updates to this analysis are in bold.