
US OIL: Elliott Wave and Technical Analysis | Charts – April 24, 2020
Oil has fallen towards the long held target, which was at 9.77. Barchart data shows a low at 10.27, which is just 0.5 short of the target.
Summary: Oil may have found a major sustainable low. Technical analysis supports this view. Confidence in this view may be had with a new high above 29.14.
If price does keep falling, then the target remains at 9.77.
MAIN ELLIOTT WAVE COUNT – BEARISH
MONTHLY CHART
Click chart to enlarge.
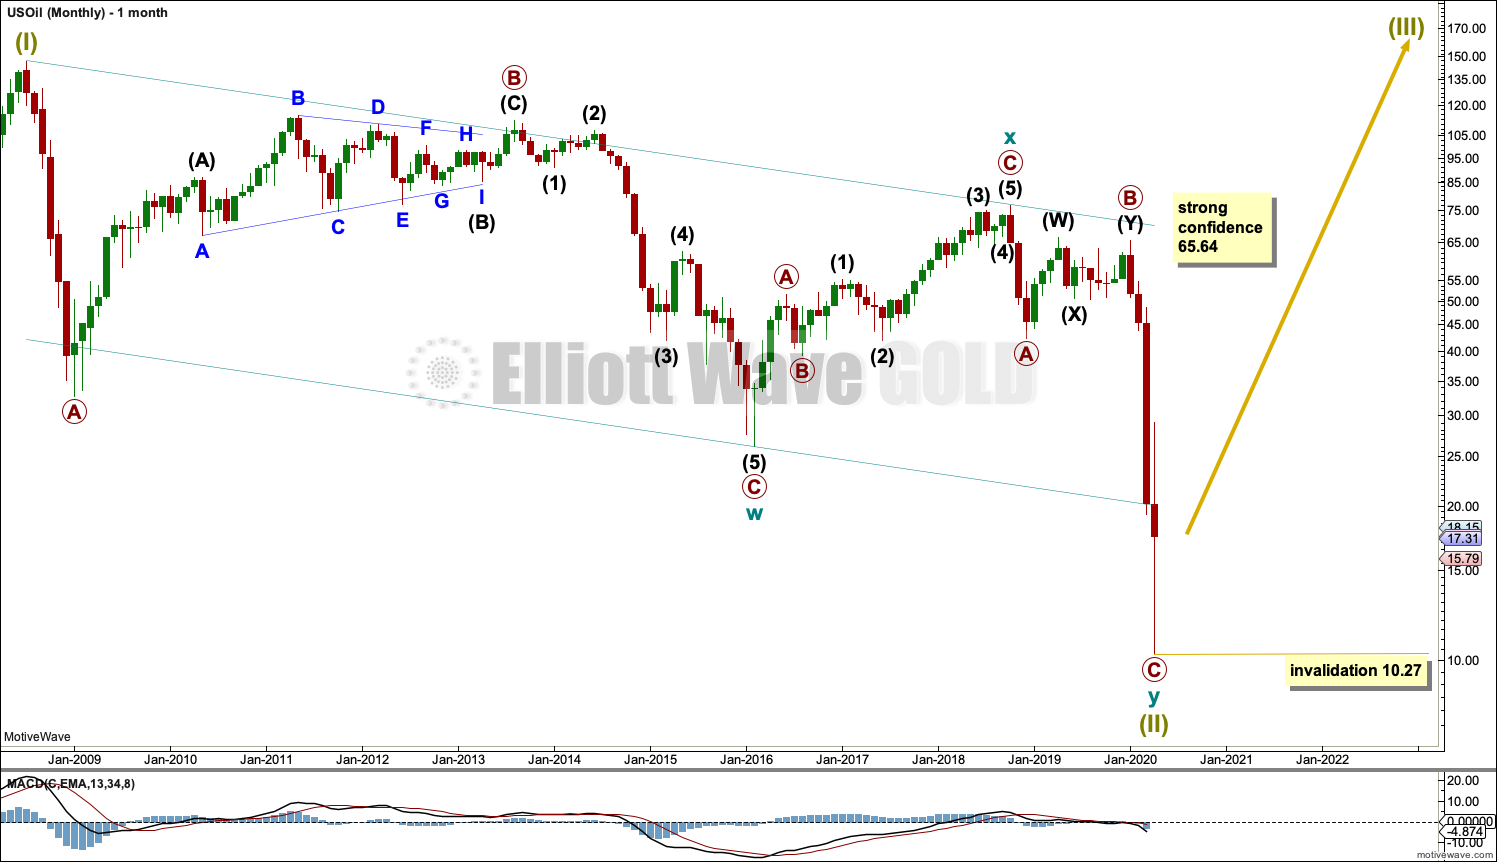
The basic Elliott wave structure is five steps forward and three steps back. This Elliott wave count expects that US Oil has just completed a three steps back pattern, which began in July 2008. The Elliott wave count expects that the bear market for US Oil may now be over.
This Elliott wave corrective structure is a double zigzag, which is a fairly common structure. The correction is labelled Super Cycle wave (II).
The first zigzag in the double is complete and labelled cycle wave w. The double is joined by a three in the opposite direction labelled cycle wave x, which subdivides as a zigzag. The second zigzag in the double is almost complete, labelled cycle wave y.
The purpose of a second zigzag in a double zigzag is to deepen the correction when the first zigzag does not move price deep enough. To achieve this purpose cycle wave y may be expected to move reasonably below the end of cycle wave w at 26.06. This purpose has now been achieved. The structure within primary wave C may now be complete.
Cycle wave y is expected to subdivide as a zigzag, which subdivides 5-3-5.
A channel is drawn about Super Cycle wave (II): draw the first trend line from the start of cycle wave w to the end of cycle wave x, then place a parallel copy on the end of cycle wave w. Price has bounced up off the channel. This trend line is breached, which is a typical look for the end of a movement for a commodity.
Following five waves up and three steps back should be another five steps up. Super Cycle wave (III) may last a generation and must make a new high above the end of Super Cycle wave (I) at 146.73.
Super Cycle wave (III) may last a generation. It may only subdivide as a five wave impulse. New trends for Oil usually start out very slowly with short first waves and deep time consuming second wave corrections. Basing action over a few years may now begin.
WEEKLY CHART
Click chart to enlarge.
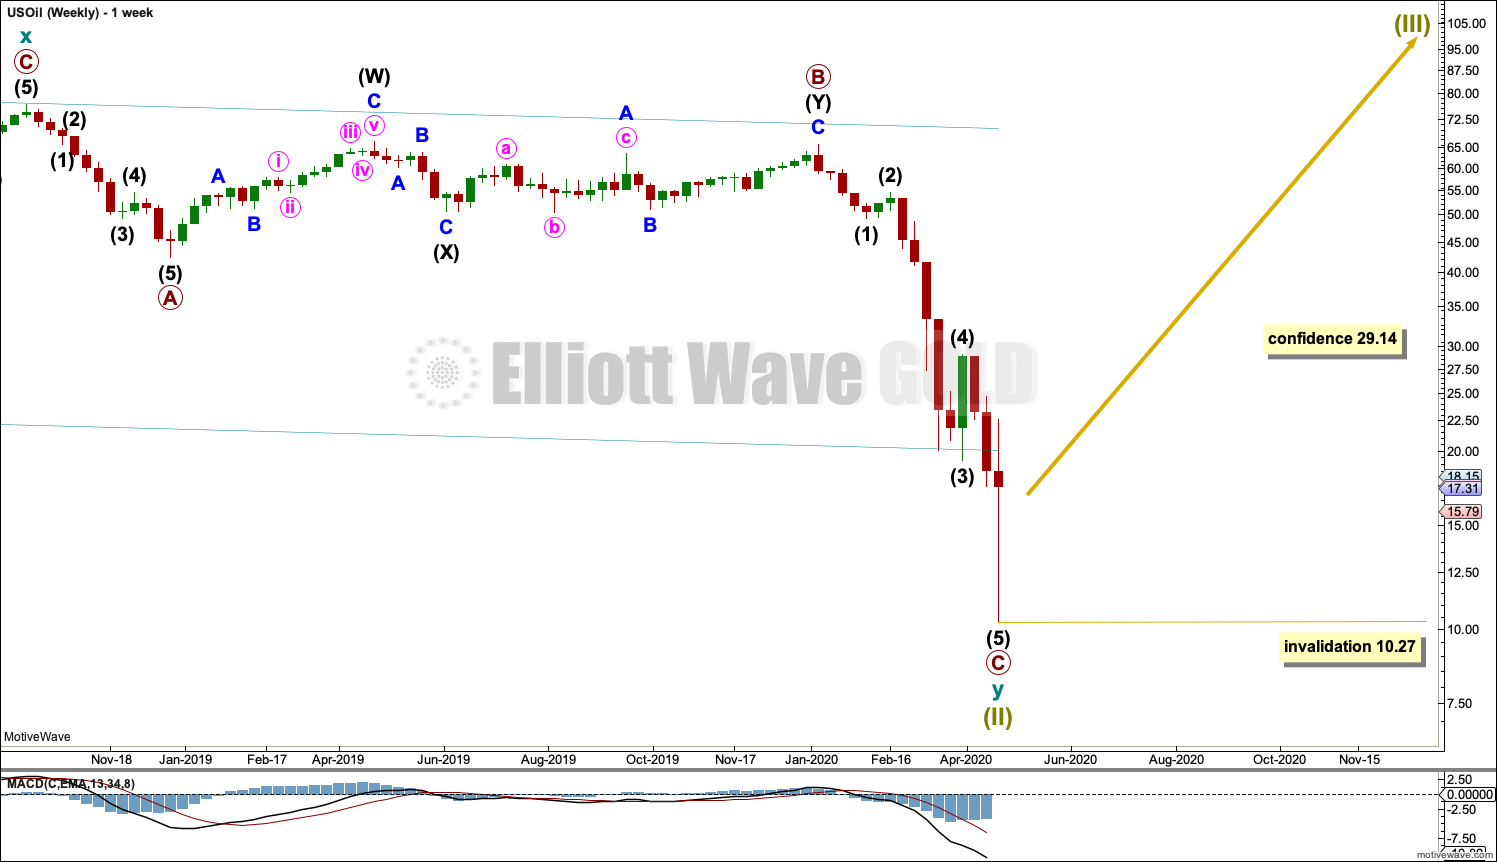
This weekly chart shows all of cycle wave y.
Cycle wave y subdivides as a zigzag.
Primary wave C is now a complete five wave impulse.
Within Super Cycle wave (III): no second wave correction may move beyond the start of its first wave below 10.27.
DAILY CHART
Click chart to enlarge.
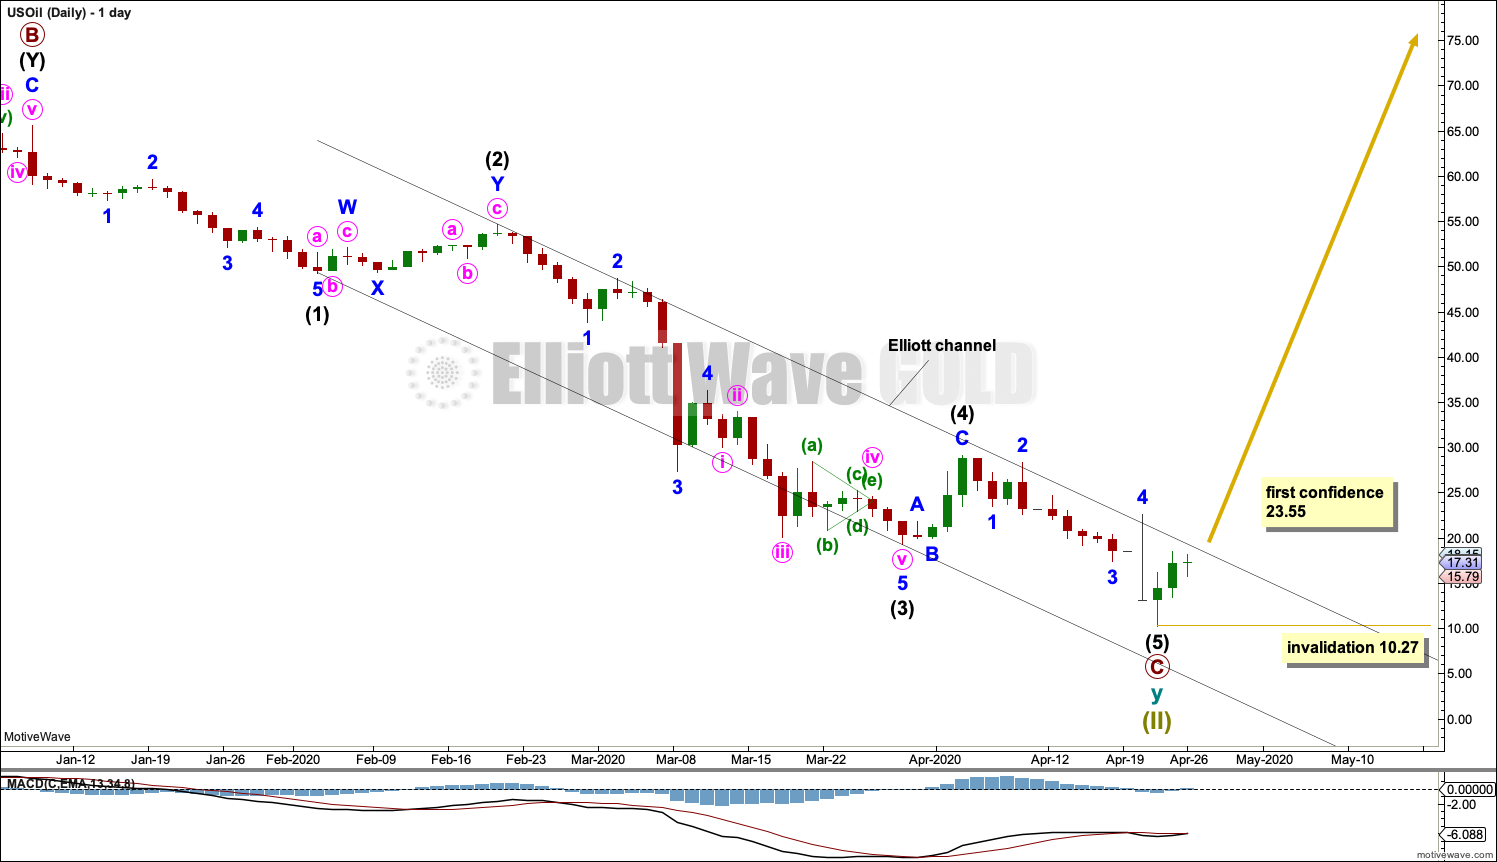
Primary wave C may now be a complete five wave impulse.
Draw an Elliott channel about primary wave C. Draw the first trend line from the ends of intermediate waves (1) to (3), then place a parallel copy on the end of intermediate wave (2). A breach of this channel by upwards movement may be an early indication of a sustainable low.
Within a new trend: no second wave correction may move beyond the start of the trend, below 10.27.
ALTERNATE DAILY CHART
Click chart to enlarge.
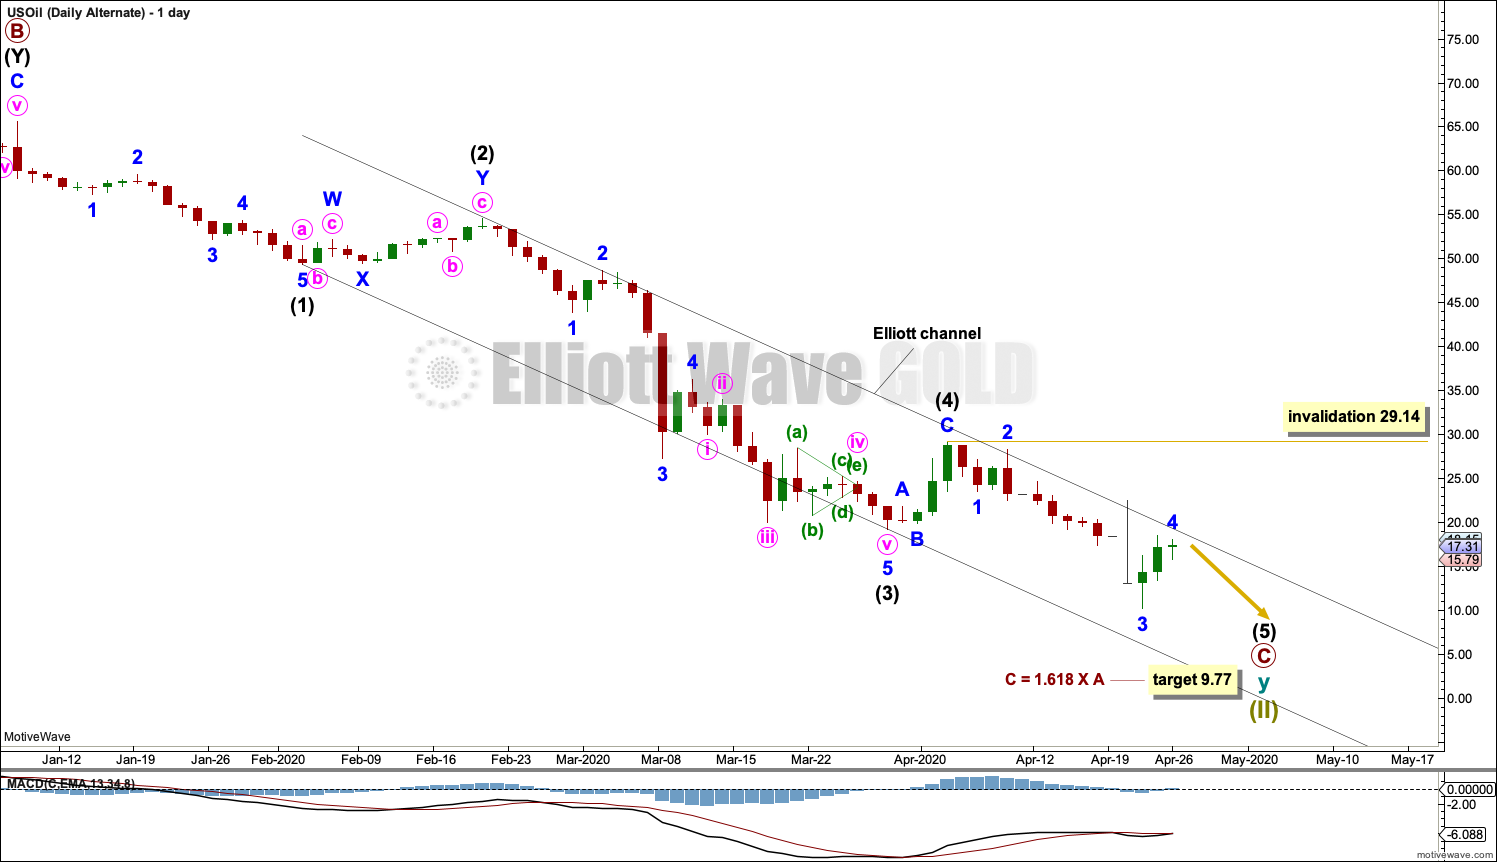
It is still possible that primary wave C may be not quite complete. The target remains the same.
Within intermediate wave (5): no second wave correction may move beyond its start above 29.14. The invalidation point is moved up to this point to be more conservative.
ALTERNATE ELLIOTT WAVE COUNT
MONTHLY CHART
Click chart to enlarge.
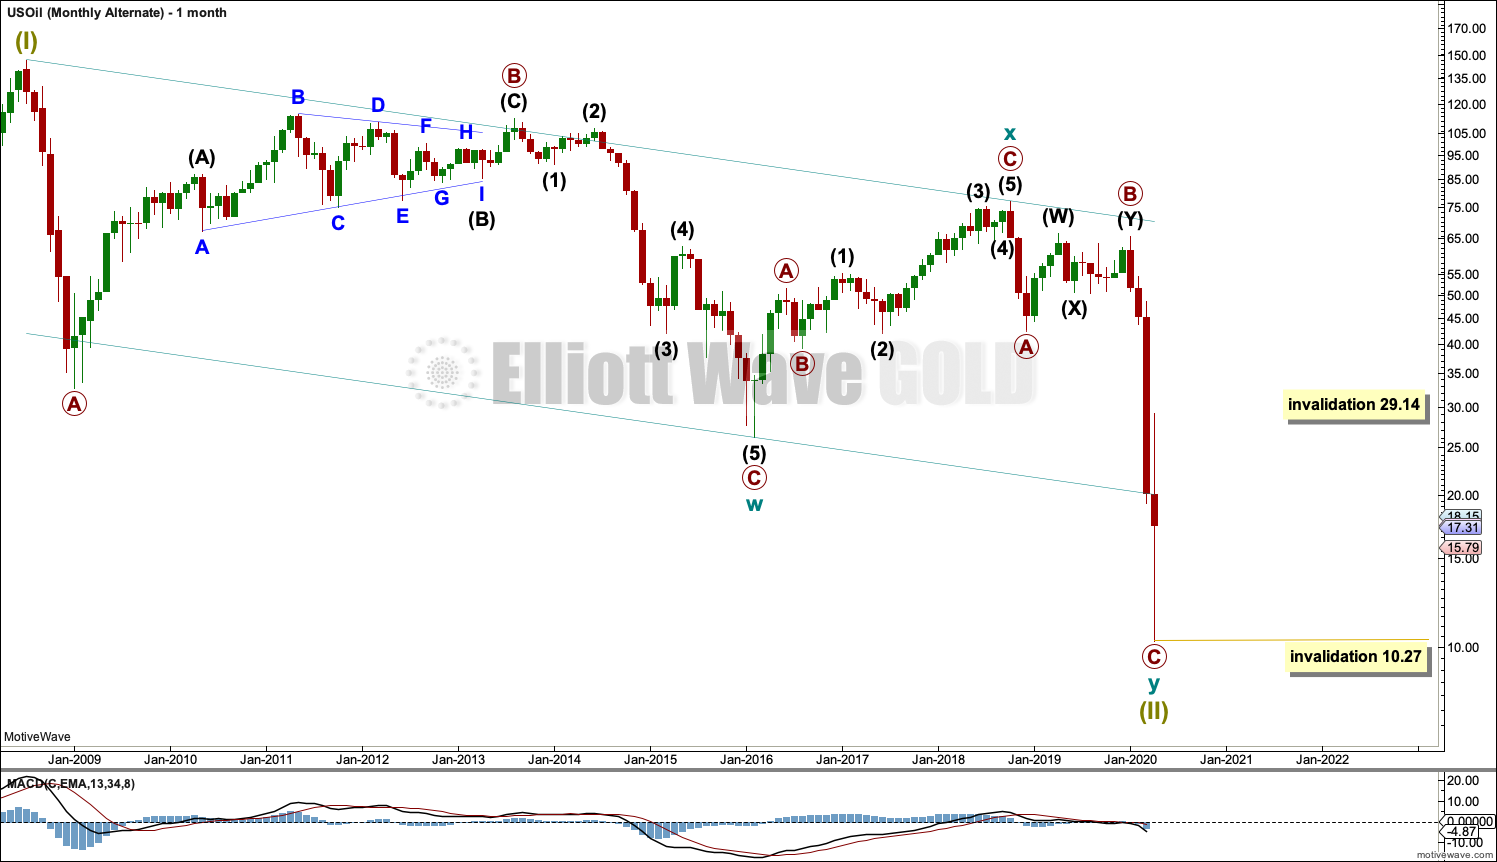
This chart tries to illustrate another possibility, that it may be possible that the market for Oil could cease to exist. The difference between this alternate monthly chart and the main monthly chart is that this chart has no upwards (orange) arrow pointing to Super Cycle wave (III).
There is some historical precedent for this. Throughout history, occasionally, bubbles may form then burst and then the market may cease to exist. One of the most famous examples may be the price of tulips following the burst of the tulip bubble in 1637. Tulip prices never again recovered bubble heights.
From a fundamental point of view this concept may encompass new emerging technologies that may replace old oil reliant technologies.
TECHNICAL ANALYSIS
MONTHLY CHART
Click chart to enlarge. Chart courtesy of StockCharts.com.
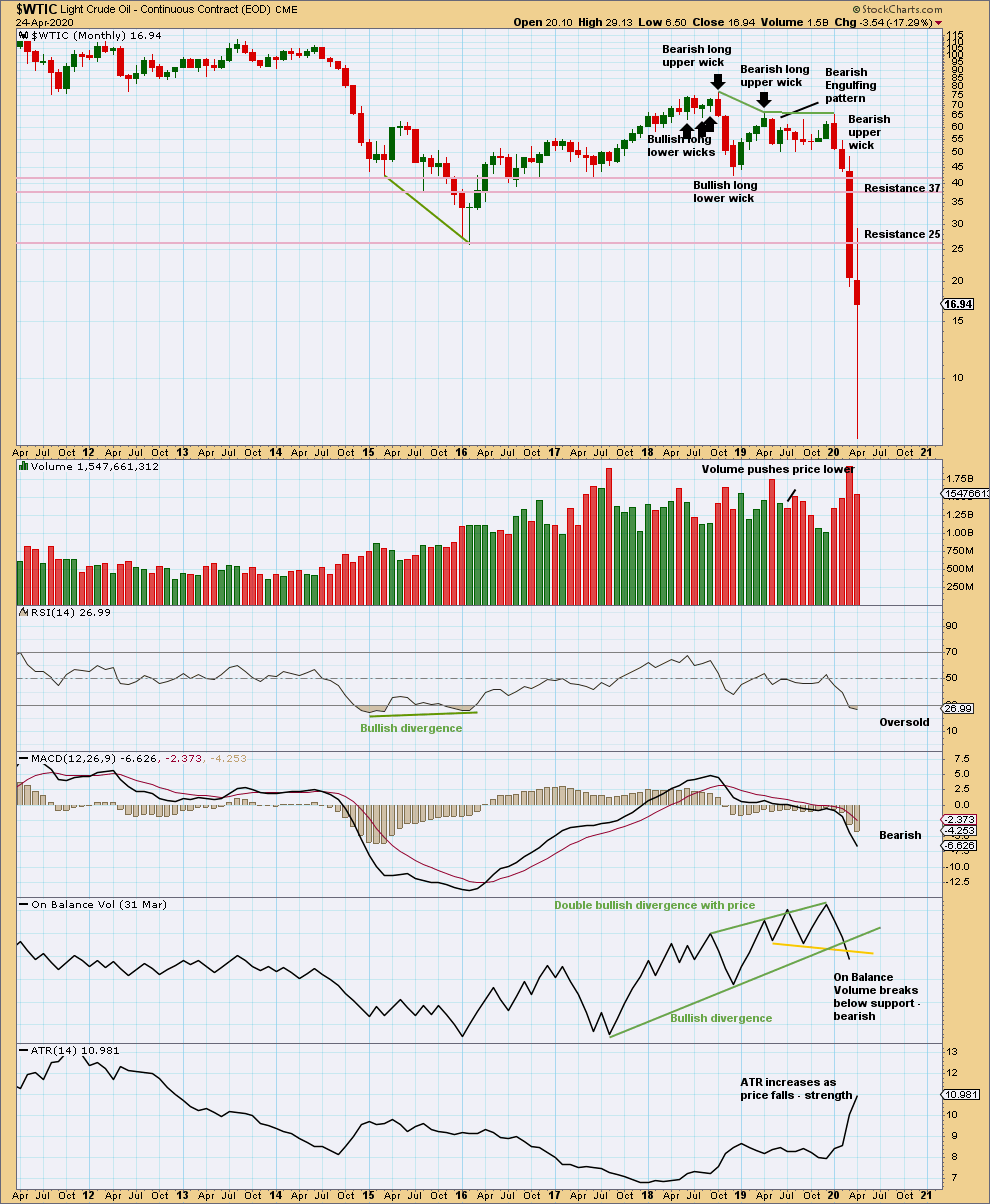
When this market trends strongly down, it can reach extreme and yet price can continue for a reasonable distance.
Unless April ends much lower next week than the close this week, then there may develop a very long wick on this monthly candlestick that would be very bullish.
WEEKLY CHART
Click chart to enlarge. Chart courtesy of StockCharts.com.
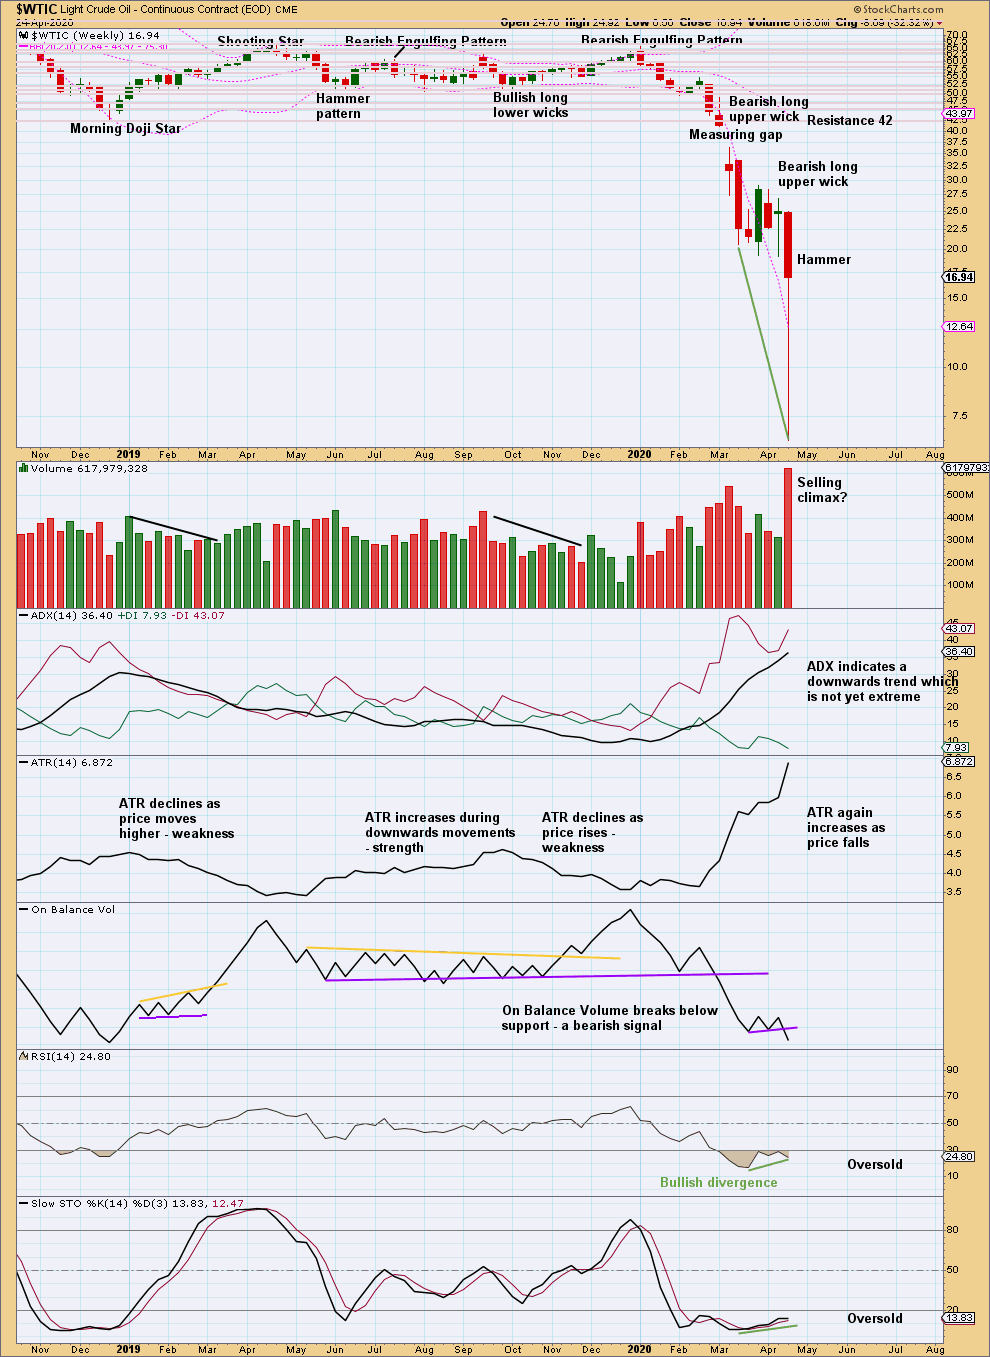
A bullish reversal pattern with RSI reaching oversold and then exhibiting bullish divergence suggests a low may now be in place.
DAILY CHART
Click chart to enlarge. Chart courtesy of StockCharts.com.
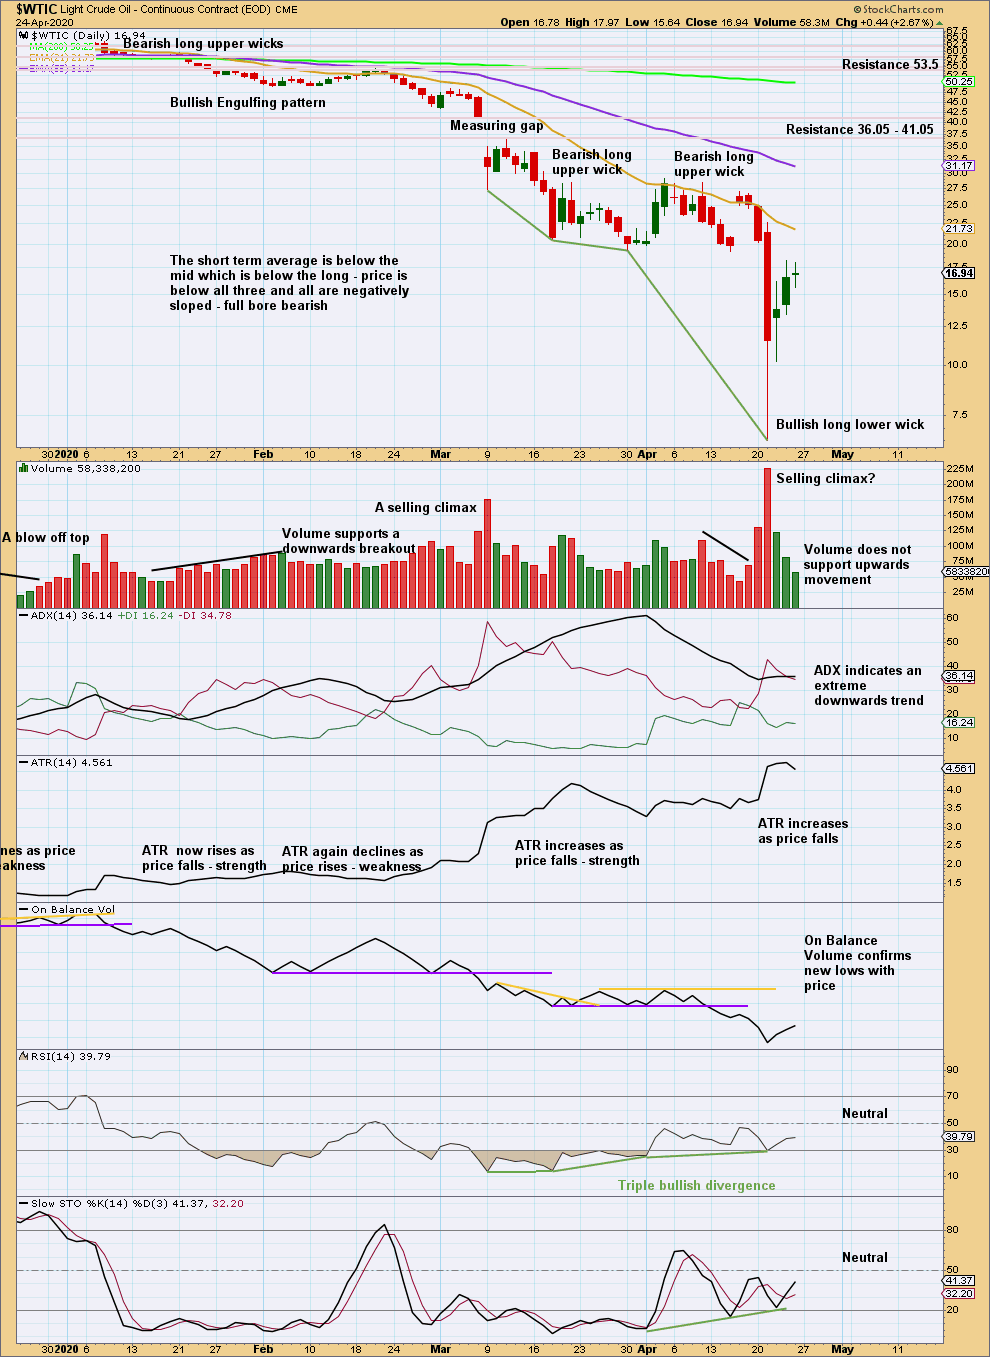
A very bullish long lower wick on a day which may be a selling climax while RSI reached oversold then exhibited bullish divergence with price suggests a low may be in place. However, upwards movement off the low is weak. It is possible that the low may be tested and exceeded before a final low is formed.
Published @ 08:51 p.m. EST.
—
Careful risk management protects your trading account(s).
Follow my two Golden Rules:
1. Always trade with stops.
2. Risk only 1-5% of equity on any one trade.
—
New updates to this analysis are in bold.