
GOLD: Elliott Wave and Technical Analysis | Monthly Charts – May 29, 2020
Summary: There is an upwards trend and no signals of a trend change. The most likely Elliott wave count expects price to not breach the prior high at 1,920.18 and for a trend change to downwards soon.
Grand SuperCycle analysis is here.
MAIN BEARISH ELLIOTT WAVE COUNT
MONTHLY CHART – BEAR
Click chart to enlarge.
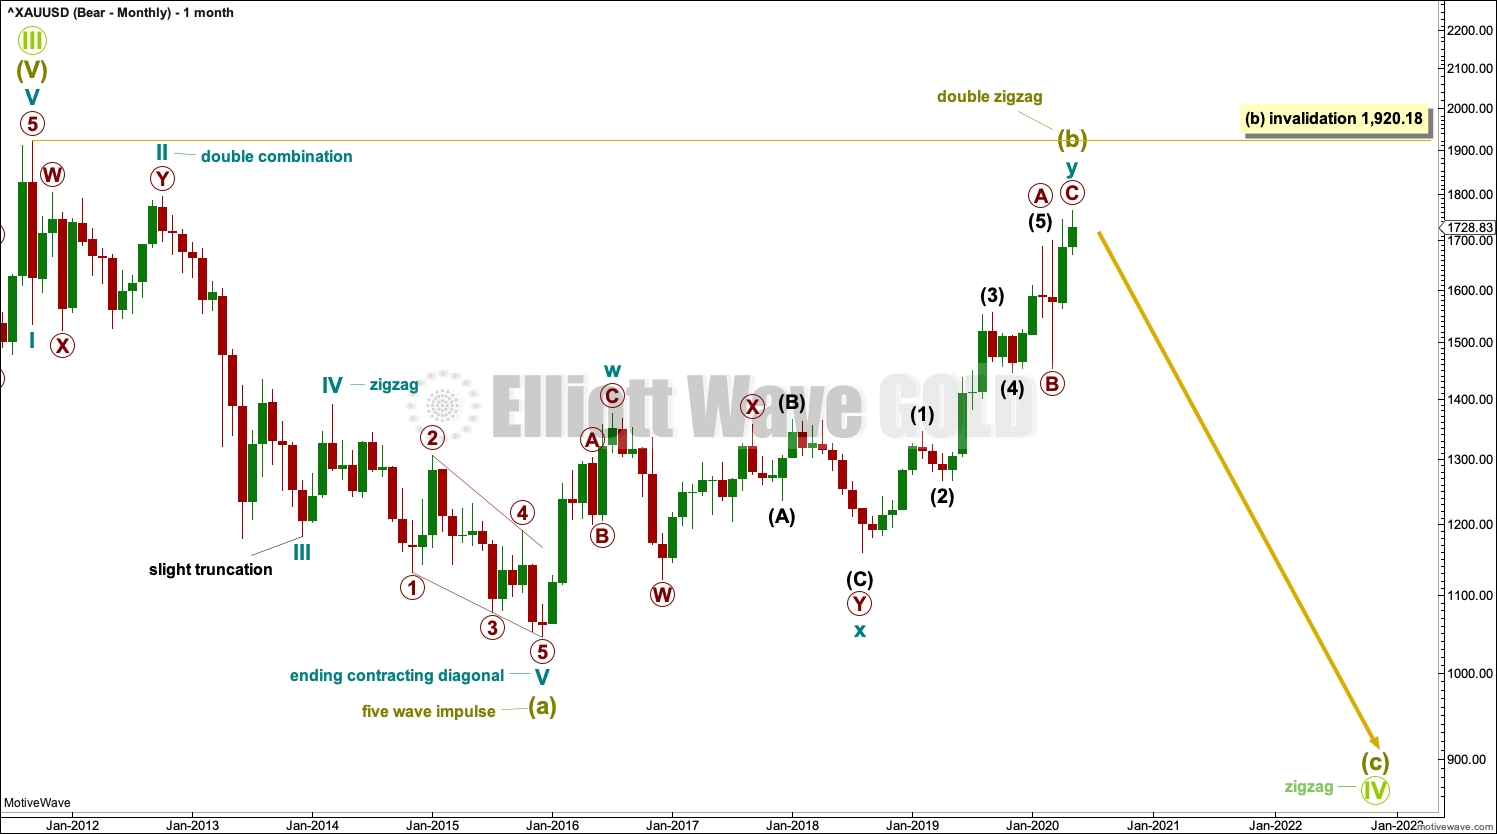
The bigger picture at Grand Super Cycle degree sees a third wave ending in September 2011 and a fourth wave correction beginning there. The fourth wave correction is labelled Grand Super Cycle wave IV.
The downwards wave from the high in September 2011 to December 2015 fits best and looks best as a five wave impulse. This is labelled Super Cycle wave (a).
If Super Cycle wave (a) subdivides as a five, then Super Cycle wave (b) may not move beyond its start above 1,920.18.
If Super Cycle wave (a) subdivides as a five, then Grand Super Cycle wave IV would be subdividing as a zigzag. Zigzags are the most common Elliott wave corrective structure, so this wave count would have a high probability.
When Super Cycle wave (b) may be complete, then Super Cycle wave (c) may begin. Super Cycle wave (c) would be very likely to make at least a slight new low below the end of Super Cycle wave (a) at 1,046.27 to avoid a truncation. Super Cycle wave (c) would most likely exhibit equality in length with Super Cycle wave (a) at 873.91.
When Super Cycle wave (b) may be complete and the starting point for Super Cycle wave (c) may be known, then a target for Super Cycle wave (c) may be calculated. That cannot be done at this stage.
MONTHLY CHART – BEAR ALTERNATE
Click chart to enlarge.
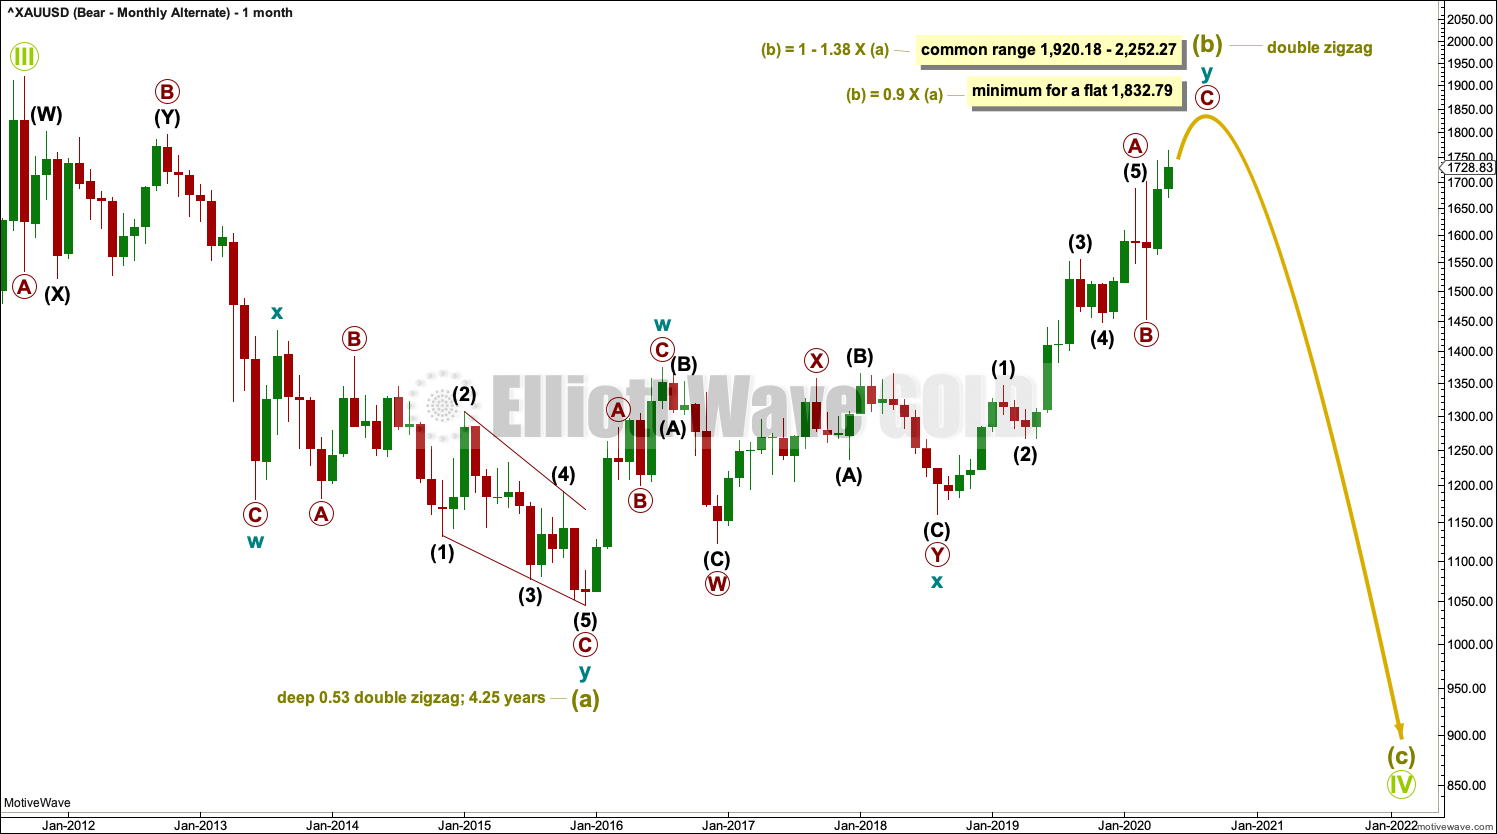
It is also possible to see the large downwards wave labelled Super Cycle wave (a) subdividing as a double zigzag, which is a corrective structure.
If Super Cycle wave (a) has subdivided as a double zigzag, then Grand Super Cycle wave IV may be unfolding as a flat correction. A flat correction would require Super Cycle wave (b) to retrace a minimum 0.9 length of Super Cycle wave (a) at 1,832.79. This minimum has not yet been met.
A flat correction for Grand Super Cycle wave IV may see Super Cycle wave (b) make a new high above the start of Super Cycle wave (a) at 1,920.18 as in an expanded flat. Expanded flat corrections are fairly common Elliott wave corrective structures, particularly in fourth wave positions. The common range for Super Cycle wave (b) within a flat correction would be from 1 to 1.38 times the length of Super Cycle wave (a) from 1,920.18 to 2,252.27.
There is no Elliott wave rule stating a limit for Super Cycle wave (b) within a flat correction, so there is no rule to apply to determine an upper invalidation point for this wave count.
ALTERNATE BULLISH ELLIOTT WAVE COUNT
MONTHLY CHART – BULL
Click chart to enlarge.
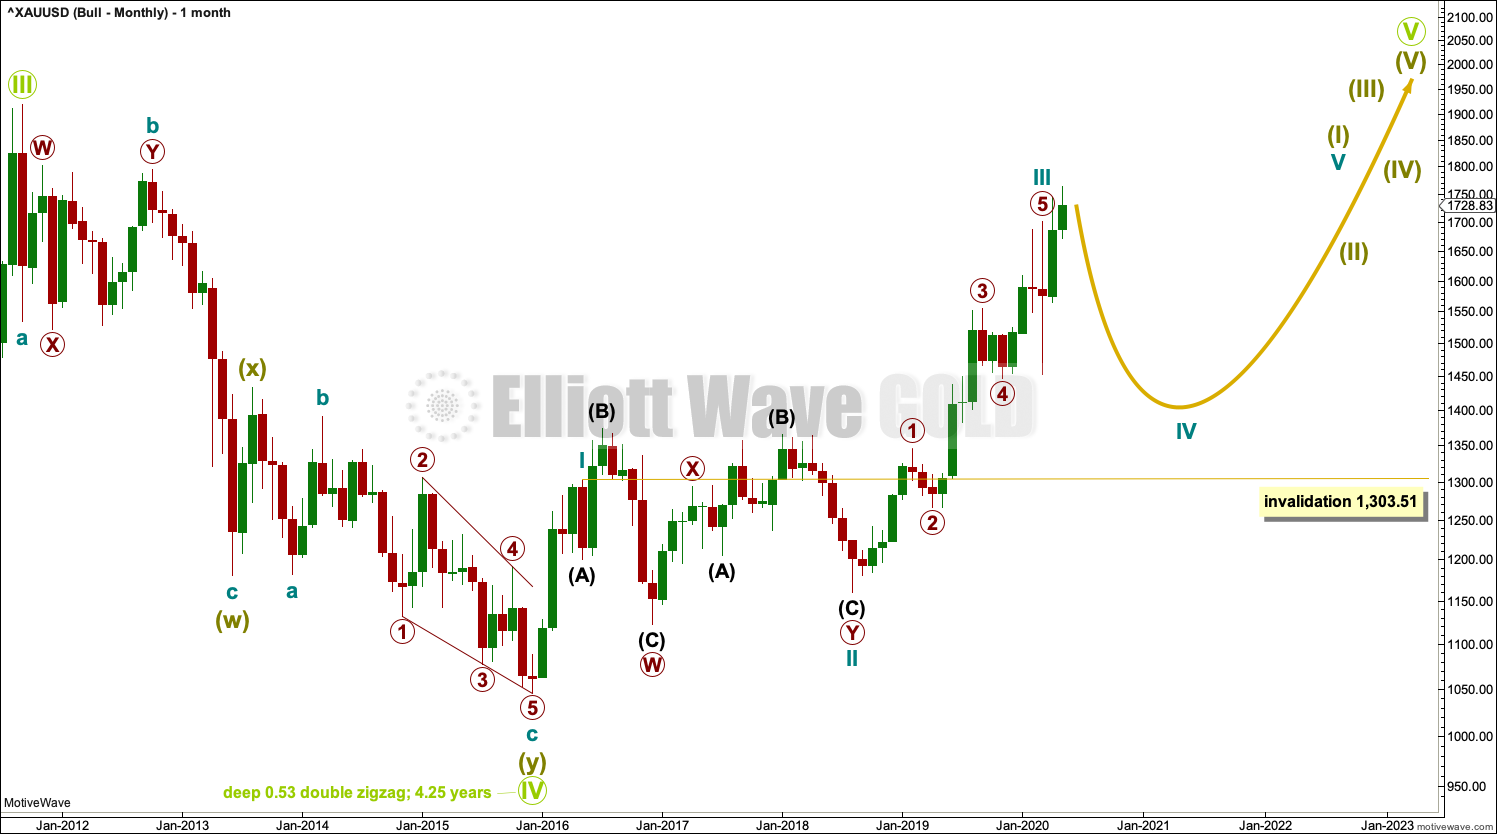
This wave count sees the large downwards wave from September 2011 to December 2015 as having the same subdivisions as the prior chart above, a double zigzag, but it moves the degree of labelling within the double zigzag up one degree.
It is possible that the bear market for Gold was over at the low in December 2015 as a double zigzag. This would see Grand Super Cycle wave IV lasting only 4.25 years, where Grand Super Cycle waves may be normally expected to last at least a decade and possibly longer. The brevity of a Grand Super Cycle wave reduces the probability of this wave count.
If the bear market was over in December 2015, then a new bull market should have begun there. This is labelled Grand Super Cycle wave V.
Super Cycle wave (I) within Grand Super Cycle wave V would be incomplete and would be subdividing as a five wave impulse, the simplest Elliott wave structure. Cycle waves I, II and III within the impulse would now be complete. Cycle wave IV may not move into cycle wave I price territory below 1,303.51.
TECHNICAL ANALYSIS
MONTHLY CHART
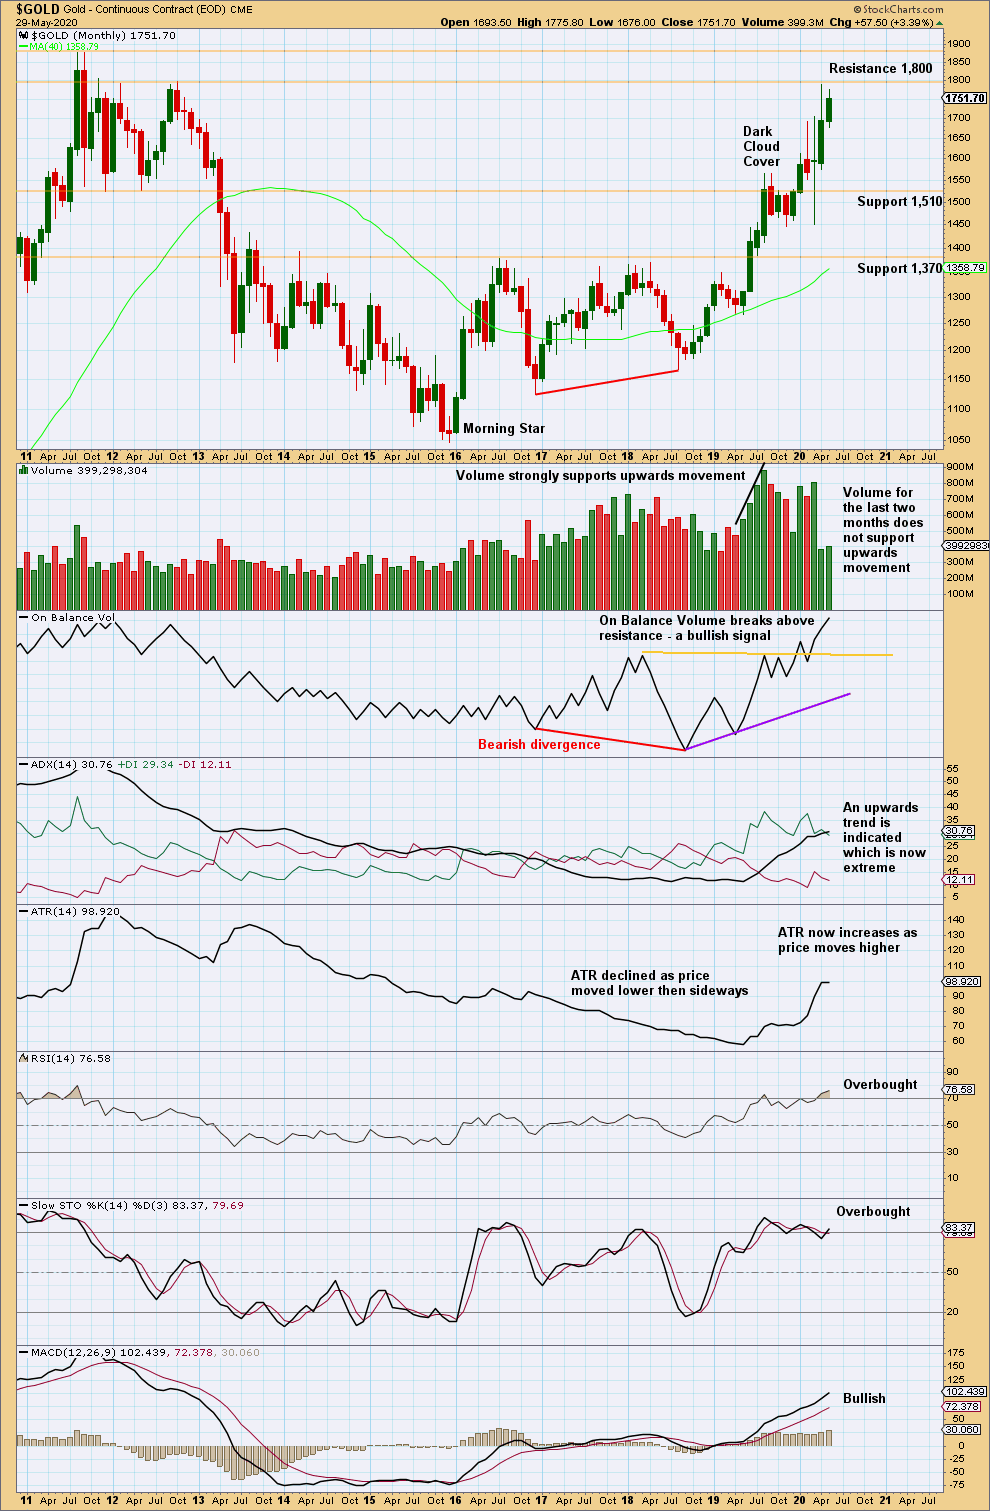
Click chart to enlarge. Chart courtesy of StockCharts.com.
There is an upwards trend that is just now extreme. ADX is above both DX lines. RSI is overbought. However, extreme conditions can continue for a few months yet; there is no bearish divergence and no candlestick reversal pattern. Extreme conditions are a warning that the risk of a trend change is increasing, but the warning is not yet very loud.
Published @ 05:52 p.m. EST on May 30, 2020.
—
Careful risk management protects your trading account(s).
Follow my two Golden Rules:
1. Always trade with stops.
2. Risk only 1-5% of equity on any one trade.
—
New updates to this analysis are in bold.