
SILVER: Elliott Wave and Technical Analysis | Charts – May 8, 2020
An outside week sees price move mostly sideways, remaining within a consolidation zone and below the short-term invalidation point on the daily Elliott wave count.
Summary: A first target is at 8.593. If price reaches this first target and either the Elliott wave structure is incomplete or price keeps falling through it, then the next target would be at 5.806.
ELLIOTT WAVE COUNT
MAIN WAVE COUNT
MONTHLY CHART
Click chart to enlarge.
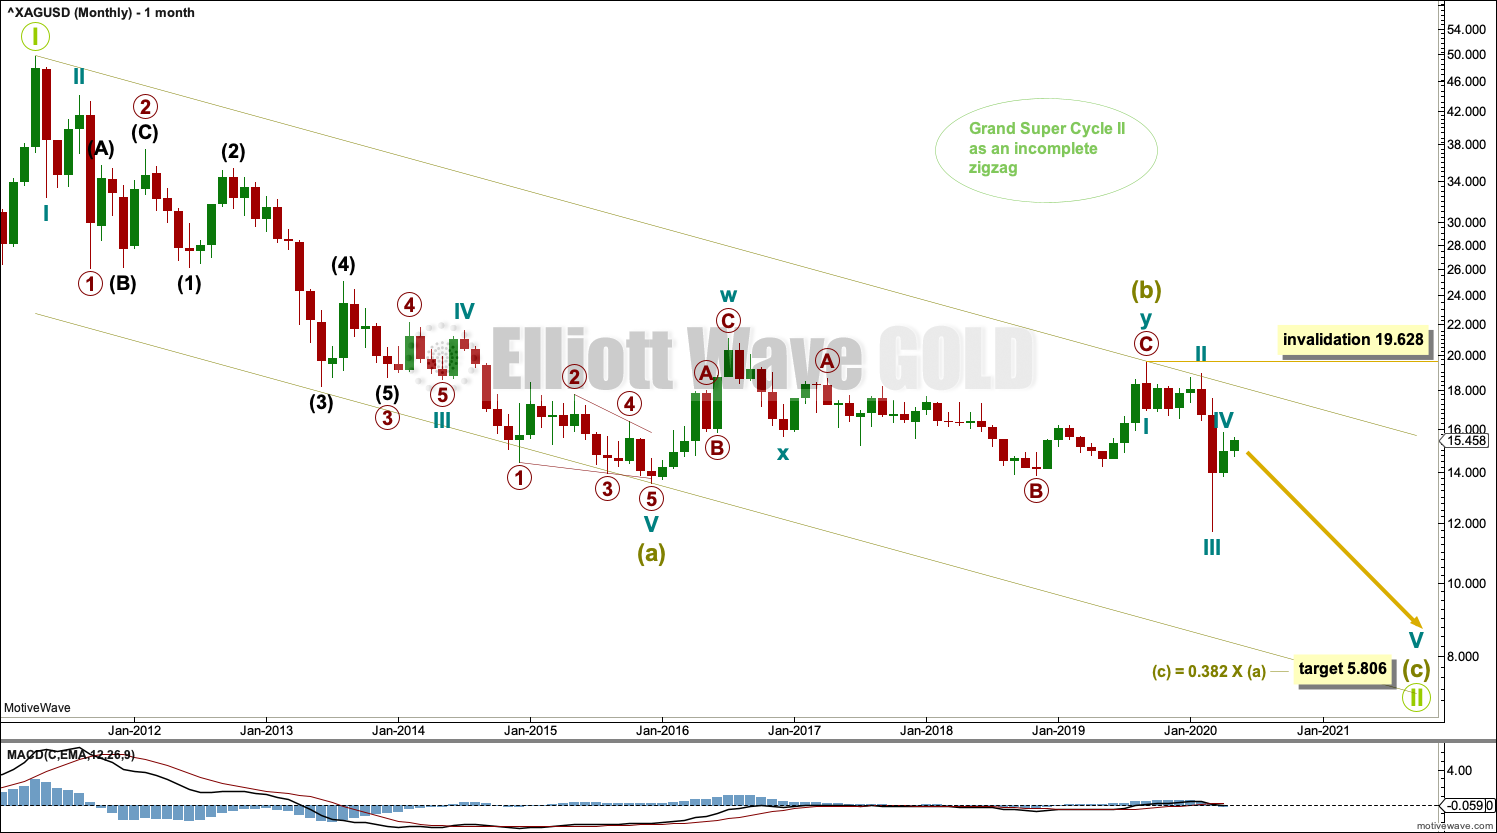
The bear market for Silver may be nearing completion. Within a bearish movement, in the middle there should be a large interruption to the trend in the form of a B wave; bearish movements should have a three wave look to them. This wave count expects that normal look.
This Elliott wave structure for this bear market is labelled as a single zigzag for Grand Super Cycle wave II. Single zigzags are the most common Elliott wave corrective structure.
Within the zigzag, Super Cycle wave (a) subdivides as a five wave impulse, and Super Cycle wave (b) subdivides as a complete double combination. Super Cycle wave (c) has begun and must subdivide as a five wave motive structure, either an impulse or an ending diagonal. At this stage, a lack of overlapping strongly suggests cycle wave (c) may be subdividing as a more common impulse.
A target is calculated for Super Cycle wave (c) to complete the zigzag for Grand Super Cycle wave II. Calculations using the more common ratios of equality and 0.618 yield negative results, so the next Fibonacci ratio in the sequence of 0.382 is used.
Within Super Cycle wave (c), no second wave correction may move beyond its start above 19.628.
Draw a channel about the zigzag of Grand Super Cycle wave II: draw the first trend line from the start of Super Cycle wave (a) to the end of Super Cycle wave (b), then place a parallel copy on the end of Super Cycle wave (a). The lower edge of then channel may provide support and may show where Grand Super Cycle wave II finally ends.
WEEKLY CHART

Click chart to enlarge.
Super Cycle wave (c) must subdivide as a five wave motive structure, most likely an impulse.
Cycle waves I through to IV may be complete. If cycle wave IV continues further as a double zigzag, then it may not move into cycle wave I price territory above 17.786.
Draw a channel using Elliott’s first technique about the impulse of cycle wave (c): draw the first trend line from the ends of cycle waves I to III, then place a parallel copy on the end of cycle wave II. Cycle wave IV so far remains contained within this channel; if it continues further sideways or higher, then it may find resistance at the upper edge. Cycle wave V may find support about the lower edge. Copy the channel over to the daily chart.
DAILY CHART
Click chart to enlarge.
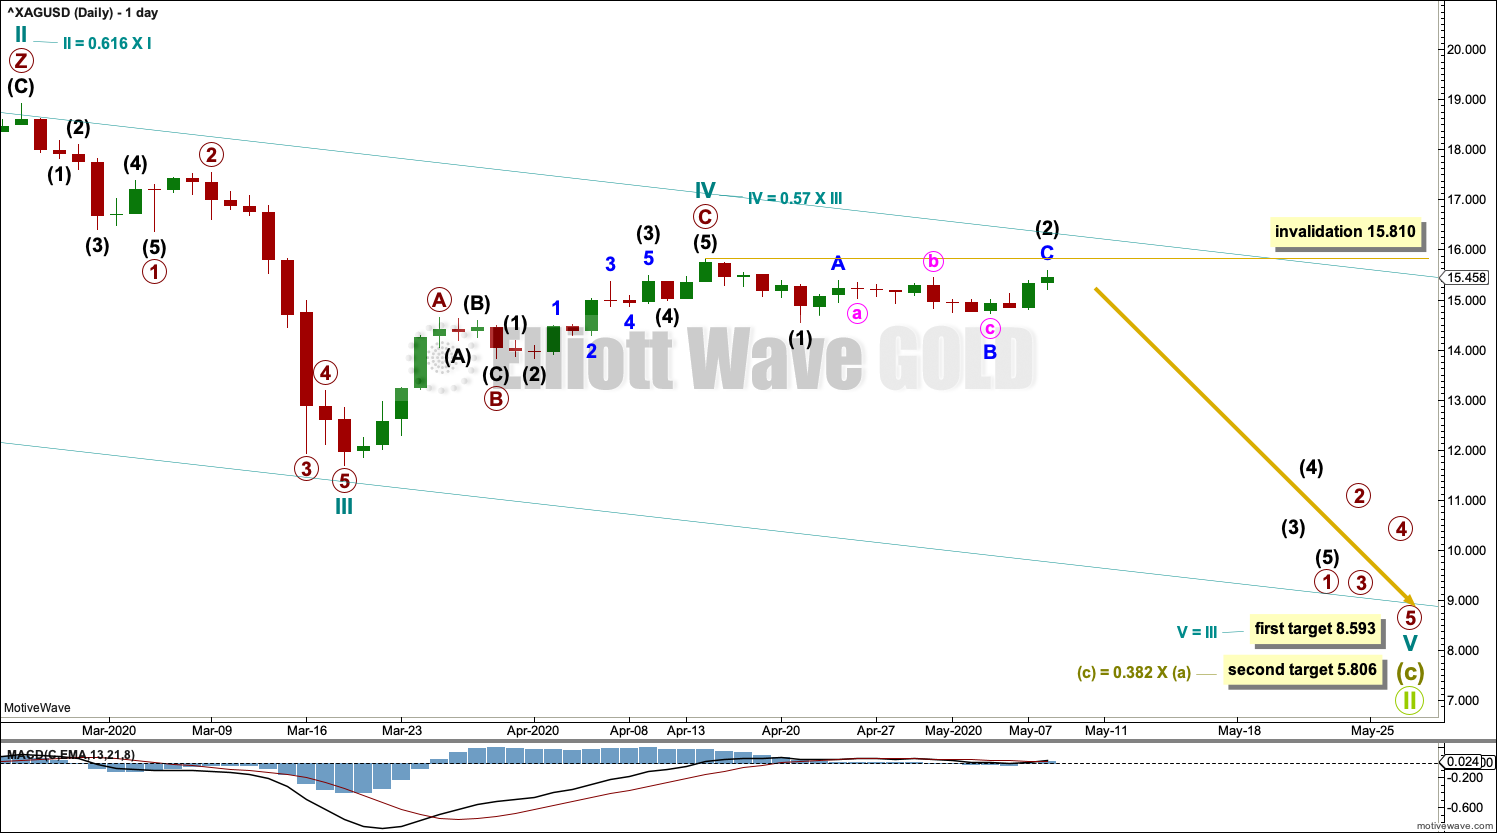
Cycle wave IV may be a single zigzag, which is the most common Elliott wave corrective structure. Within this wave count: there would be alternation between a time consuming triple combination for cycle wave II and a quicker single zigzag of cycle wave IV. Fourth waves are often more brief than their counterpart second waves for commodities.
Cycle wave IV has remained below cycle wave I price territory. All Elliott wave rules for an impulse are met.
Cycle wave V may have begun. It must subdivide as a five wave motive structure. Within cycle wave V: intermediate wave (2) may not move beyond the start of intermediate wave (1) above 15.810.
A target is calculated for Grand Super Cycle wave II to end based upon cycle degree. If price reaches the first target and either the structure of cycle wave V is incomplete or price keeps falling, then use the second target.
TECHNICAL ANALYSIS
WEEKLY CHART
Click chart to enlarge. Chart courtesy of StockCharts.com.
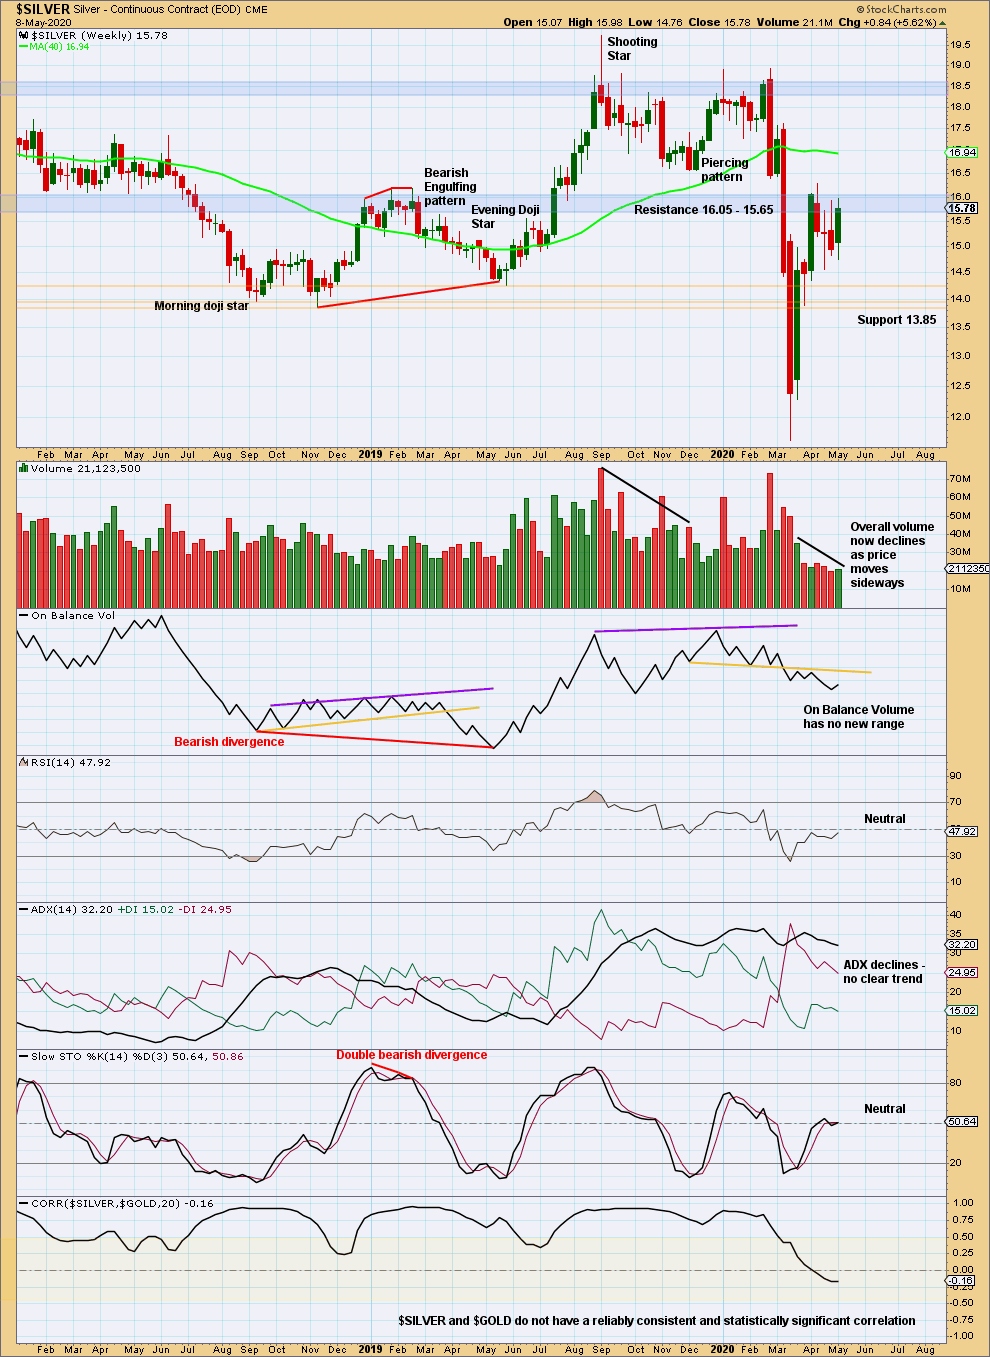
Silver may start a trend slowly then pick up momentum throughout the middle and then explode at the end. A slow start to downwards movement does not mean it cannot continue.
Upwards and now sideways movement of the last seven weeks comes with declining volume. This looks like it may be a counter trend movement.
DAILY CHART
Click chart to enlarge. Chart courtesy of StockCharts.com.
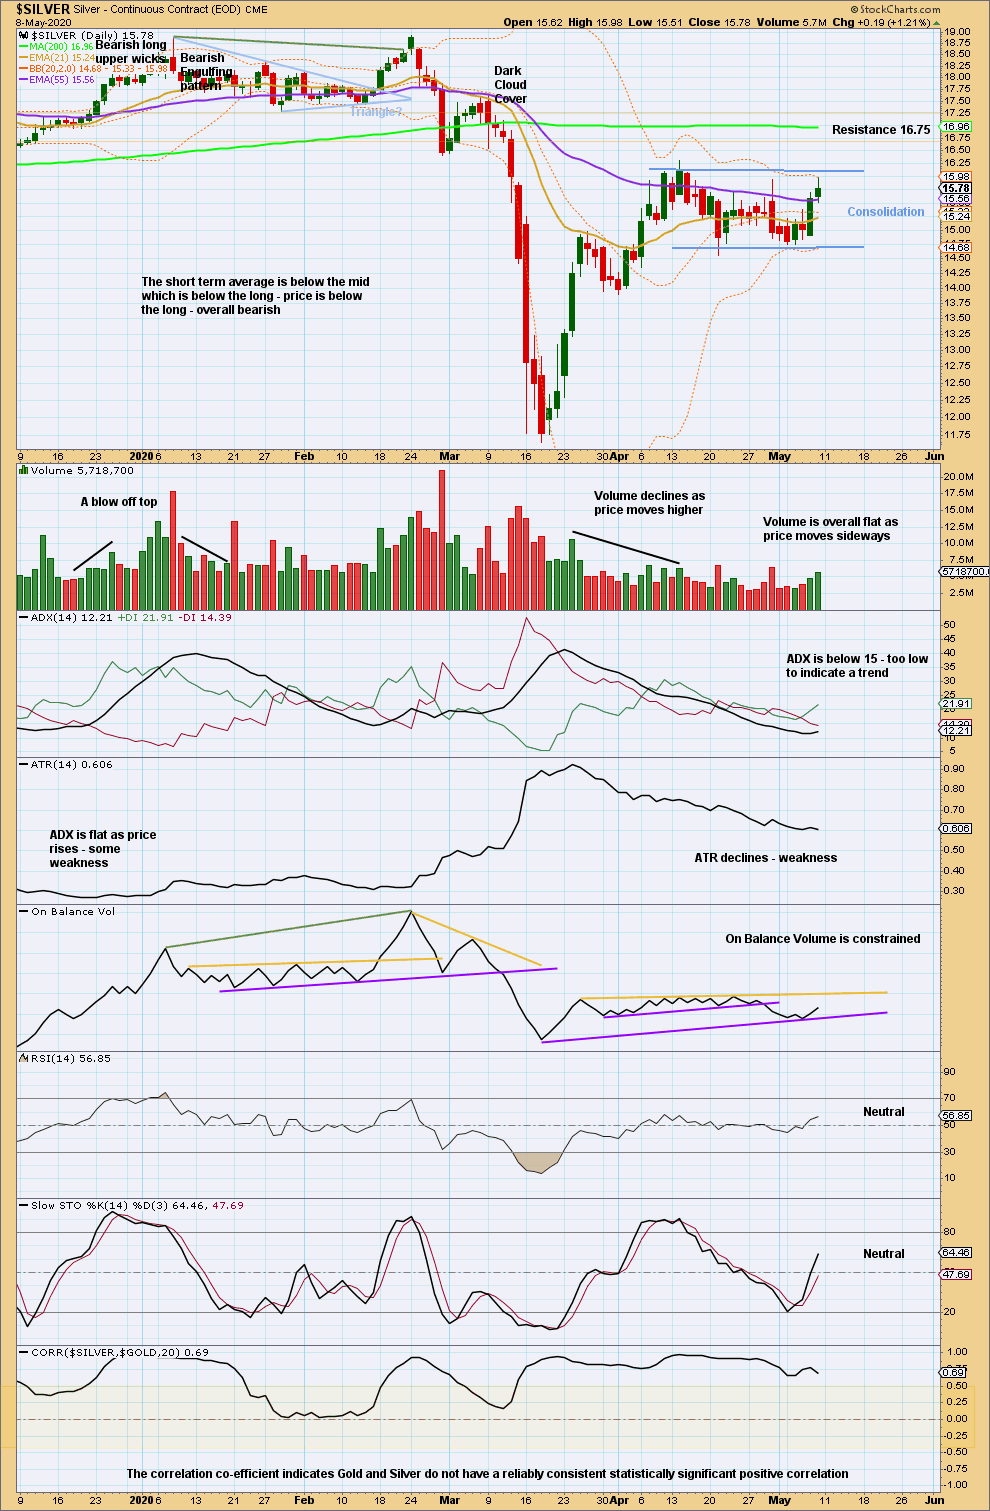
The last signal from On Balance Volume was a breach of technically significant support.
Price is consolidating with resistance about 16.10 and support about 14.75. A breakout from this range needs to be seen, preferably with support from volume, for confidence in the next direction of price.
Published @ 06:05 p.m. EST on May 10, 2020.
—
Careful risk management protects your trading account(s).
Follow my two Golden Rules:
1. Always trade with stops.
2. Risk only 1-5% of equity on any one trade.
—
New updates to this analysis are in bold.