
SILVER: Elliott Wave and Technical Analysis | Charts – May 15, 2020
Upwards movement remains below the mid-term Elliott wave invalidation point, but the daily chart has been invalidated. Two new wave counts are considered for Silver.
Summary: A breakout from a consolidation has occurred on Thursday with confidence from price following through on Friday. A target calculated from the consolidation zone is at 17.84.
The first Elliott wave count expects downwards movement here. It does not have good support from classic technical analysis.
The second Elliott wave count allows for more upwards movement before a trend change. It would be invalidated above 18.920.
A new high above 18.920 would be very bullish. At that stage, a third bullish wave count would remain the only wave count.
ELLIOTT WAVE COUNTS
MAIN WAVE COUNT
MONTHLY CHART
Click chart to enlarge.
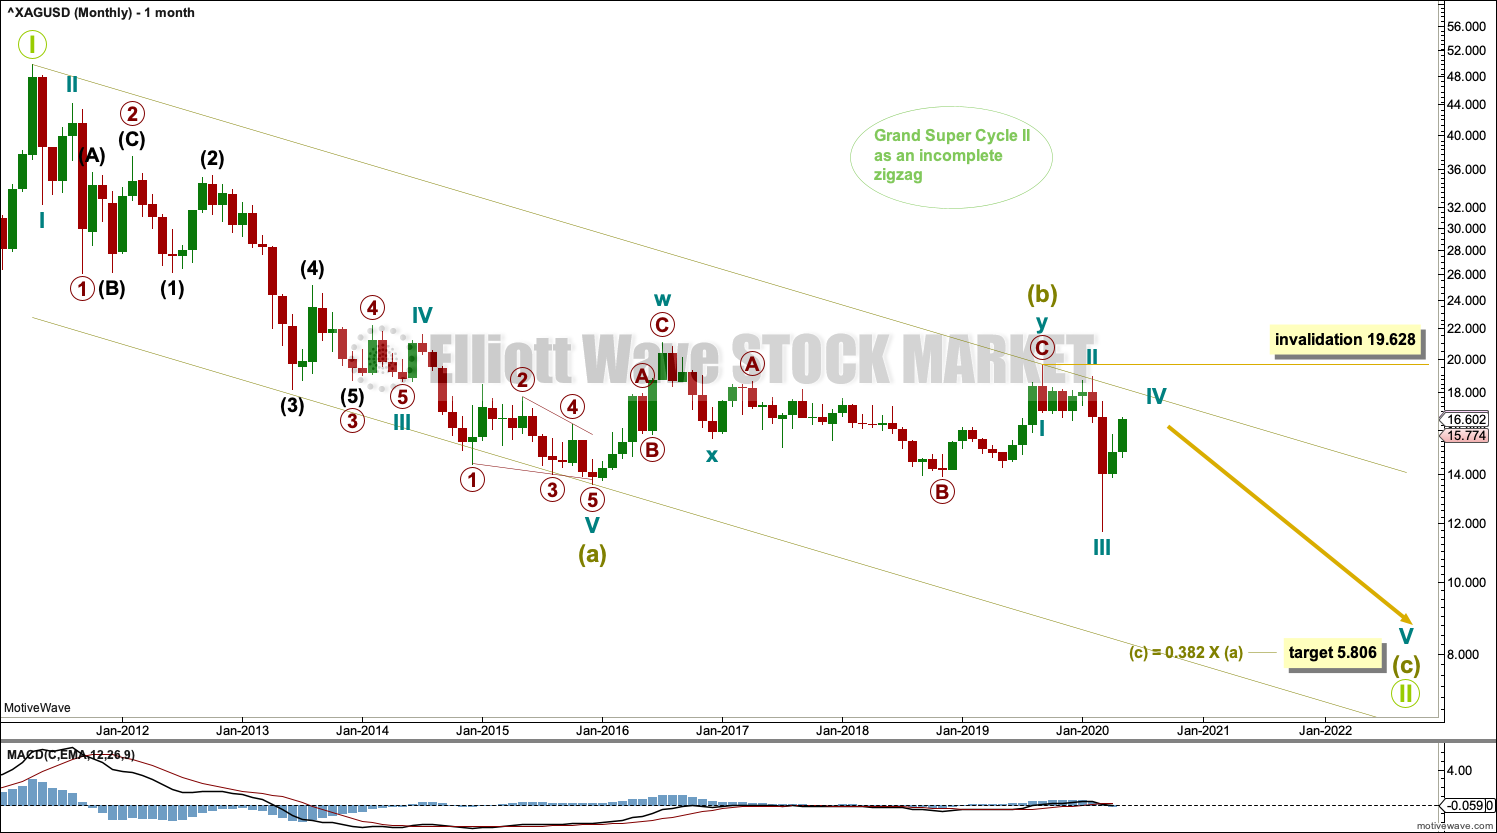
The bear market for Silver may be nearing completion. Within a bearish movement, in the middle there should be a large interruption to the trend in the form of a B wave; bearish movements should have a three wave look to them. This wave count expects that normal look.
This Elliott wave structure for this bear market is labelled as a single zigzag for Grand Super Cycle wave II. Single zigzags are the most common Elliott wave corrective structure.
Within the zigzag, Super Cycle wave (a) subdivides as a five wave impulse, and Super Cycle wave (b) subdivides as a complete double combination. Super Cycle wave (c) must subdivide as a five wave motive structure, either an impulse or an ending diagonal. Strong upwards movement this week suggests a diagonal should now be considered. Two daily charts below consider both of these structures.
A target is calculated for Super Cycle wave (c) to complete the zigzag for Grand Super Cycle wave II. Calculations using the more common ratios of equality and 0.618 yield negative results, so the next Fibonacci ratio in the sequence of 0.382 is used.
Within Super Cycle wave (c), no second wave correction may move beyond its start above 19.628.
Draw a channel about the zigzag of Grand Super Cycle wave II: draw the first trend line from the start of Super Cycle wave (a) to the end of Super Cycle wave (b), then place a parallel copy on the end of Super Cycle wave (a). The lower edge of then channel may provide support and may show where Grand Super Cycle wave II finally ends. The upper edge of the channel should provide resistance if Grand Super Cycle wave II is incomplete.
WEEKLY CHART
Click chart to enlarge.
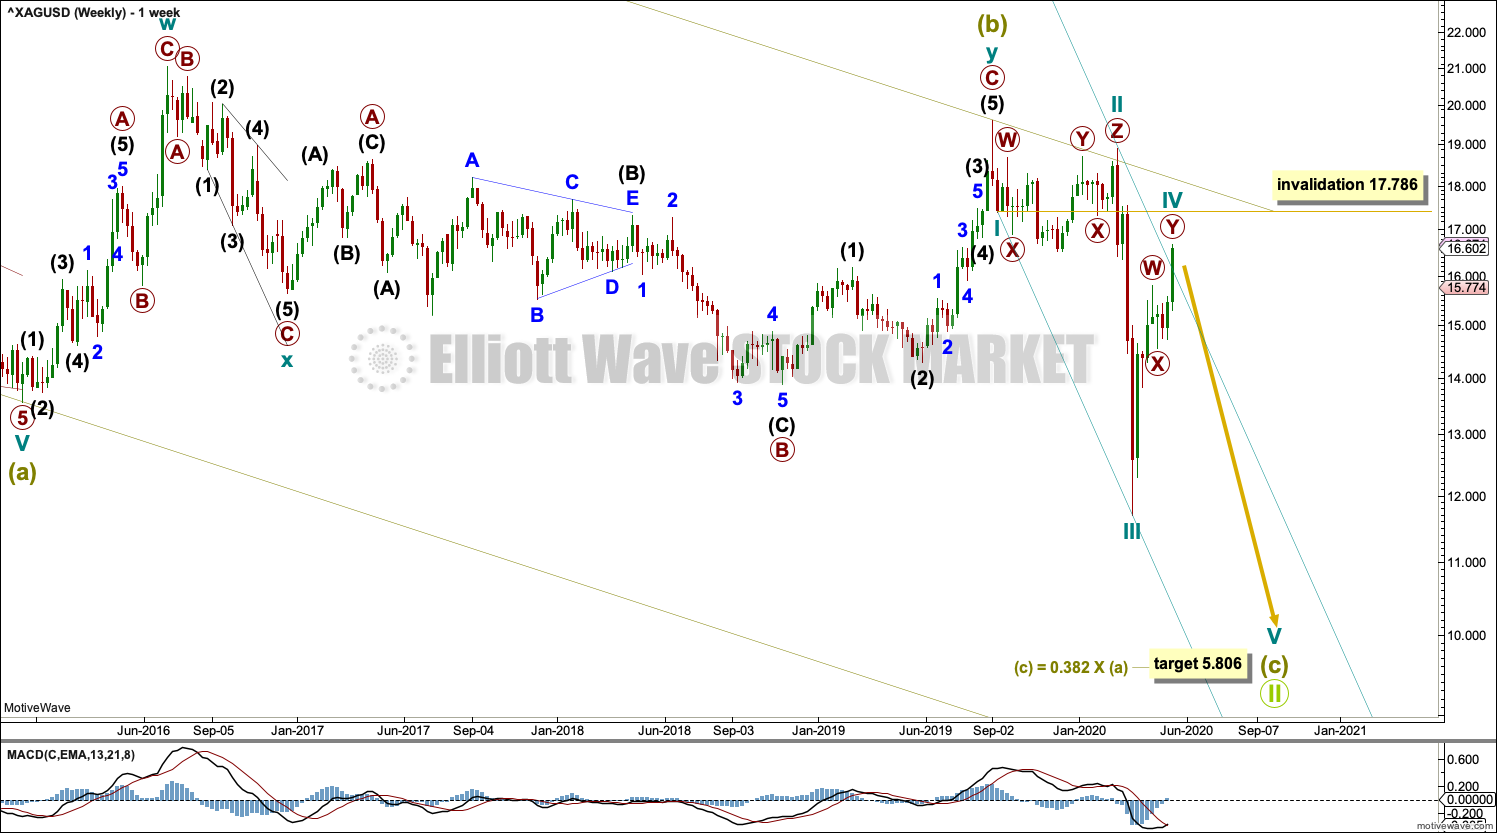
Super Cycle wave (c) must subdivide as a five wave motive structure, most likely an impulse.
Cycle waves I through to III may be complete. Cycle wave IV may not move into cycle wave I price territory above 17.786.
Draw a channel using Elliott’s first technique about the impulse of cycle wave (c): draw the first trend line from the ends of cycle waves I to III, then place a parallel copy on the end of cycle wave II. Cycle wave IV has now overshot the upper edge of this channel. The probability of this wave count is slightly reduced. Cycle wave V may find support about the lower edge. Copy the channel over to the daily chart.
DAILY CHART – IMPULSE
Click chart to enlarge.
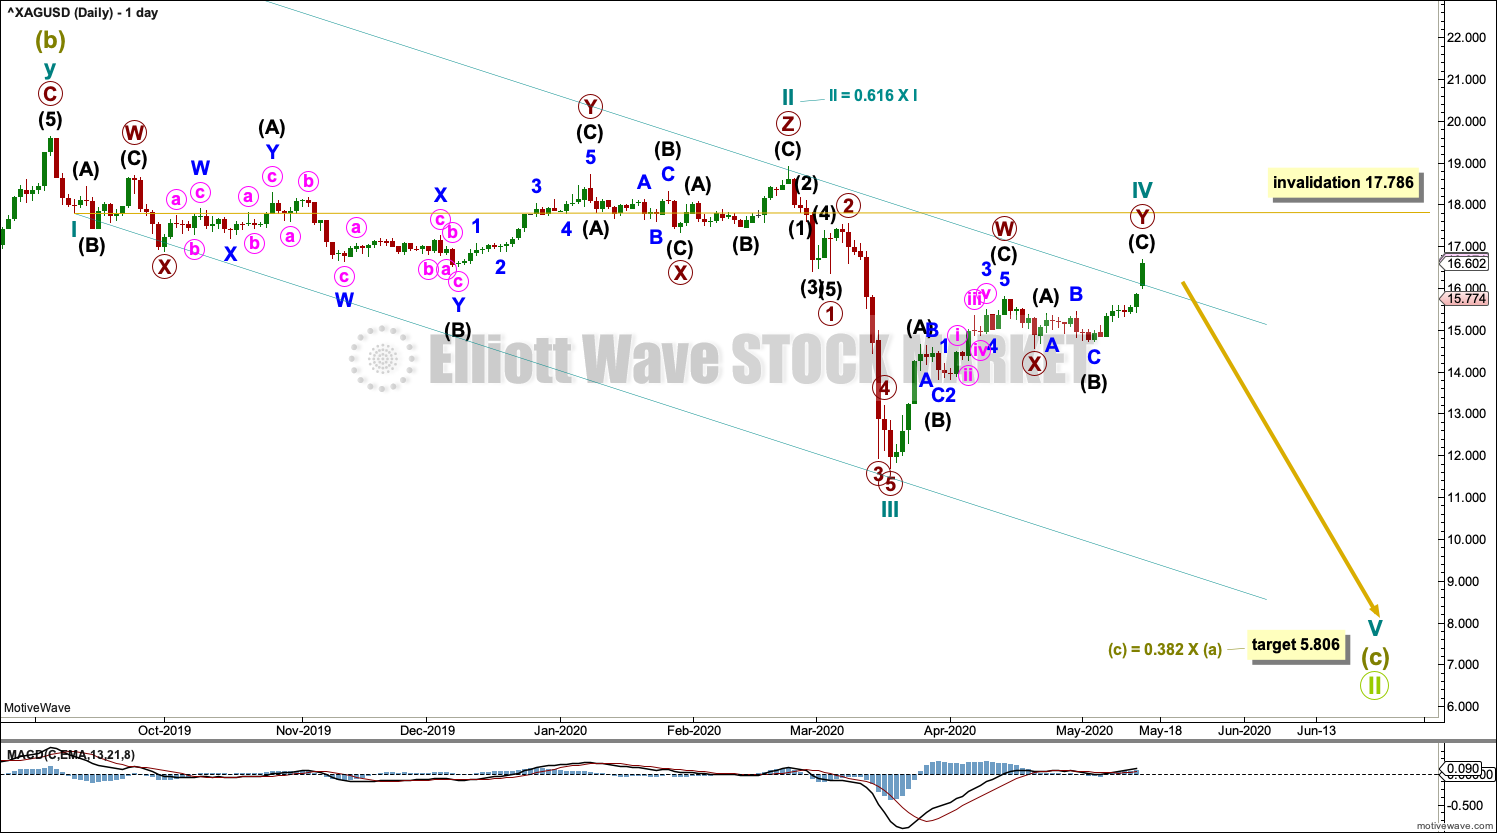
Cycle wave IV may be continuing higher as a double zigzag. There would still be alternation within this wave count between a time consuming triple combination for cycle wave II and a quicker double zigzag of cycle wave IV. Fourth waves are often more brief than their counterpart second waves for commodities.
Cycle wave IV has remained below cycle wave I price territory. All Elliott wave rules for an impulse are met.
Cycle wave V must subdivide as a five wave motive structure.
DAILY CHART – ENDING DIAGONAL
Click chart to enlarge.
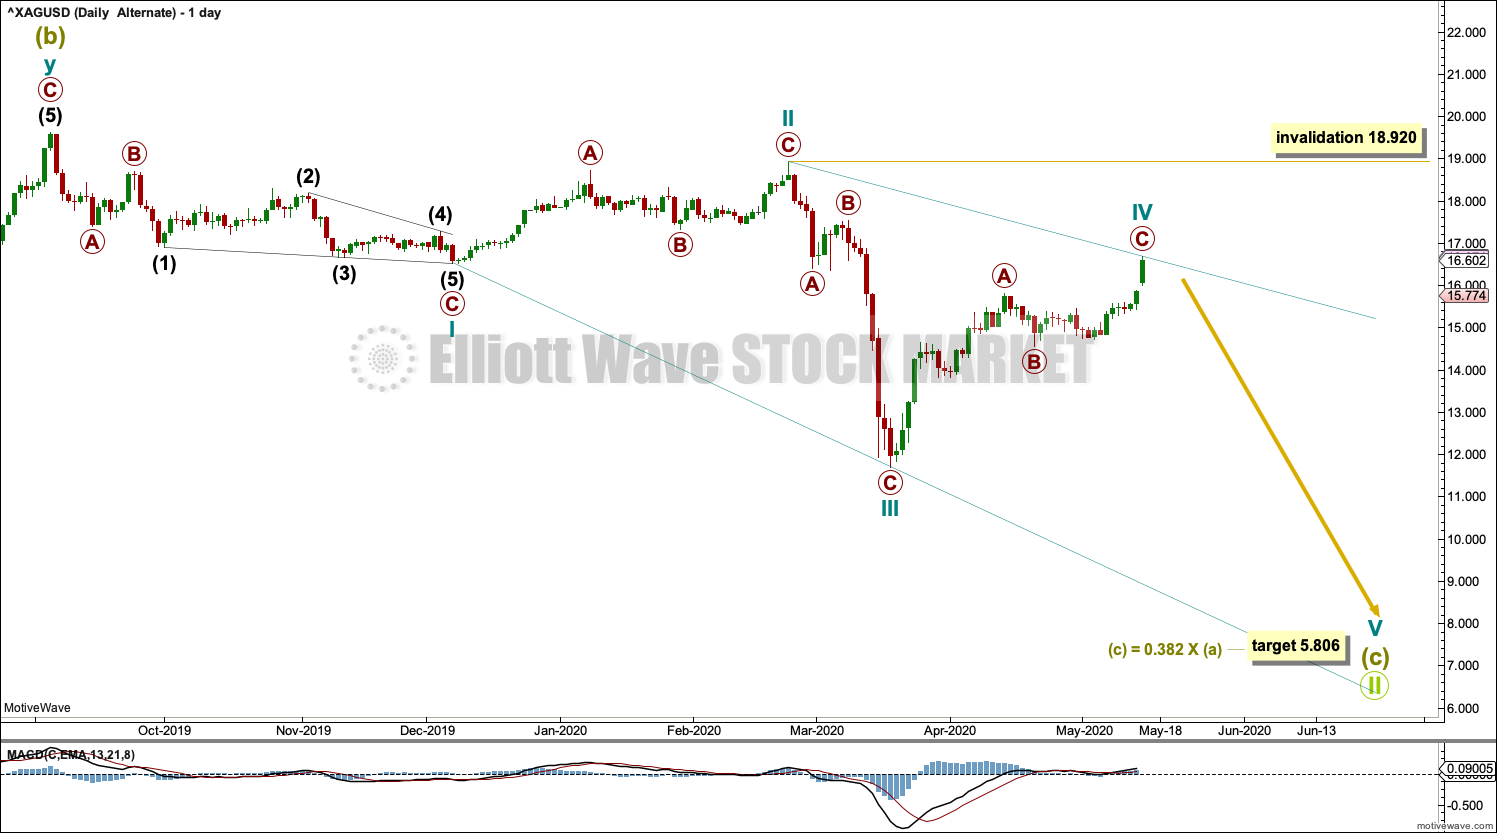
It is also possible that Super Cycle wave (c) may be completing as an ending diagonal.
All sub-waves within an ending diagonal must subdivide as zigzags. Cycle wave IV must overlap cycle wave I price territory. Cycle wave IV may not move beyond the end of cycle wave II above 18.920.
The diagonal would be expanding: Cycle wave III is longer than cycle wave I, and cycle wave IV is longer than cycle wave II. Cycle wave V must be longer than cycle wave III; it must be longer than 7.217.
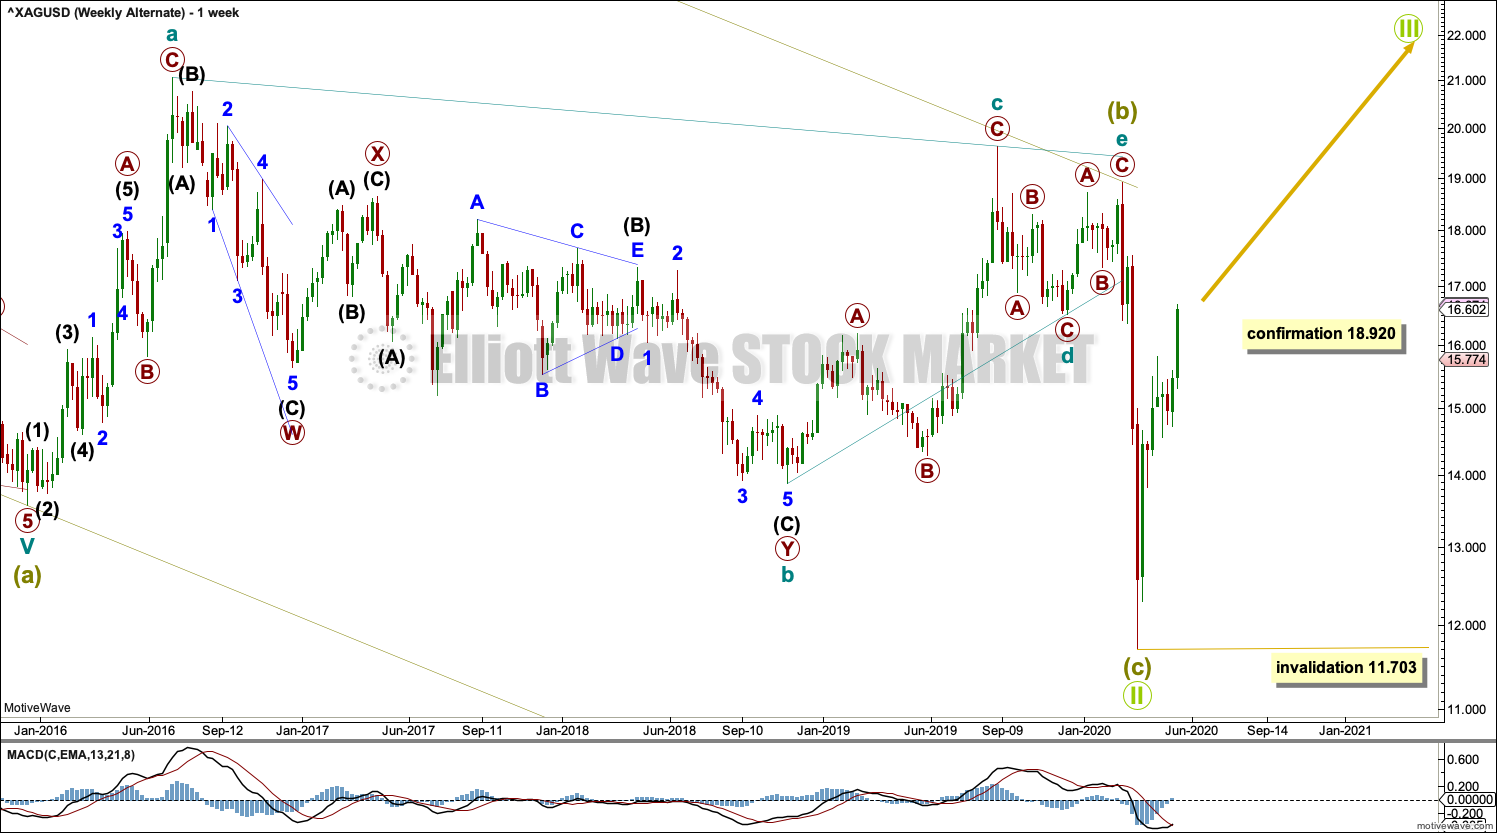
BULLISH WEEKLY CHART
Click chart to enlarge.
This Elliott wave count considers the possibility that Grand Super Cycle wave II may be complete.
If Grand Super Cycle wave II is complete, then within it the most difficult part of the wave count is the structure of Super Cycle wave (b). This wave count considers it may have been a regular contracting triangle.
Elliott wave triangles normally adhere very well to their trend lines, which may be tested within the triangle’s sub-waves. This wave count sees a large breach of the lower b-d triangle trend line from April 2019 to July 2019. This triangle does not have the right look, although it meets all Elliott wave rules. The probability of this wave count must be judged to be low.
A new high above 18.920 by any amount at any time frame would confirm this wave count and invalidate any bearish wave count.
TECHNICAL ANALYSIS
WEEKLY CHART
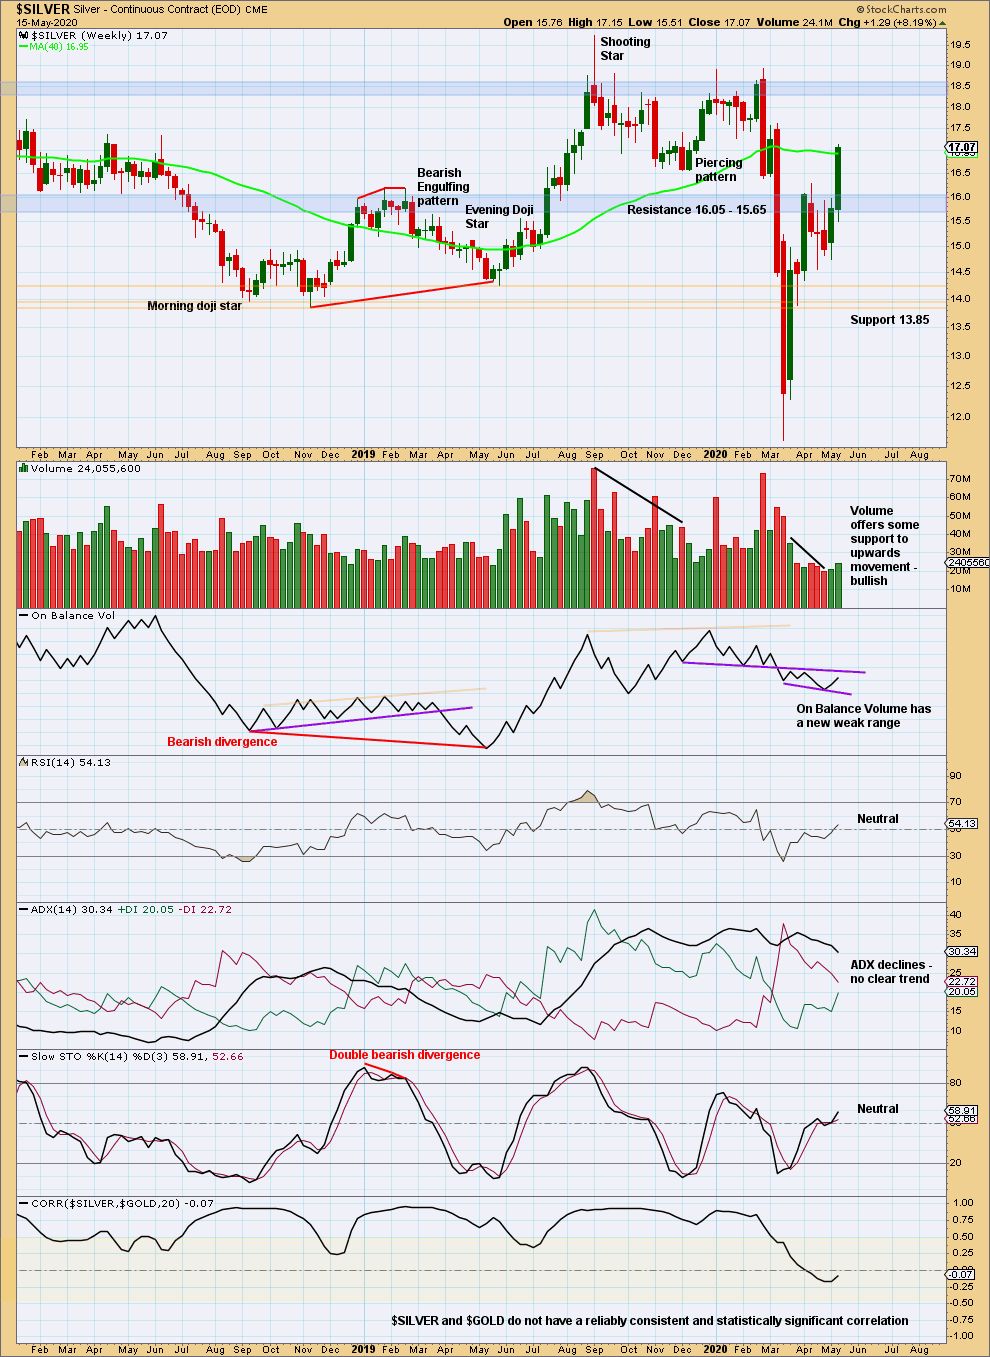
Click chart to enlarge. Chart courtesy of StockCharts.com.
A strong upwards week with support from volume suggests more upwards movement next week.
DAILY CHART
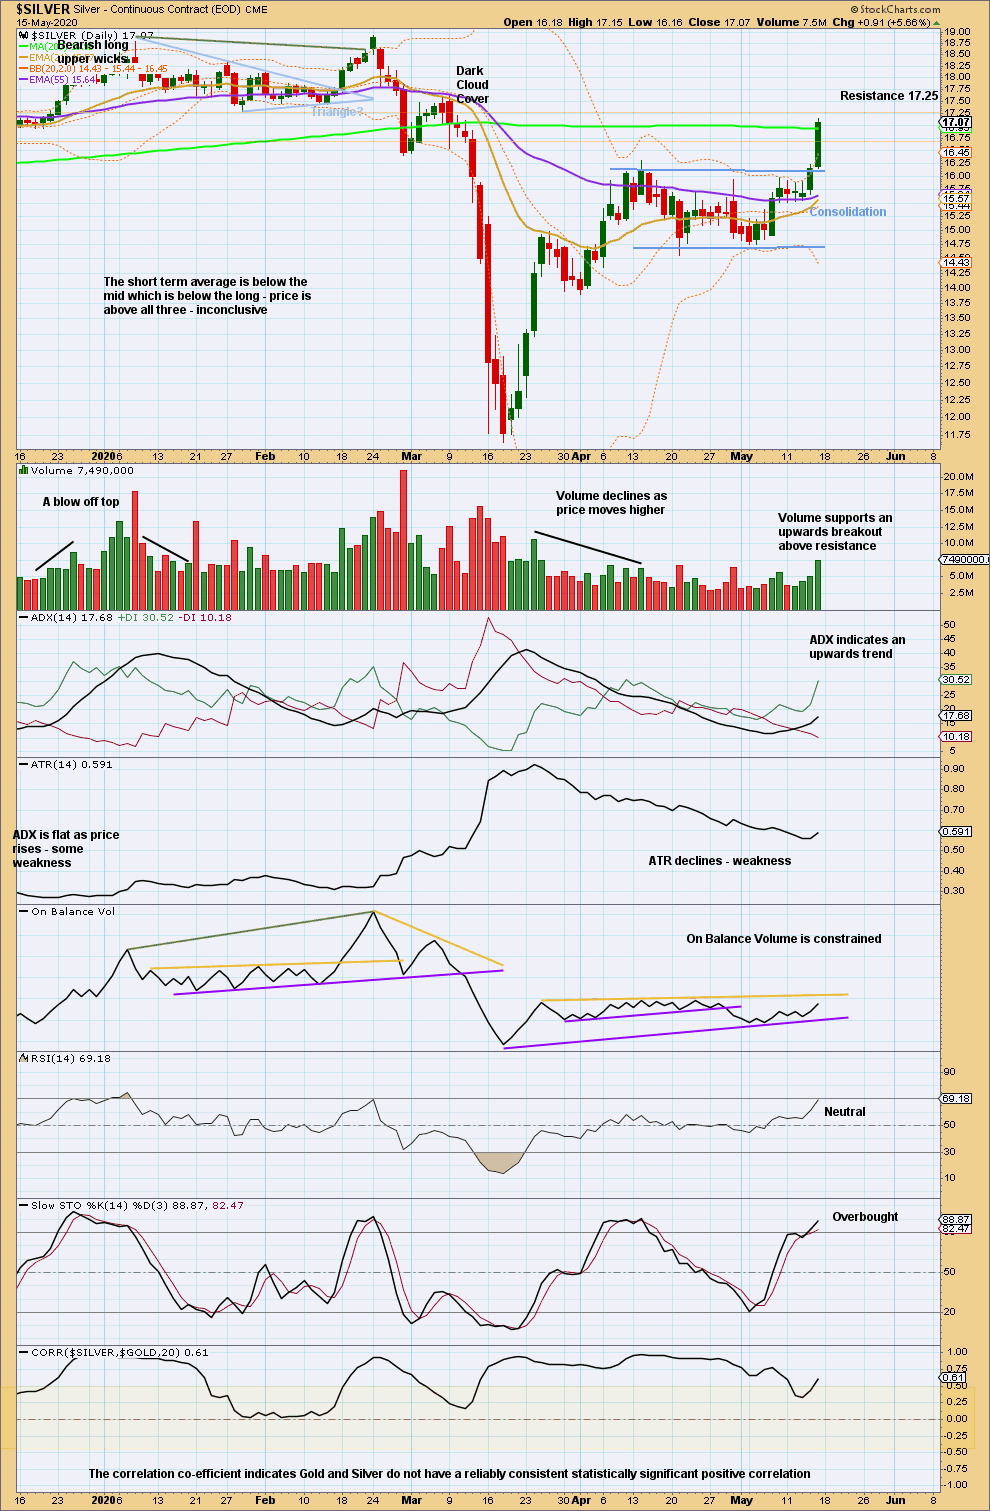
Click chart to enlarge. Chart courtesy of StockCharts.com.
A breakout from a consolidation with support from volume has been effected on the 14th of May, with confirmation on the 15th of May in another strong upwards day. A target from the consolidation is calculated t 17.84. Look for a possible pullback to test support about 16.10.
Published @ 07:45 a.m. EST on May 18, 2020.
—
Careful risk management protects your trading account(s).
Follow my two Golden Rules:
1. Always trade with stops.
2. Risk only 1-5% of equity on any one trade.
—
New updates to this analysis are in bold.