
SILVER: Elliott Wave and Technical Analysis | Charts – May 29, 2020
Summary: The main wave count now expects new highs substantially above 49.752 in coming years.
For the short term, if price can break above resistance at the upper edge of the channel on the Elliott wave charts, then a target for a third wave to end is at 21.20. But if price reaches resistance and turns down early next week, then a correction to last at least a week may begin, which should remain above 15.810.
It is possible that Silver may remain in a larger bear market while price remans below 18.920. The final target remains at 5.806.
ELLIOTT WAVE COUNTS
MAIN WAVE COUNT
MONTHLY CHART
Click chart to enlarge.
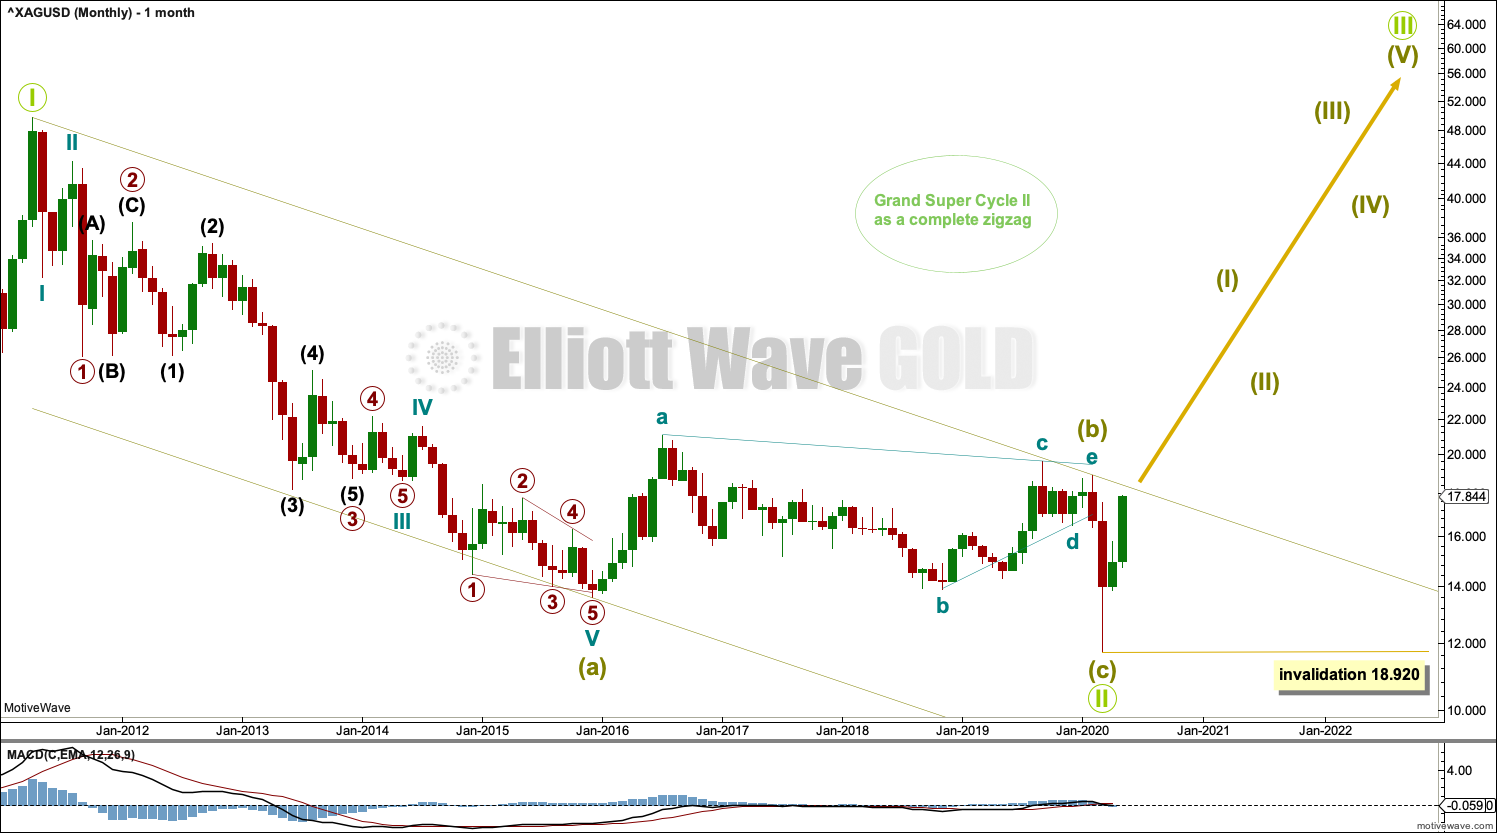
The bear market for Silver may be complete.
This Elliott wave structure for this bear market is labelled as a single zigzag for Grand Super Cycle wave II. Single zigzags are the most common Elliott wave corrective structure.
Within the zigzag: Super Cycle wave (a) subdivides as a five wave impulse, Super Cycle wave (b) subdivides as a complete regular contracting triangle, and Super Cycle wave (c) subdivides as a complete five wave impulse that is relatively brief and shallow.
Draw a channel about the entire bear market of Grand Super Cycle wave II as shown. A breach of the upper edge of this channel would add confidence to this wave count. It is possible that price may find resistance at the upper edge of this channel, which may initiate a pullback.
Grand Super Cycle wave III must subdivide as a five wave impulse at Super Cycle degree.
WEEKLY CHART
Click chart to enlarge.
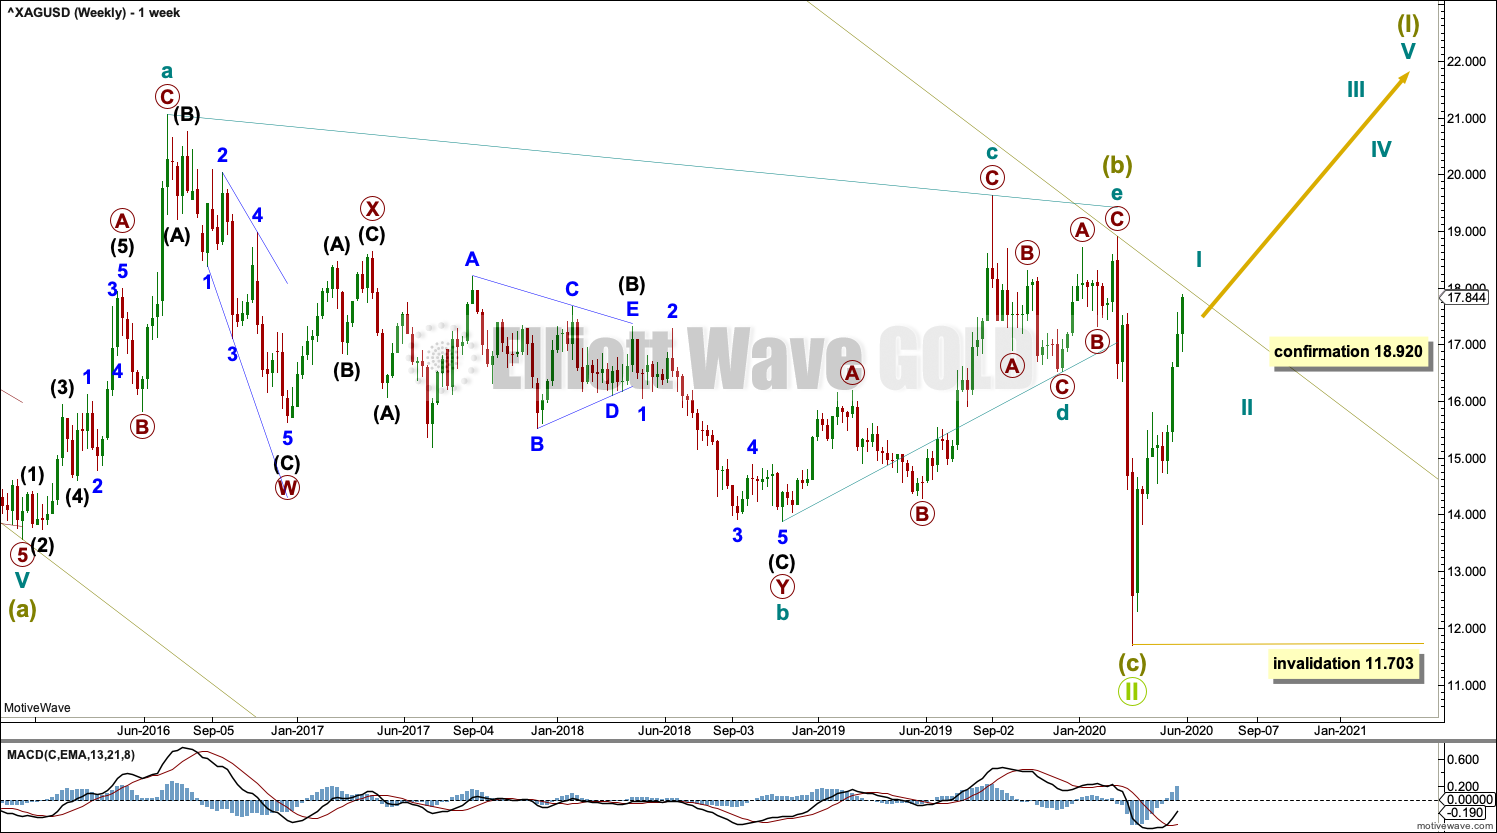
Grand Super Cycle wave II may be a complete zigzag. A new bull market may have begun for Silver.
The channel about Grand Super Cycle wave II is copied over from the monthly chart and extended outwards. The upper edge may provide resistance and may initiate a pullback.
Super Cycle wave (I) must subdivide as a five wave motive structure, either an impulse or a leading diagonal. An impulse is much more common, so that is what shall be expected unless overlapping suggests a diagonal should be considered.
Cycle wave I may be incomplete.
Cycle wave II may not move beyond the start of cycle wave I below 11.703.
DAILY CHART
Click chart to enlarge.
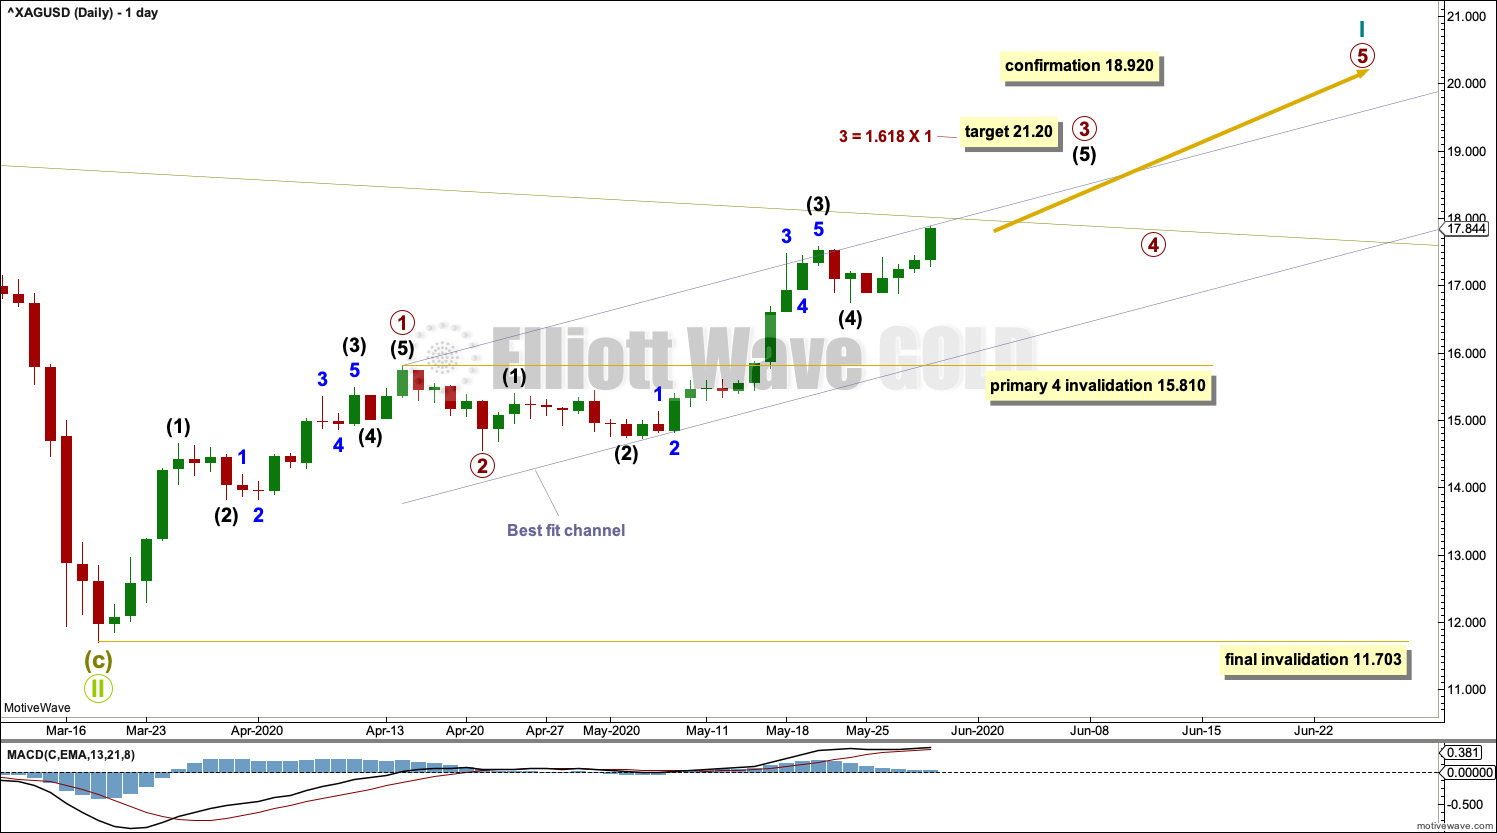
Cycle wave I may be an incomplete five wave impulse. Primary waves 1 and 2 within the impulse may be complete.
Primary wave 3 may end early next week if it finds resistance at the upper edge of the channel copied over from weekly and monthly charts. If price closes above the upper edge of this channel, then primary wave 3 may end above it and primary wave 4 may find support there.
A target is calculated for primary wave 3 that expects it to end above the channel. First, price needs to break above resistance at the upper edge of the channel for confidence in this target.
Primary wave 4 may not move into primary wave 1 price territory below 15.810.
Draw a channel as shown about cycle wave I. Primary wave 4 may find support about the lower edge. If this channel is breached by downwards movement, then that may be an indication that cycle wave I may be over and then cycle wave II may be underway.
Cycle wave II may not move beyond the start of cycle wave I below 11.703.
ALTERNATE DAILY CHART
Click chart to enlarge.
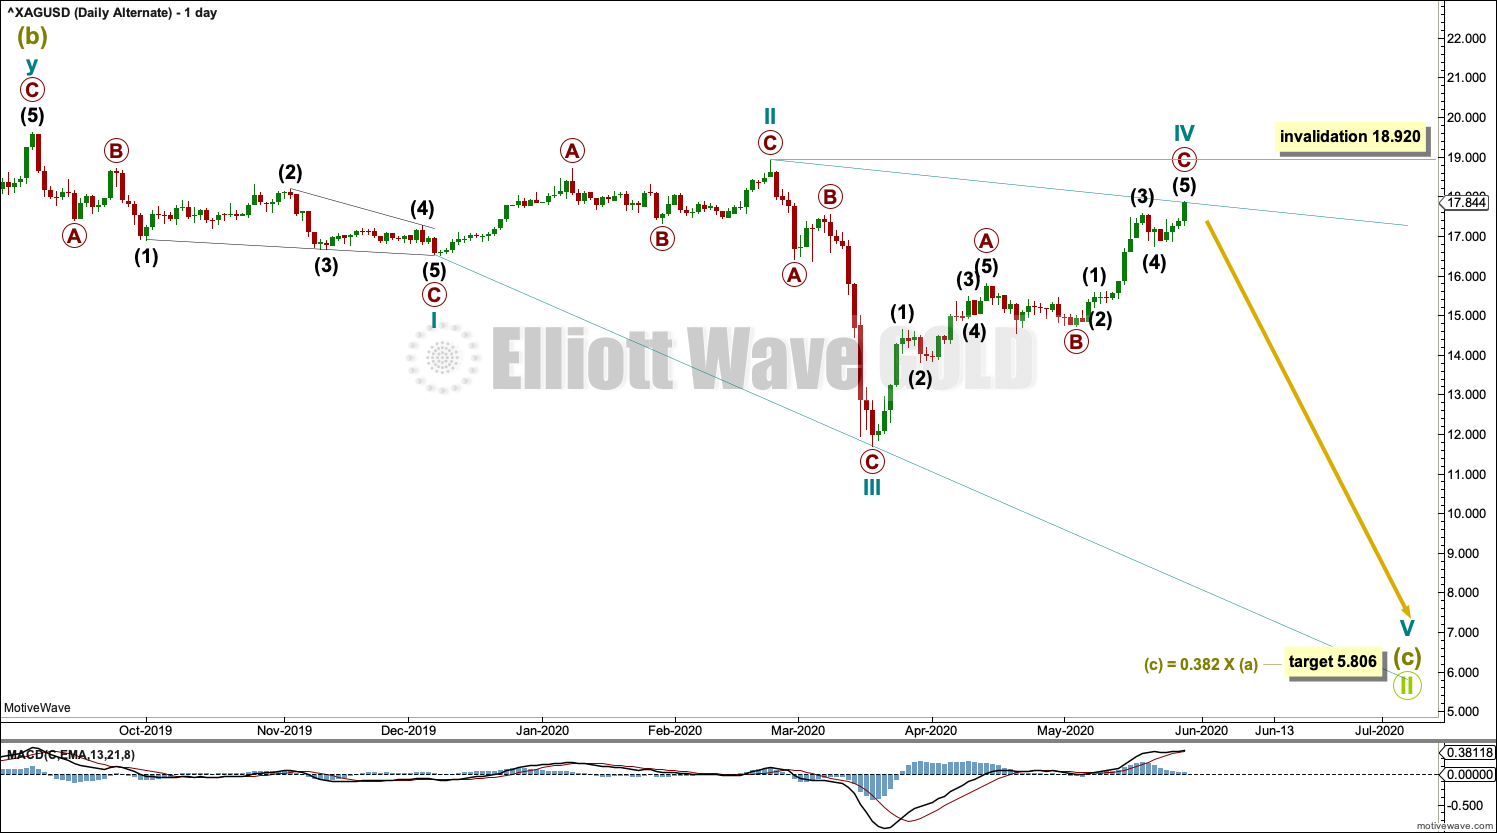
It is also possible that Grand Super Cycle wave II may not be complete, and that within it Super Cycle wave (c) may be completing as an ending diagonal.
All sub-waves within an ending diagonal must subdivide as zigzags. Cycle wave IV must overlap cycle wave I price territory. Cycle wave IV may not move beyond the end of cycle wave II above 18.920.
The diagonal would be expanding: Cycle wave III is longer than cycle wave I, and cycle wave IV is longer than cycle wave II. Cycle wave V must be longer than cycle wave III; it must be longer than 7.217.
This wave count no longer has the right look. It looks forced, so it is an alternate. However, it may still be useful to the analysis as when it may be invalidated with a new high above 18.920. That would add confidence to the main wave count and a bull market for Silver.
TECHNICAL ANALYSIS
WEEKLY CHART
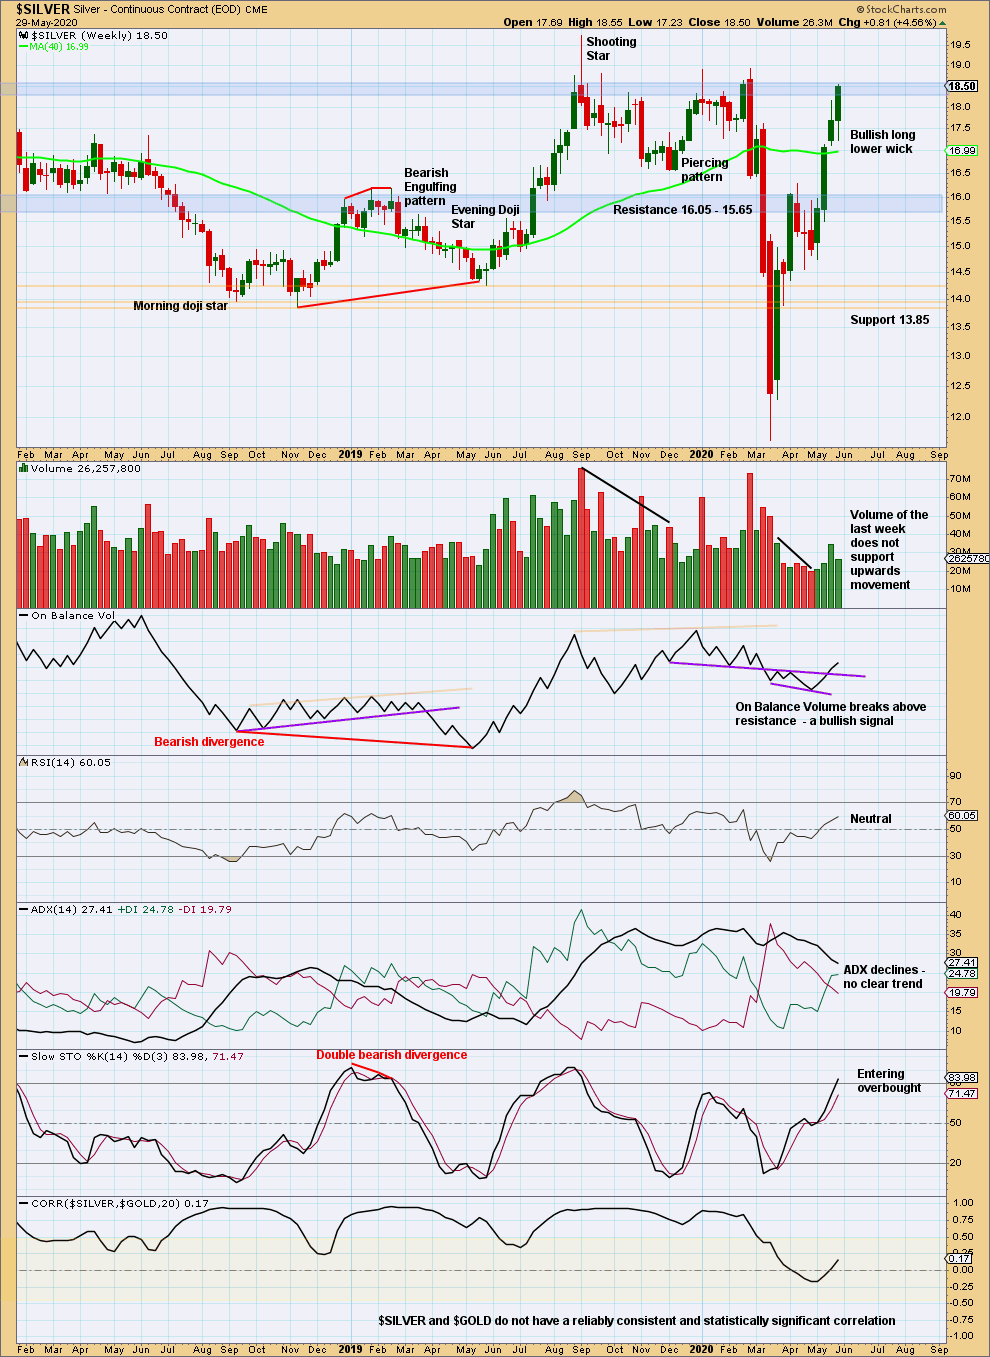
Click chart to enlarge. Chart courtesy of StockCharts.com.
There is a zone of very strong resistance in the shaded area about 18.30 to 18.60. This may force a pullback about here.
DAILY CHART
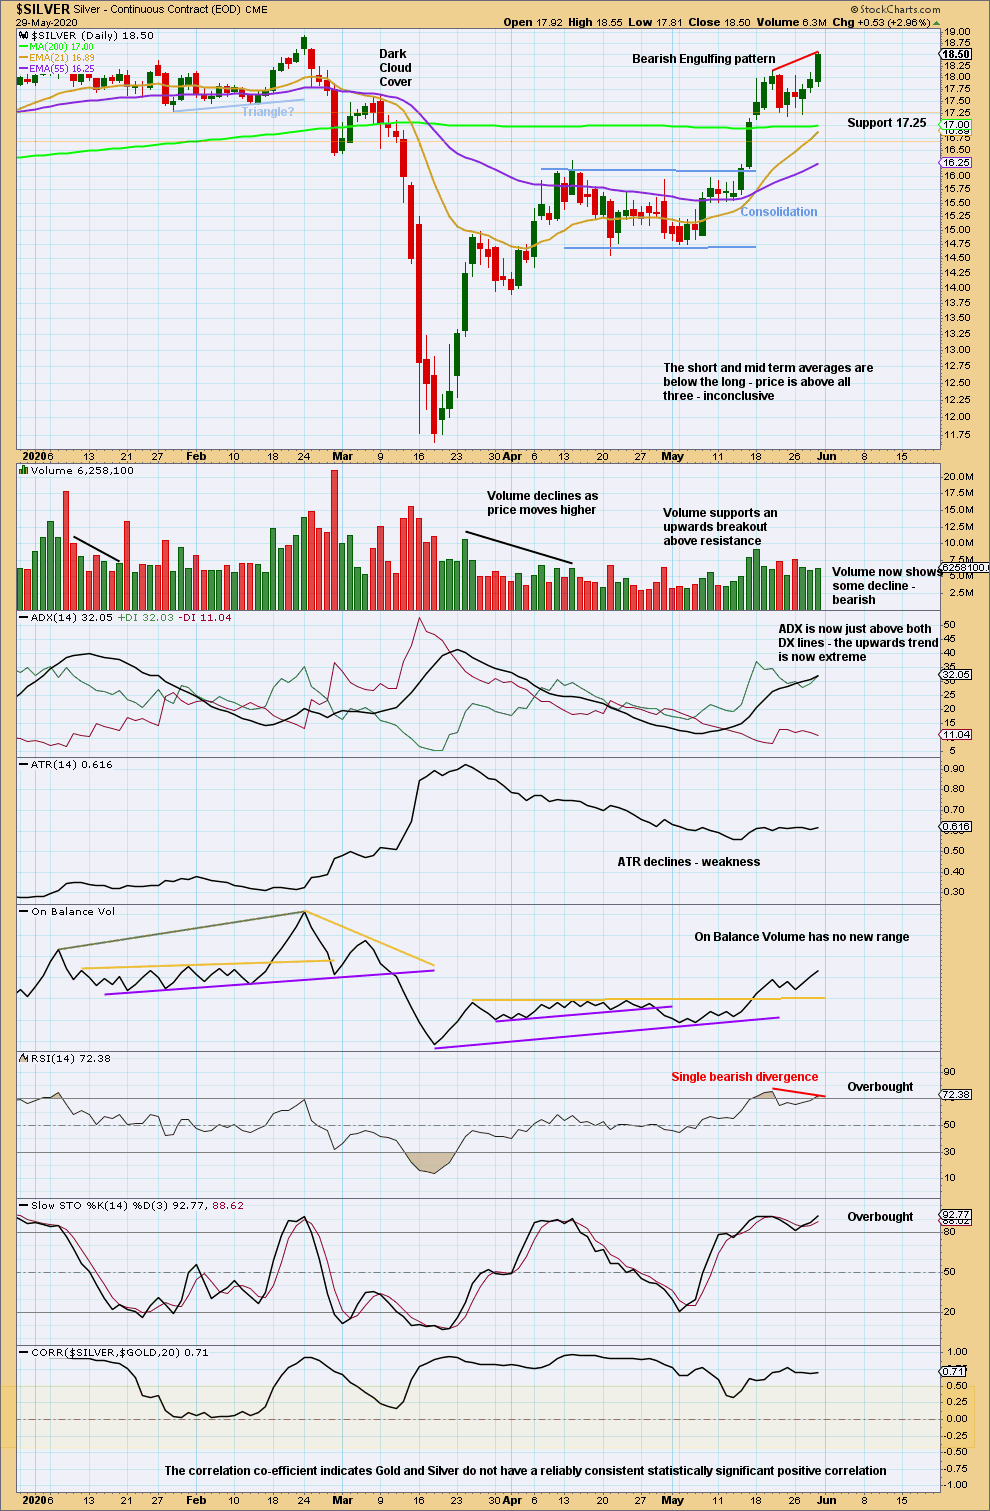
Click chart to enlarge. Chart courtesy of StockCharts.com.
An upwards trend is just now extreme. RSI exhibits bearish divergence. With price almost at resistance (Elliott wave charts and the weekly technical analysis chart), there is a high risk here that a pullback may develop that may be larger and deeper than prior small pullbacks, at least since early May 2020.
Published @ 06:25 p.m. EST on May 30, 2020.
—
Careful risk management protects your trading account(s).
Follow my two Golden Rules:
1. Always trade with stops.
2. Risk only 1-5% of equity on any one trade.
—
New updates to this analysis are in bold.