
US OIL: Elliott Wave and Technical Analysis | Charts – May 8, 2020
Upwards movement continues for Oil as the main Elliott wave count expected.
Technical analysis has expected that a sustainable low is in place for Oil and a new bull market is beginning.
Summary: Oil may have found a major sustainable low. Technical analysis supports this view. Confidence in this view may be had with a new high above 29.14.
MAIN ELLIOTT WAVE COUNT – BEARISH
MONTHLY CHART
Click chart to enlarge.
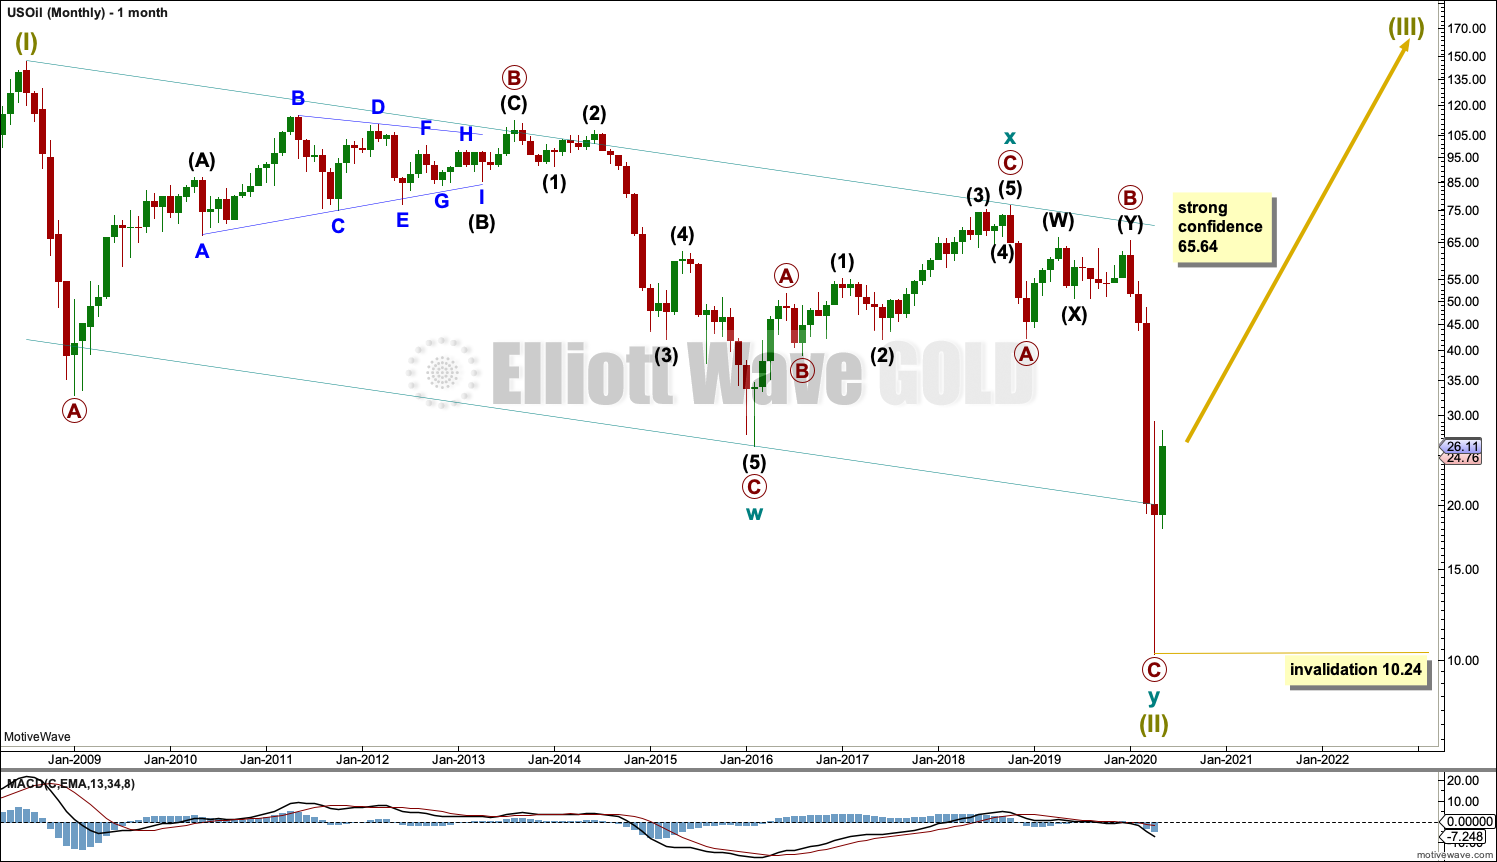
The basic Elliott wave structure is five steps forward and three steps back. This Elliott wave count expects that US Oil has completed a three steps back pattern, which began in July 2008. The Elliott wave count expects that the bear market for US Oil may now be over.
This Elliott wave corrective structure is a double zigzag, which is a fairly common structure. The correction is labelled Super Cycle wave (II).
The first zigzag in the double is complete and labelled cycle wave w. The double is joined by a three in the opposite direction labelled cycle wave x, which subdivides as a zigzag. The second zigzag in the double is almost complete, labelled cycle wave y.
The purpose of a second zigzag in a double zigzag is to deepen the correction when the first zigzag does not move price deep enough. To achieve this purpose cycle wave y may be expected to move reasonably below the end of cycle wave w at 26.06. This purpose has now been achieved. The structure within primary wave C may now be complete.
A channel is drawn about Super Cycle wave (II): draw the first trend line from the start of cycle wave w to the end of cycle wave x, then place a parallel copy on the end of cycle wave w. Price has bounced up off the channel. This trend line is breached, which is a typical look for the end of a movement for a commodity.
Following five waves up and three steps back should be another five steps up. Super Cycle wave (III) may last a generation and must make a new high above the end of Super Cycle wave (I) at 146.73.
Super Cycle wave (III) may last a generation. It may only subdivide as a five wave impulse. New trends for Oil usually start out very slowly with short first waves and deep time consuming second wave corrections. Basing action over a few years may now begin.
WEEKLY CHART
Click chart to enlarge.
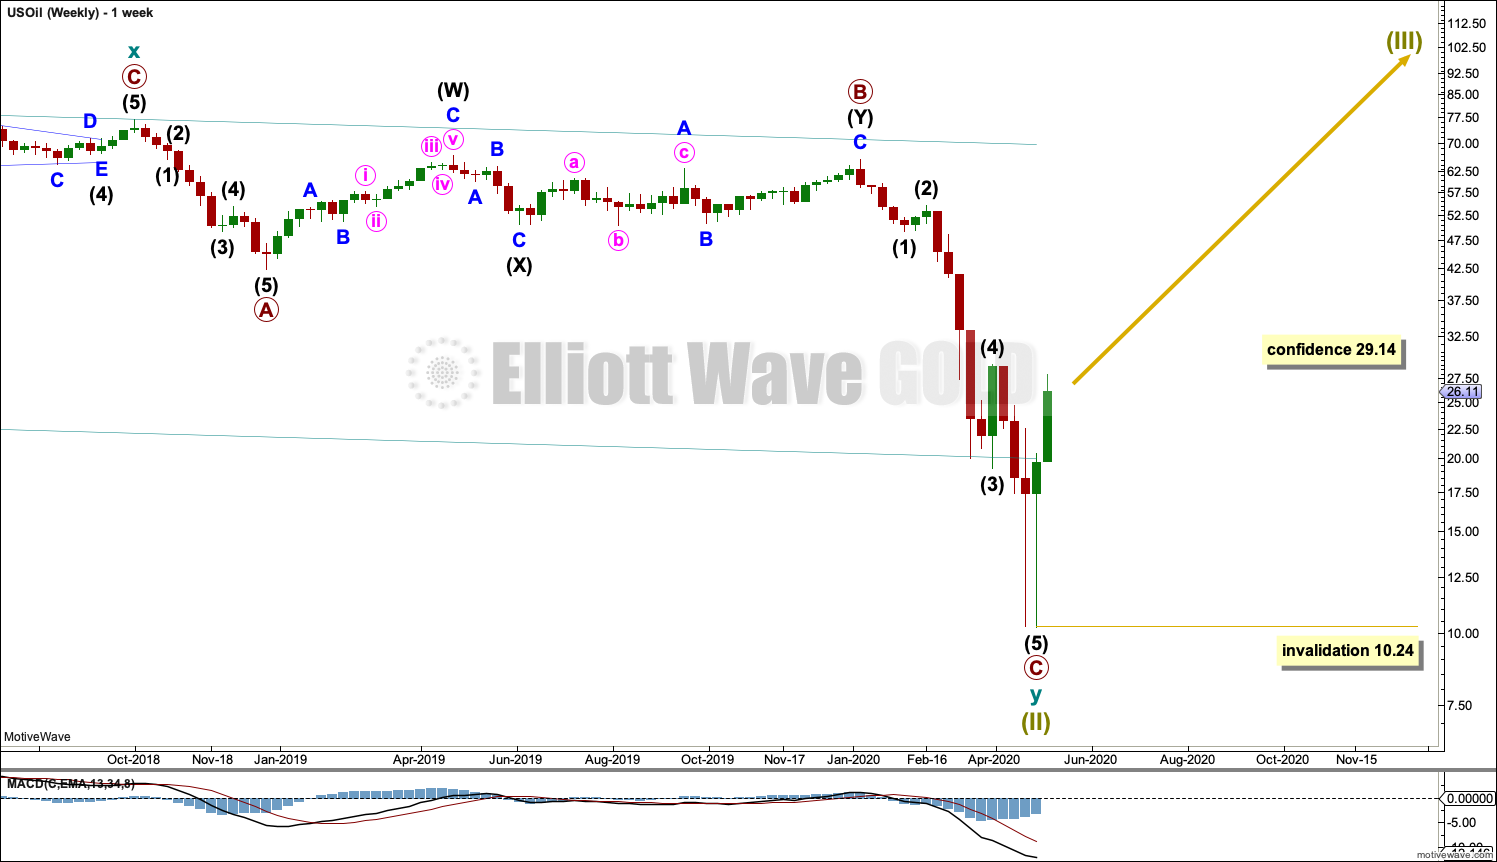
This weekly chart shows all of cycle wave y.
Cycle wave y subdivides as a zigzag.
Primary wave C is now a complete five wave impulse.
Within Super Cycle wave (III): no second wave correction may move beyond the start of its first wave below 10.24.
DAILY CHART
Click chart to enlarge.
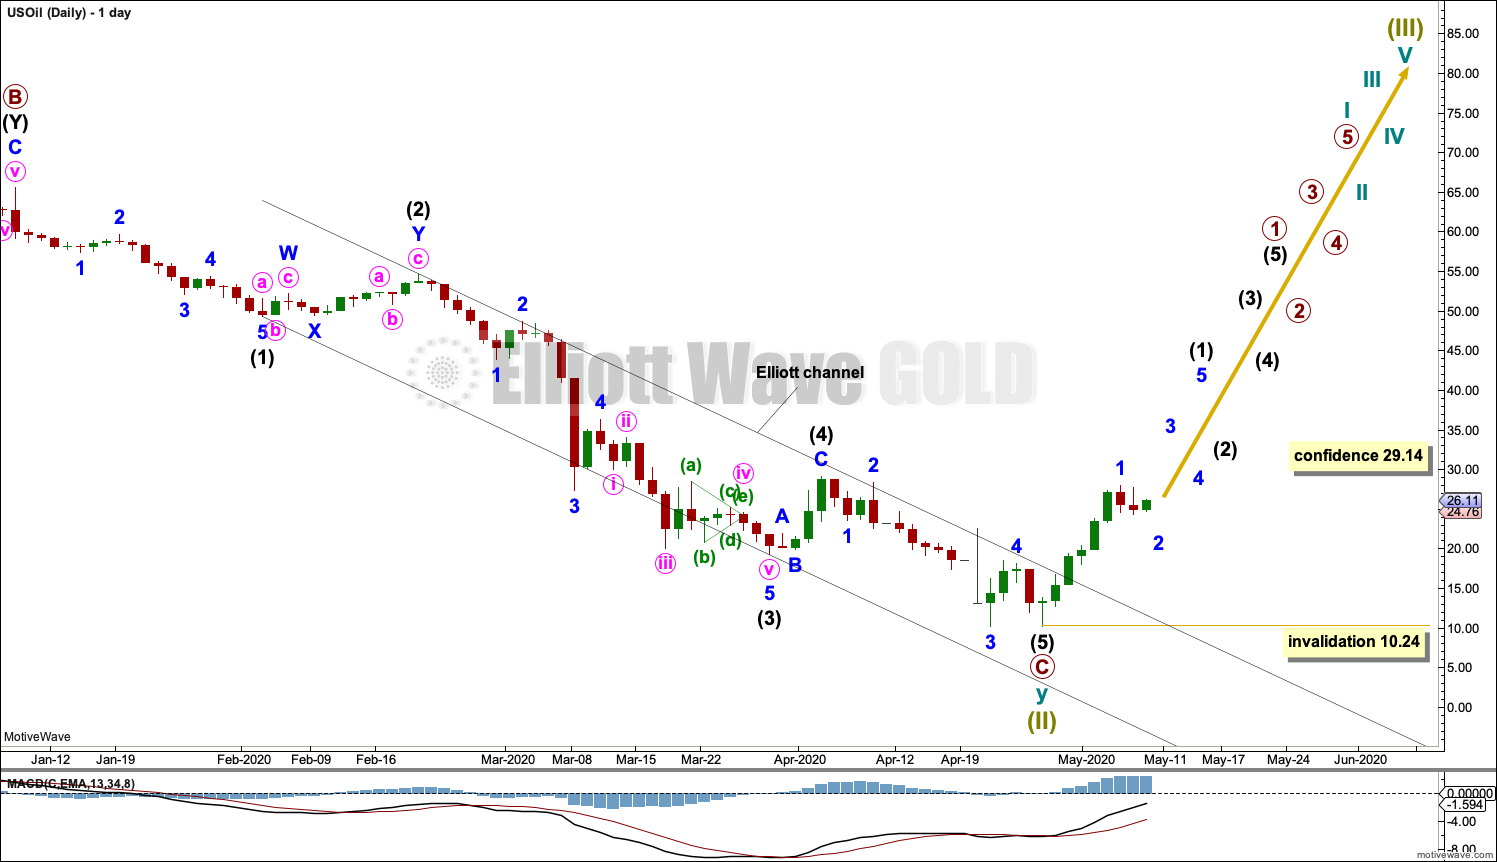
Primary wave C may now be a complete five wave impulse.
Draw an Elliott channel about primary wave C. Draw the first trend line from the ends of intermediate waves (1) to (3), then place a parallel copy on the end of intermediate wave (2). A breach of this channel by upwards movement is now an early indication of a sustainable low.
Within a new trend: no second wave correction may move beyond the start of the trend, below 10.27.
This week labels are added for all of Super Cycle wave (III). Although the numbers are placed along the direction arrow, this does not mean that it is expected that Super Cycle wave (III) will move in a straight line. Markets do not move in straight lines; there are counter trend movements along the way.
All of the second wave corrections within Super Cycle wave (III) may be deep and time consuming, particularly intermediate wave (2) and primary wave 2. It is normal for Oil for counter trend movements early on in a new developing trend to be deep and time consuming as price forms basing action. This may take several months to possibly even years for Oil.
ALTERNATE DAILY CHART
This week the alternate daily chart is no longer published due to lacking the right look with poor proportions. The idea would be invalidated with a new high above 29.14.
ALTERNATE ELLIOTT WAVE COUNT
MONTHLY CHART
Click chart to enlarge.
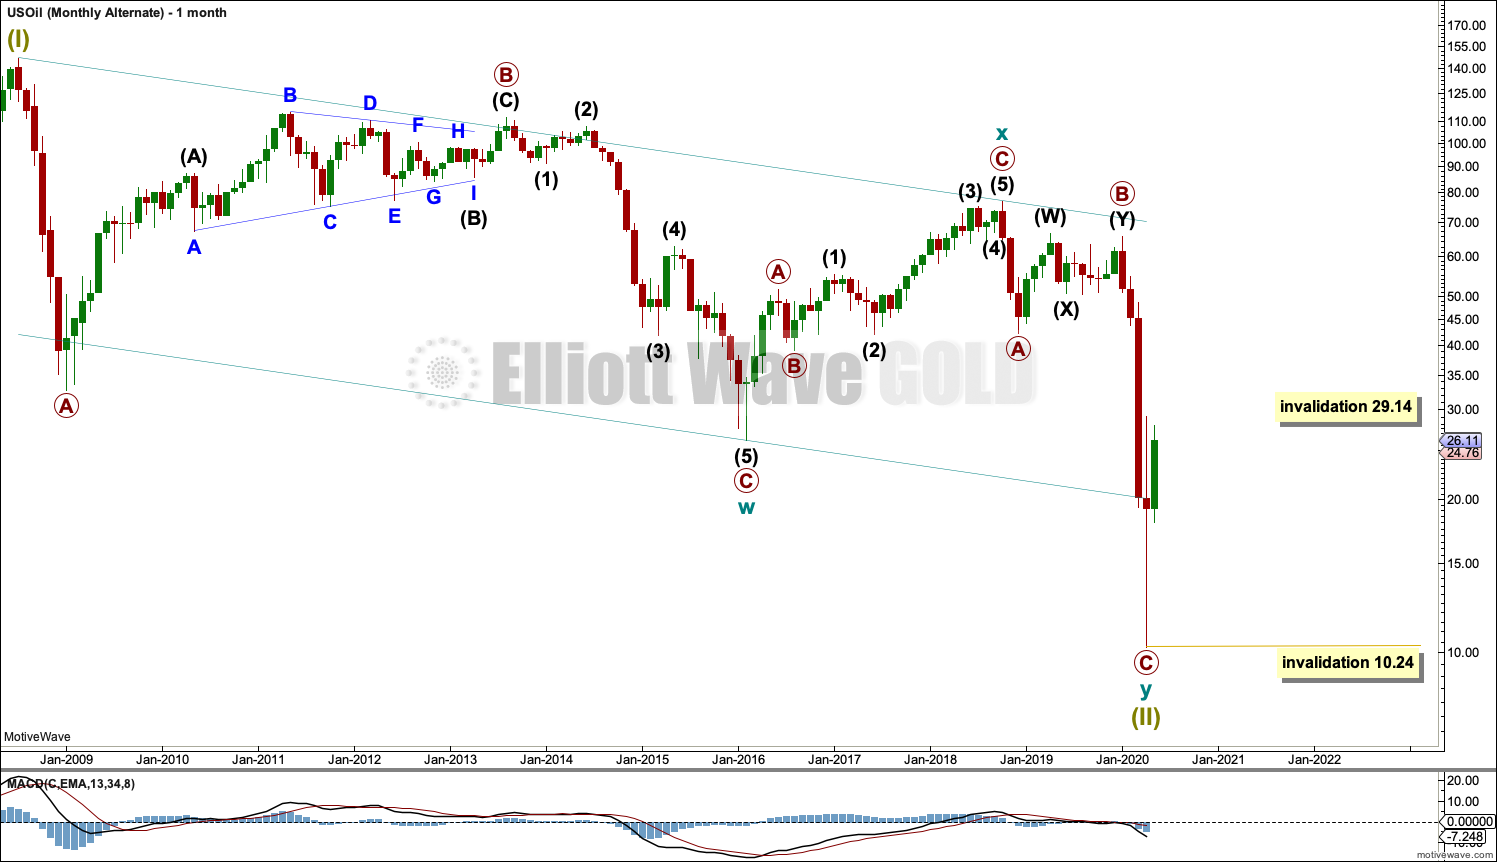
This chart tries to illustrate another possibility, that it may be possible that the market for Oil could cease to exist. The difference between this alternate monthly chart and the main monthly chart is that this chart has no upwards (orange) arrow pointing to Super Cycle wave (III).
There is some historical precedent for this. Throughout history, occasionally, bubbles may form then burst and then the market may cease to exist. One of the most famous examples may be the price of tulips following the burst of the tulip bubble in 1637. Tulip prices never again recovered bubble heights.
From a fundamental point of view this concept may encompass new emerging technologies that may replace old oil reliant technologies.
This idea is presented in the spirit of considering all possibilities. The probability of this idea would become so low as to discard it if price makes a new high above 29.14.
TECHNICAL ANALYSIS
WEEKLY CHART
Click chart to enlarge. Chart courtesy of StockCharts.com.
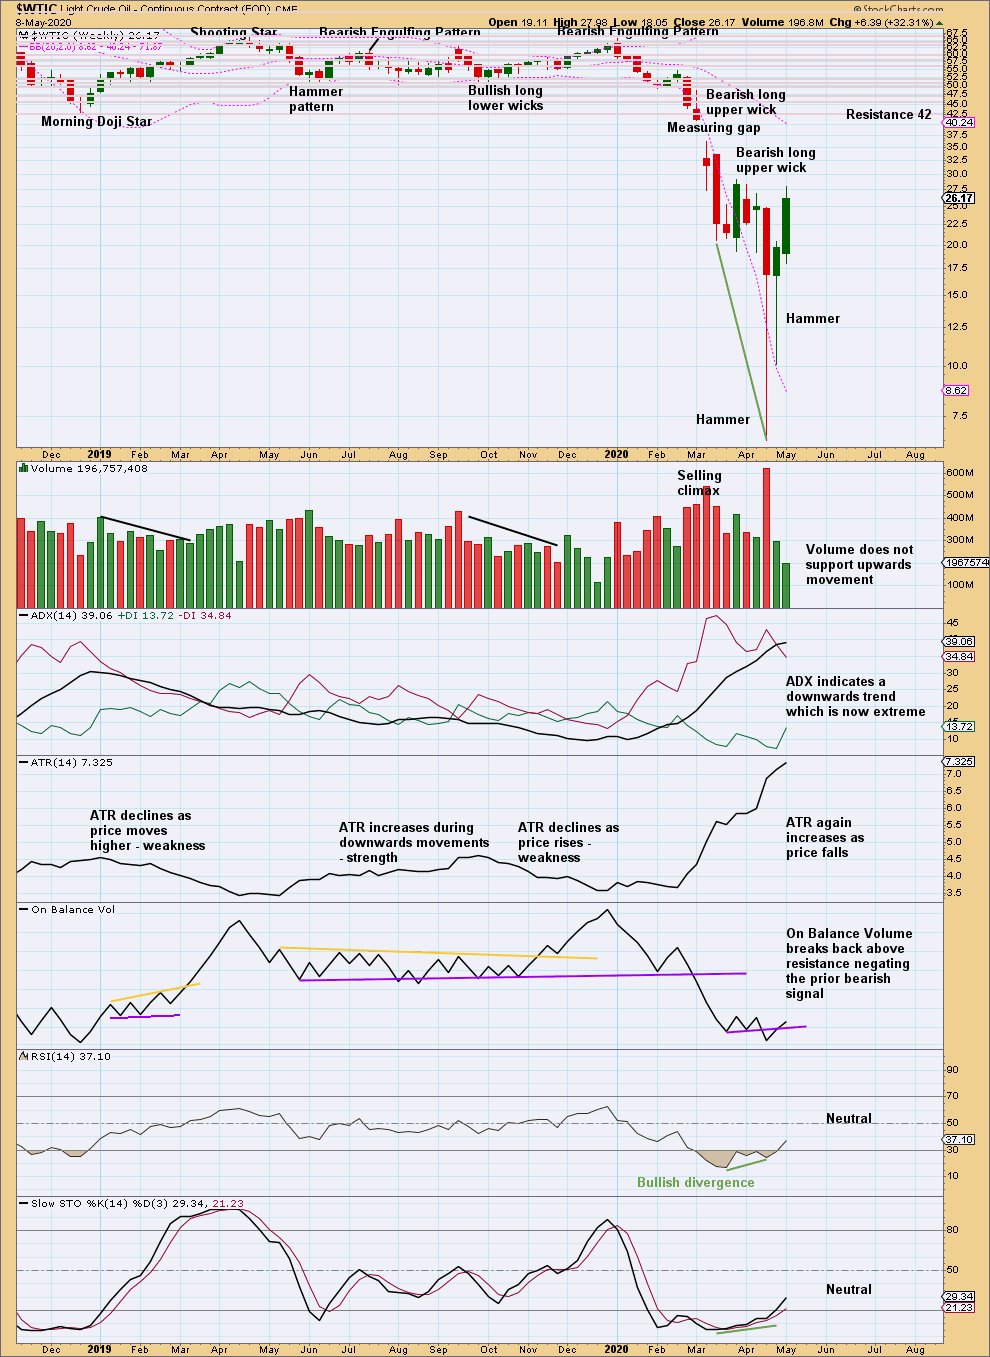
Now two bullish reversal patterns with RSI reaching oversold and then exhibiting bullish divergence suggest a low may now be in place. Some concern this week may be had in upwards movement lacking support from volume. There is reasonable risk here of a pullback.
DAILY CHART
Click chart to enlarge. Chart courtesy of StockCharts.com.
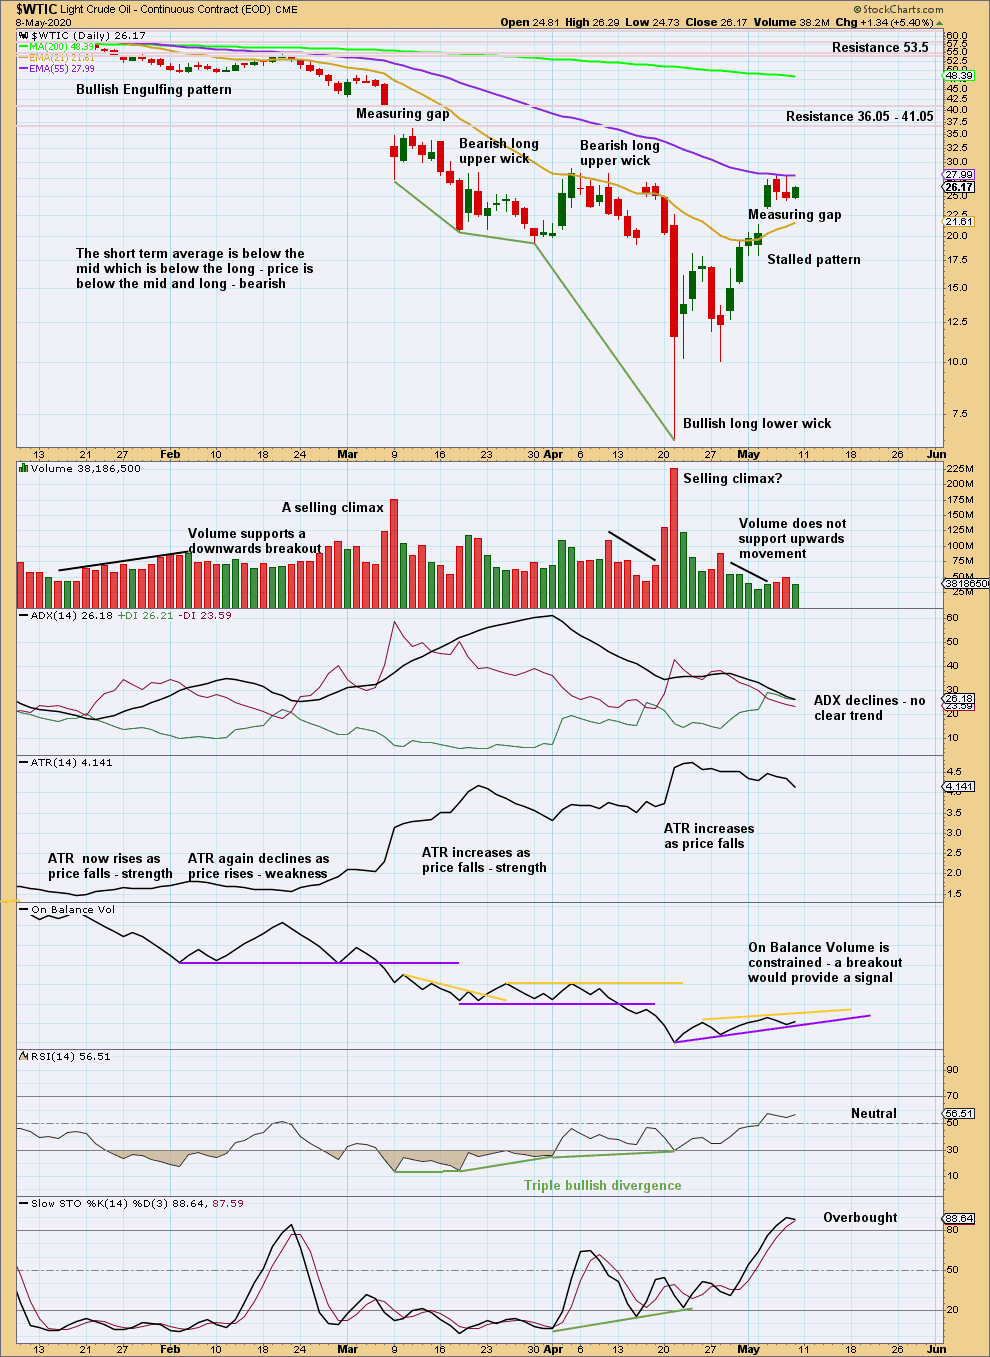
The measuring gap gives a target at 34.73, but some doubt over this target may be had due to sideways movement of the last three sessions.
If the gap remains open at 21.42, then the short-term outlook may remain bullish. However, if the gap is closed with a new low below 21.42, then expect a pullback has begun. A pullback may find initial support about 18.46.
Published @ 02:12 p.m. EST on May 9, 2020.
—
Careful risk management protects your trading account(s).
Follow my two Golden Rules:
1. Always trade with stops.
2. Risk only 1-5% of equity on any one trade.
—
New updates to this analysis are in bold.