
US OIL: Elliott Wave and Technical Analysis | Charts – May 15, 2020
Summary: Oil may have found a major sustainable low. Technical analysis supports this view. Confidence in this view may now be had with a new high above 29.14.
ELLIOTT WAVE COUNT – BEARISH
MONTHLY CHART
Click chart to enlarge.
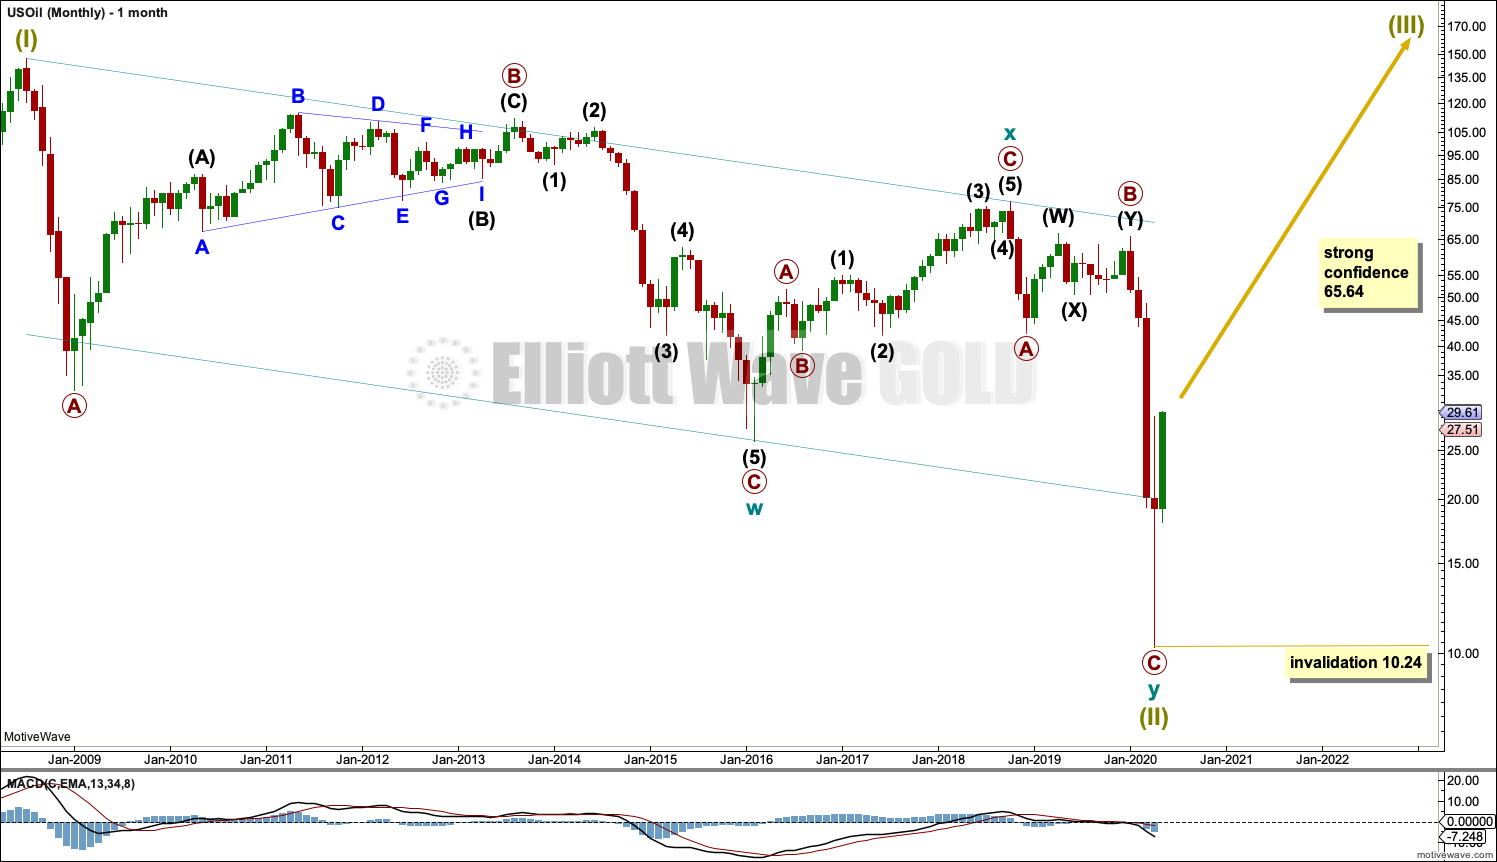
The basic Elliott wave structure is five steps forward and three steps back. This Elliott wave count expects that US Oil has completed a three steps back pattern, which began in July 2008. The Elliott wave count expects that the bear market for US Oil may now be over.
This Elliott wave corrective structure is a double zigzag, which is a fairly common structure. The correction is labelled Super Cycle wave (II).
The first zigzag in the double is complete and labelled cycle wave w. The double is joined by a three in the opposite direction labelled cycle wave x, which subdivides as a zigzag. The second zigzag in the double is almost complete, labelled cycle wave y.
The purpose of a second zigzag in a double zigzag is to deepen the correction when the first zigzag does not move price deep enough. To achieve this purpose cycle wave y may be expected to move reasonably below the end of cycle wave w at 26.06. This purpose has now been achieved. The structure within primary wave C may now be complete.
A channel is drawn about Super Cycle wave (II): draw the first trend line from the start of cycle wave w to the end of cycle wave x, then place a parallel copy on the end of cycle wave w. Price has bounced up off the channel. This trend line is breached, which is a typical look for the end of a movement for a commodity.
Following five waves up and three steps back should be another five steps up. Super Cycle wave (III) may last a generation and must make a new high above the end of Super Cycle wave (I) at 146.73.
Super Cycle wave (III) may only subdivide as a five wave impulse. New trends for Oil usually start out very slowly with short first waves and deep time consuming second wave corrections. Basing action over a few years may now begin.
WEEKLY CHART
Click chart to enlarge.
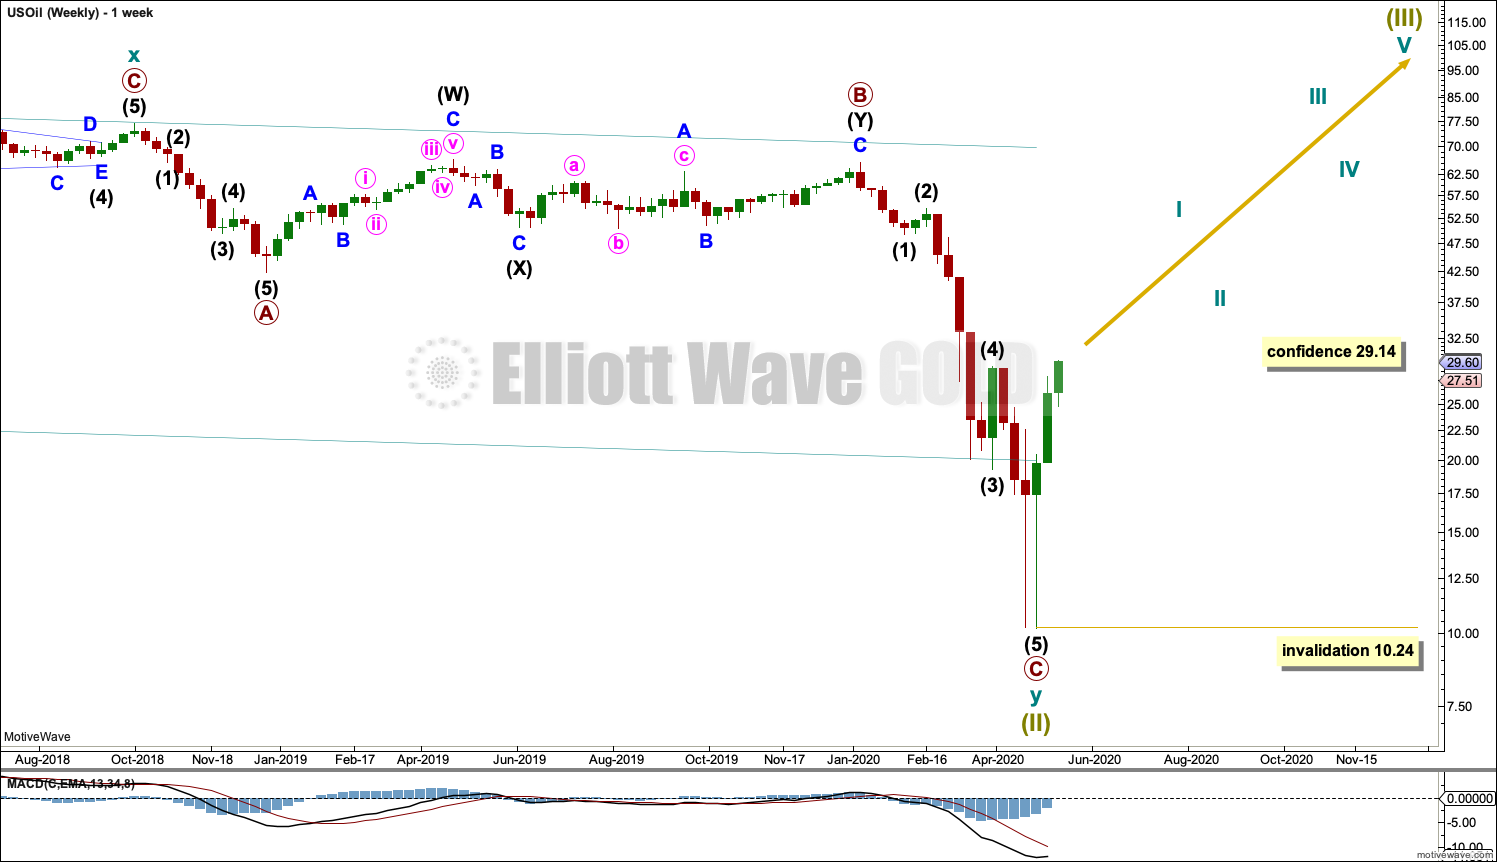
This weekly chart shows all of cycle wave y.
Cycle wave y subdivides as a zigzag.
Primary wave C is now a complete five wave impulse.
Within Super Cycle wave (III): no second wave correction may move beyond the start of its first wave below 10.24.
DAILY CHART
Click chart to enlarge.
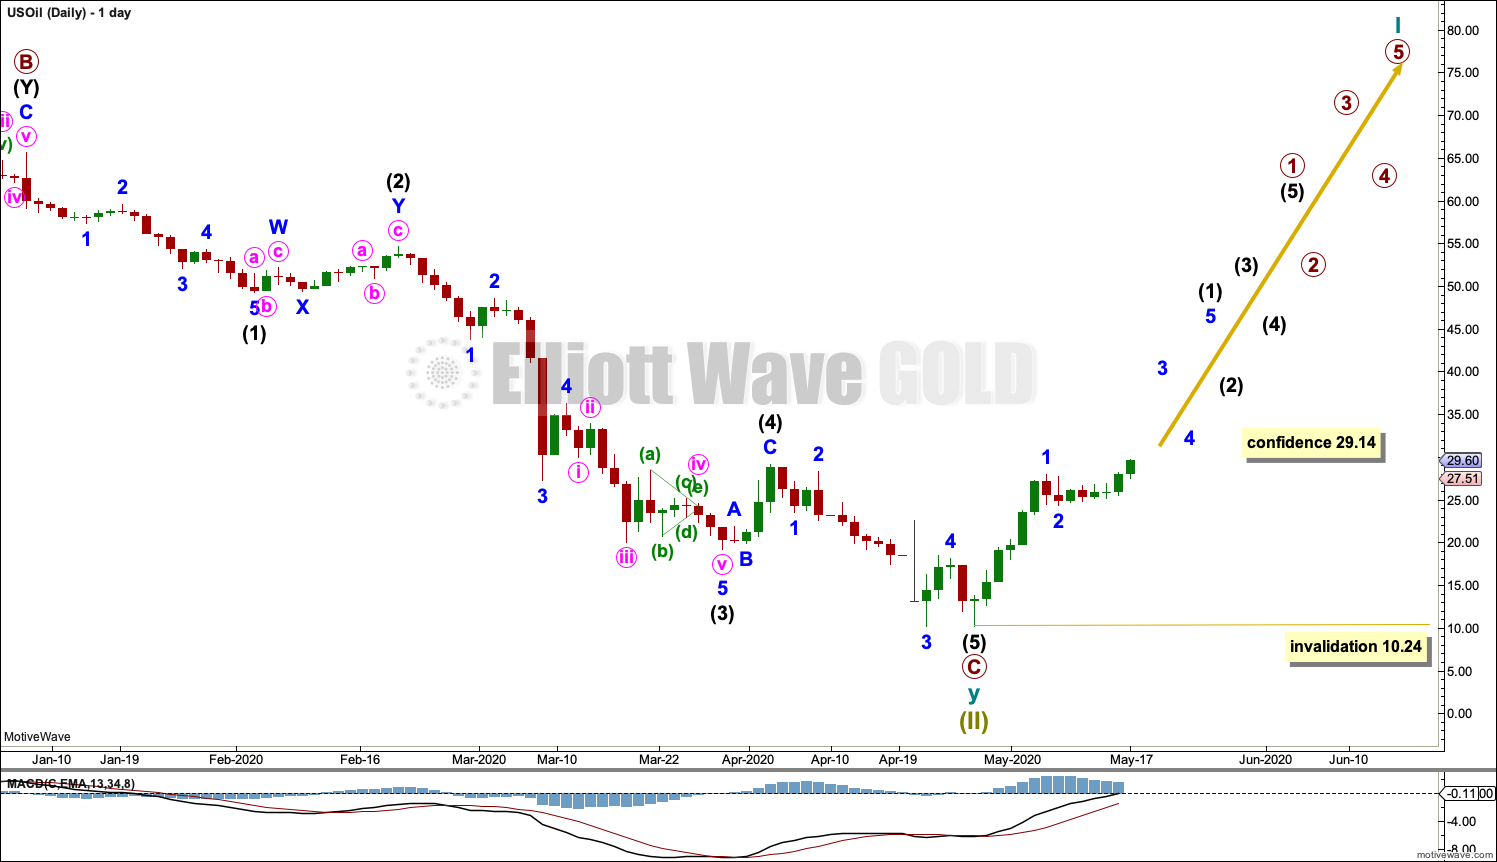
Primary wave C may now be a complete five wave impulse.
Within a new trend: no second wave correction may move beyond the start of the trend, below 10.27.
Labels are added for Super Cycle wave (III). Although the numbers are placed along the direction arrow, this does not mean that it is expected that Super Cycle wave (III) will move in a straight line. Markets do not move in straight lines; there are counter trend movements along the way.
All of the second wave corrections within Super Cycle wave (III) may be deep and time consuming, particularly intermediate wave (2) and primary wave 2. It is normal for Oil for counter trend movements early on in a new developing trend to be deep and time consuming as price forms basing action. This may take several months to possibly even years for Oil.
ALTERNATE ELLIOTT WAVE COUNT
MONTHLY CHART
The alternate idea is now invalidated with a new high above 29.14, so it is discarded.
TECHNICAL ANALYSIS
WEEKLY CHART
Click chart to enlarge. Chart courtesy of StockCharts.com.
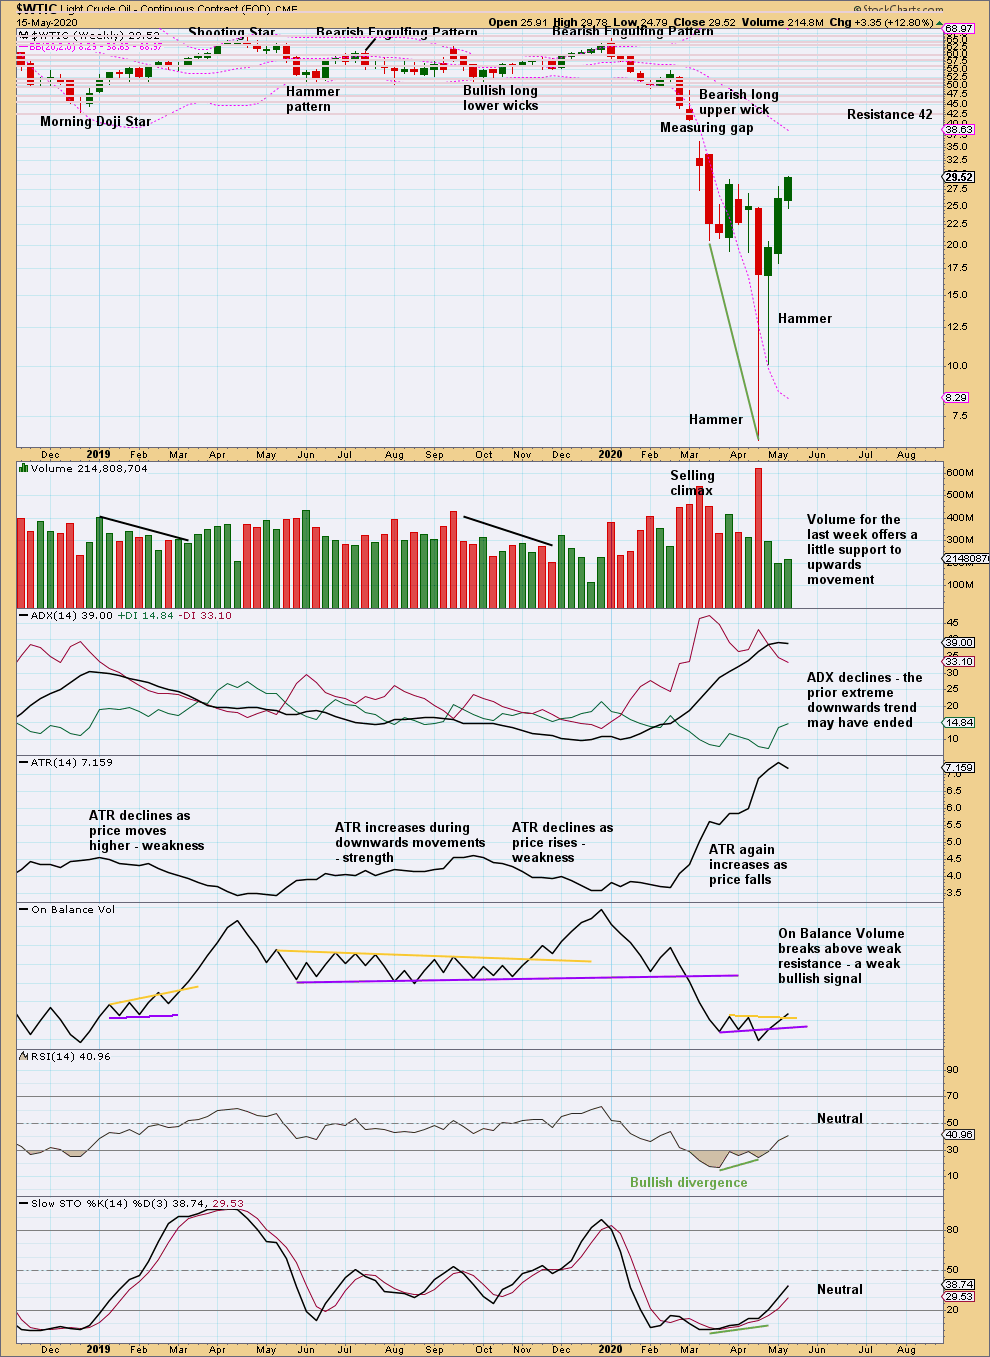
Now two bullish reversal patterns with RSI reaching oversold and then exhibiting bullish divergence suggest a low may now be in place.
This week sees price close near highs with some increase in volume. More upwards movement may be expected next week.
DAILY CHART
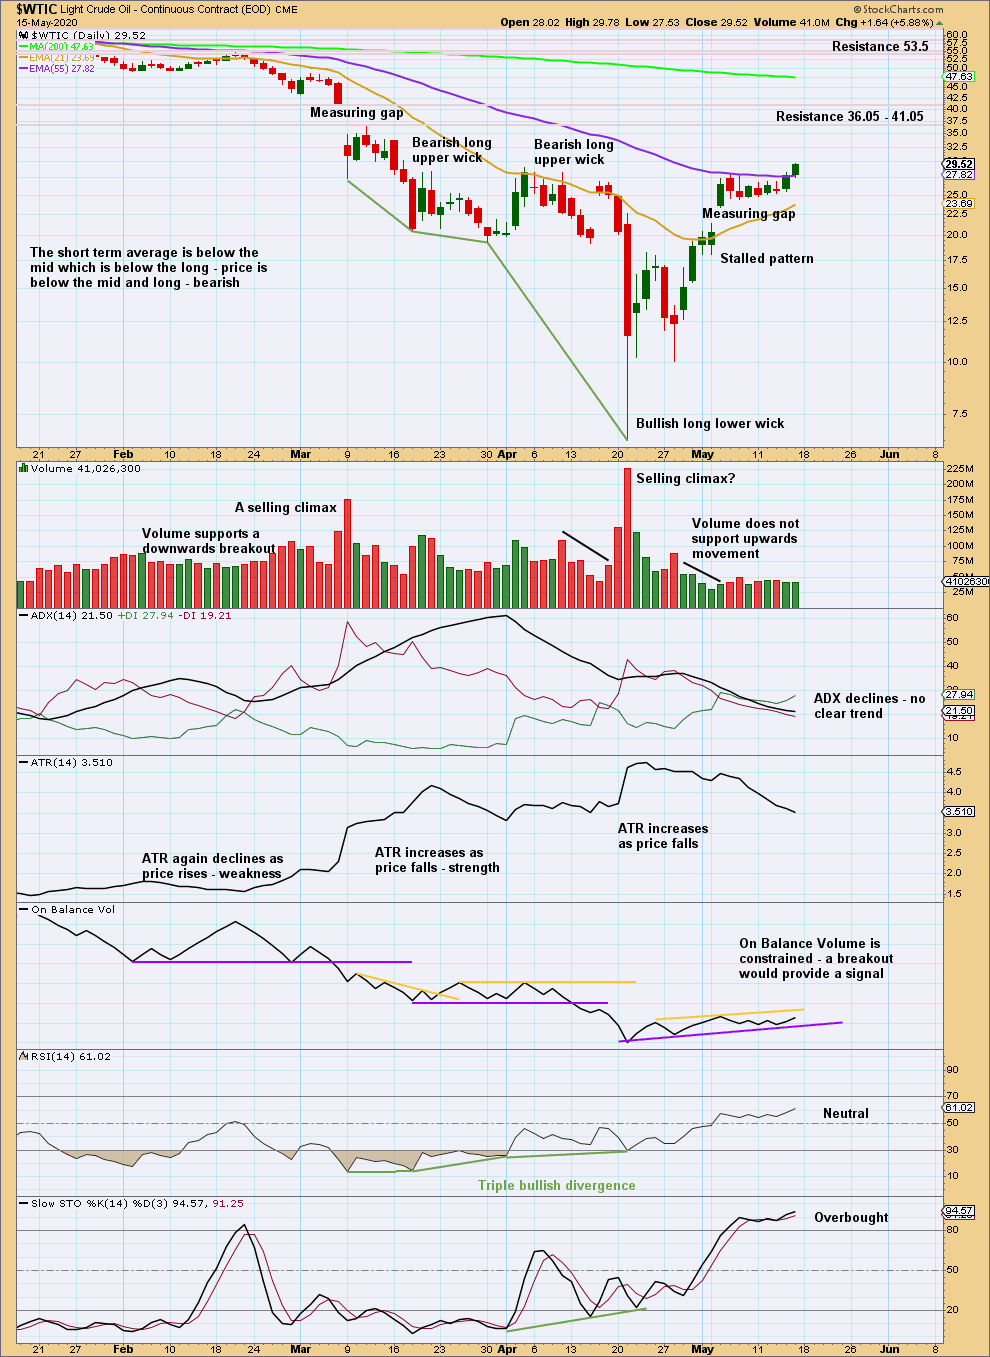
Click chart to enlarge. Chart courtesy of StockCharts.com.
Price has closed above a small sideways consolidation with a little support from volume effecting an upwards breakout.
Published @ 06:25 p.m. EST.
—
Careful risk management protects your trading account(s).
Follow my two Golden Rules:
1. Always trade with stops.
2. Risk only 1-5% of equity on any one trade.
—
New updates to this analysis are in bold.