
Lara’s Weekly: Elliott Wave and Technical Analysis of S&P500 and Gold and US Oil | Charts – June 5, 2020

S&P 500
The AD line has made a new all time high at the end of this week, so it is time to consider a more bullish Elliott wave count and time to update monthly charts.
Summary: The next target is at 3,238. Use the lower edge of the Elliott channel to indicate where support may be found on the way up.
The following points would provide confidence that this upwards wave is over:
1. A bearish candlestick reversal pattern.
2. A breach by downwards movement of the black upwards sloping Elliott channel on the main daily chart.
3. A new low below 3,021.72.
When this upwards wave is over, it would then be followed either by a deep multi-week pullback or the continuation of a bear market.
At the end of this week, new all time high from the AD line suggests new all time high from price may follow soon. However, inversion of the yield curve in May 2019 suggests an economic recession to begin by May 2021 at the latest. This data is contradictory but may be resolved by the third alternate monthly Elliott wave count.
The biggest picture, Grand Super Cycle analysis, is here.
ELLIOTT WAVE COUNTS
MAIN MONTHLY CHART
Click chart to enlarge.
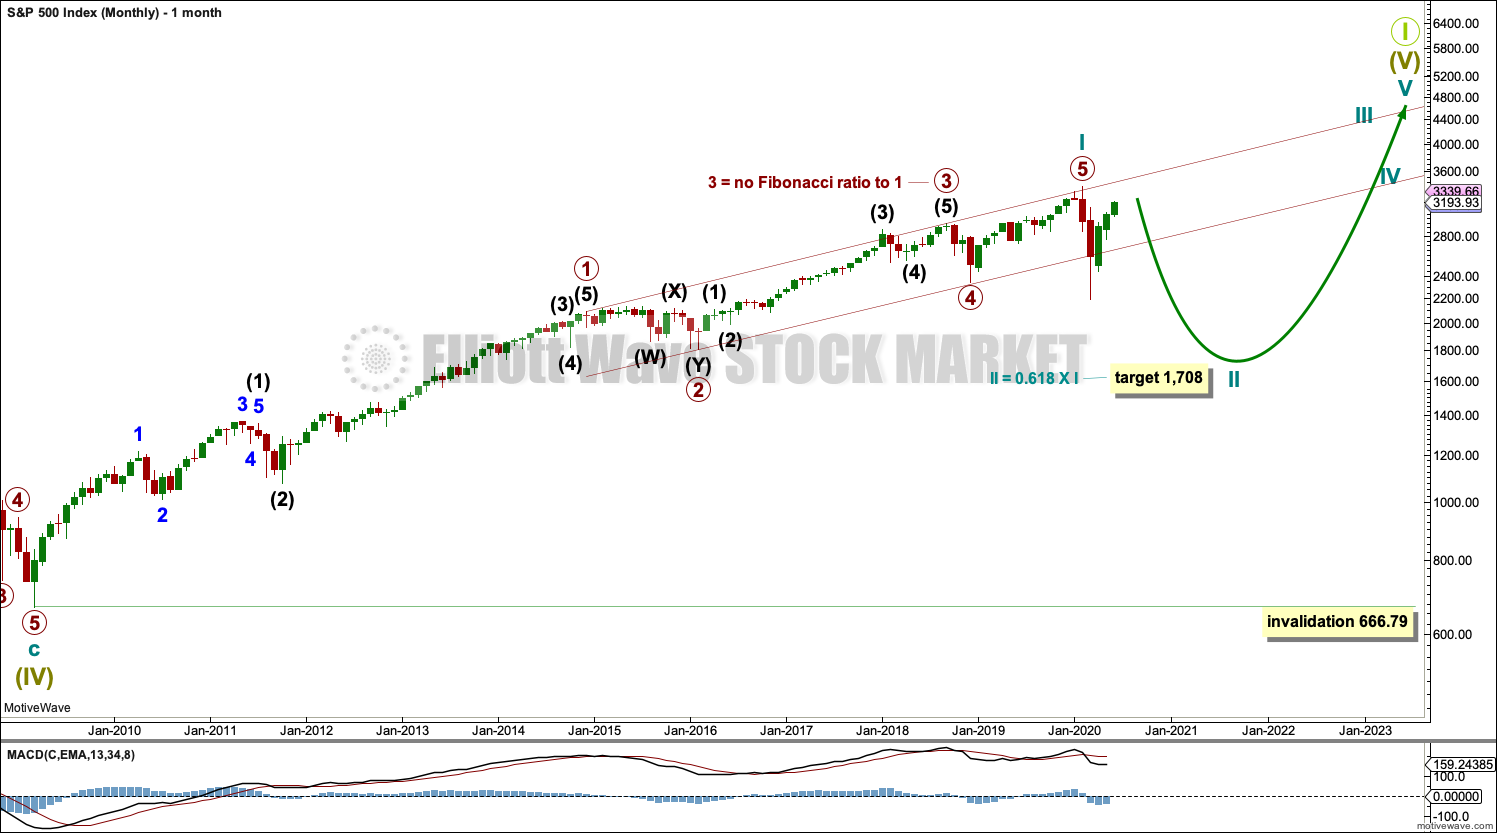
The 0.236 and now also 0.382 Fibonacci ratios of cycle wave I have both been passed. The next Fibonacci ratio in the sequence is used for the next target for cycle wave II to end.
The channel drawn about cycle wave I is drawn using Elliott’s first technique. This channel looks text book perfect. The channel is now strongly breached confirming an end to the bull market, which began in 2009, and confirming a new bear market to follow.
Cycle wave II may not move beyond the start of cycle wave I below 666.79.
Cycle wave II may last about one to two years in total. In the middle should be a B wave bounce or consolidation that may last some months and which may end now next week.
At this stage, I now have two weekly charts looking at two different Elliott wave structures for cycle wave II.
MAIN WEEKLY CHART
Click chart to enlarge.
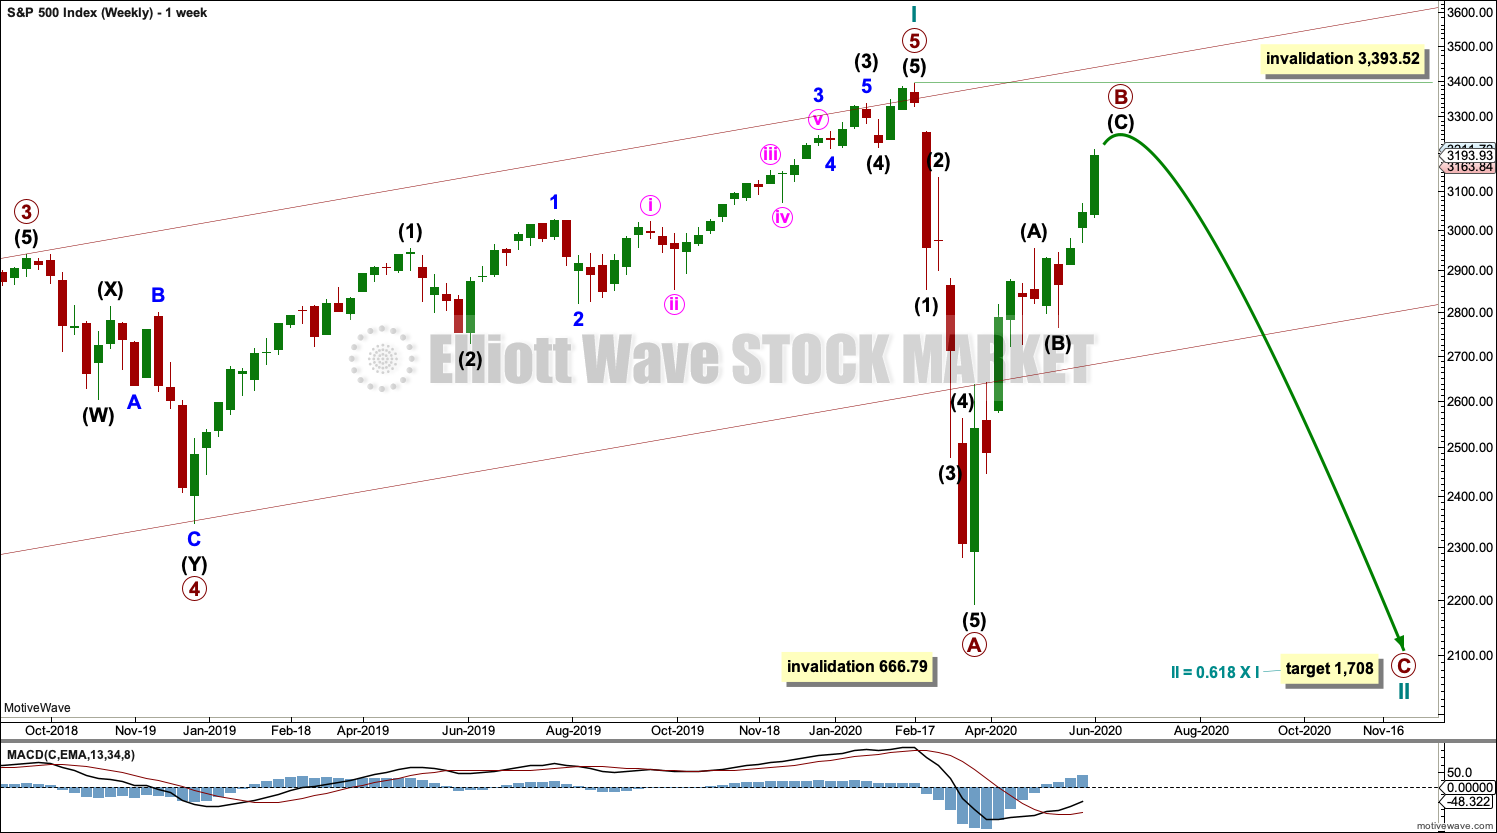
This main Elliott wave count expects that the bull market beginning in March 2009 was cycle wave I of Super Cycle wave (V). The trend change in February 2020 may have been only at cycle degree. Cycle wave II may last from one to a few years.
Cycle wave II would most likely subdivide as a zigzag; thus far that looks like what is unfolding. When primary waves A and B may both be complete, then the target may be calculated using a Fibonacci ratio between primary waves A and C. At that stage, the final target may change or widen to a zone.
Cycle wave II may not move beyond the start of cycle wave I below 666.79.
MAIN DAILY CHART
Click chart to enlarge.
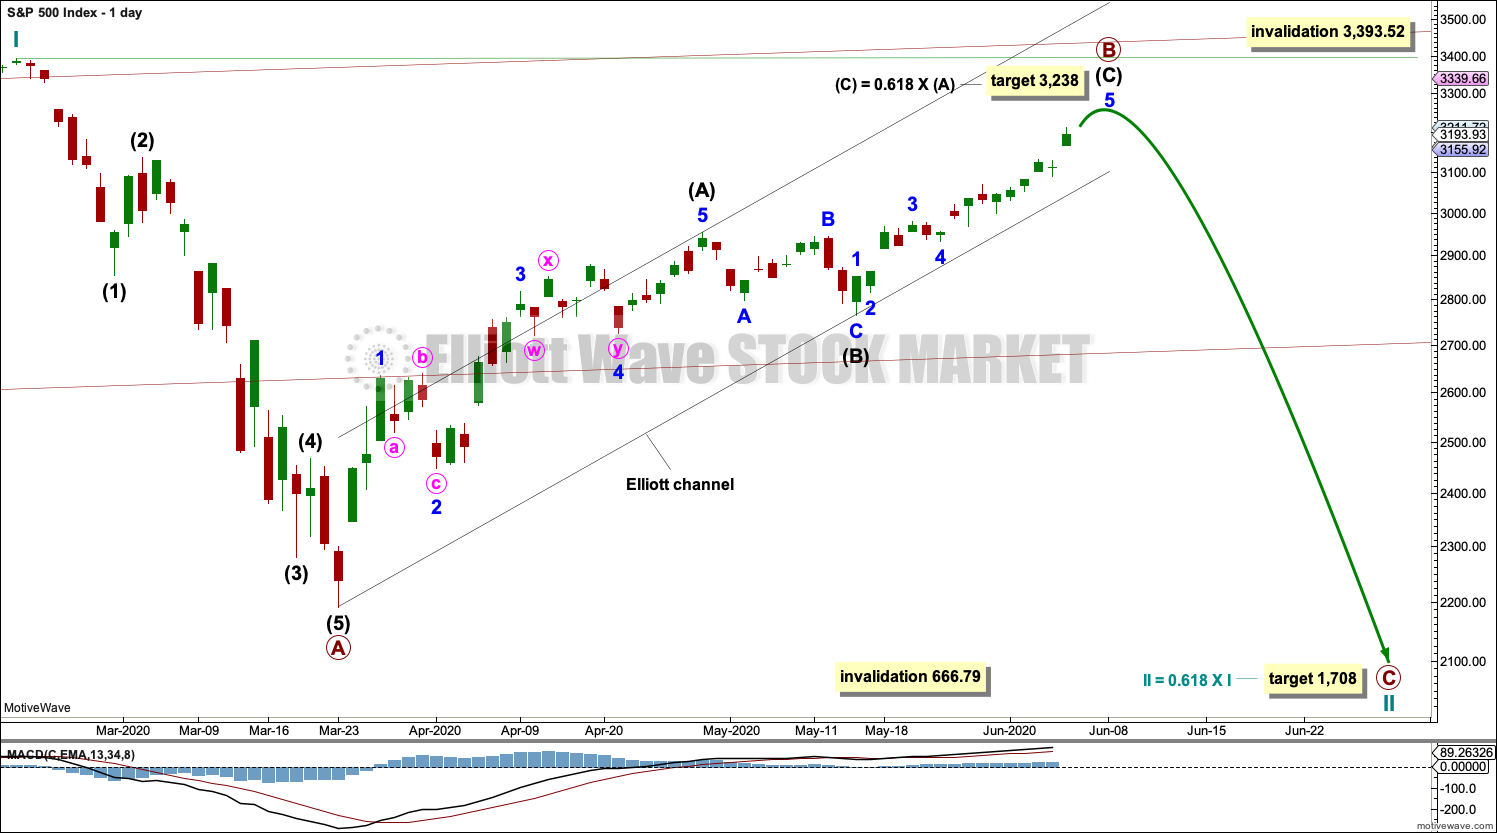
Draw the wide maroon trend channel carefully: draw the first trend line from the end of primary wave 1 at 2,093.55 (December 26, 2014), to the end of primary wave 3 at 2,940.91 (September 21, 2018), then place a parallel copy on the end of primary wave 2 at 1,810.10 (February 11, 2016). The channel is fully breached indicating a trend change from the multi-year bull trend to a new bear trend. Resistance at the lower edge has been overcome; price has closed above this trend line.
Cycle wave II may subdivide as any Elliott wave corrective structure except a triangle. It would most likely be a zigzag (zigzags subdivide 5-3-5). Primary wave A may be a complete five wave impulse downwards. Primary wave B may not move beyond the start of primary wave A above 3,393.52.
Draw a channel about primary wave B using Elliott’s technique for a correction. Draw the first trend line from the start of intermediate wave A to the end of intermediate wave B, then place a parallel copy on the end of intermediate wave A. Intermediate wave C may find resistance at the upper edge of the channel. While intermediate wave C unfolds higher, any smaller pullbacks within it may find support at the lower edge of this channel.
When this channel is breached by downwards movement, it would then indicate the bounce labelled primary wave B may be over and the next large downwards wave labelled primary wave C may then have begun. This is how the channel will be used this week.
ALTERNATE WEEKLY CHART
Click chart to enlarge.
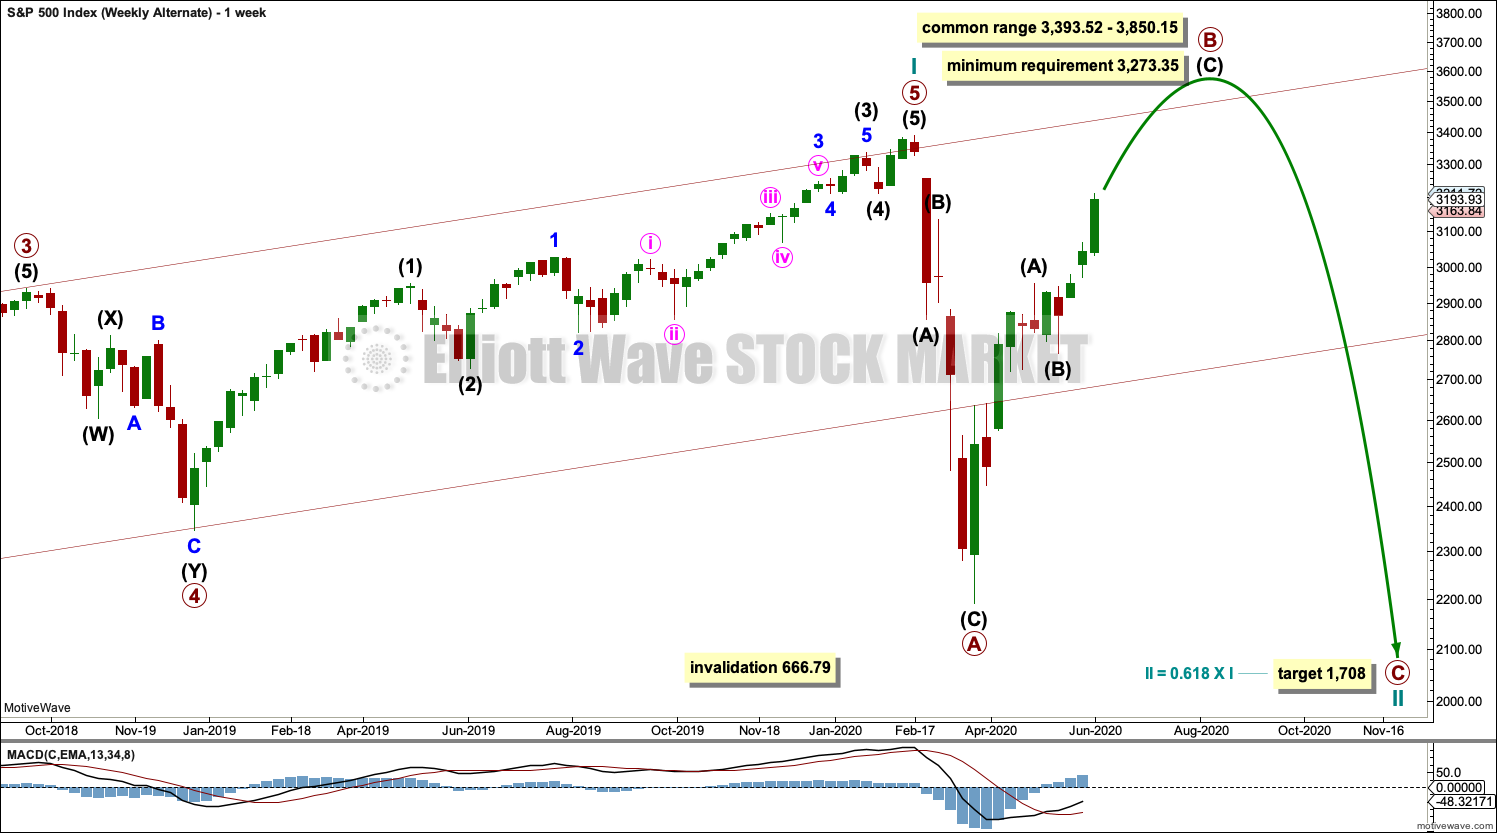
This alternate weekly chart considers a different possible Elliott wave structure for cycle wave II. Cycle wave II may subdivide as any corrective structure except a triangle. This wave count considers a flat correction may be unfolding for cycle wave II.
Flat corrections subdivide 3-3-5 and require primary wave B to retrace a minimum 0.9 length of primary wave A. That minimum has not yet been met.
The common range for primary wave B within a flat correction is from 1 to 1.38 times the length of primary wave A. Primary wave B may make a new high beyond the start of primary wave A as in an expanded flat. There is no Elliott wave rule which states a maximum length for primary wave B, so there is no rule to apply to determine an upper invalidation point for this wave count.
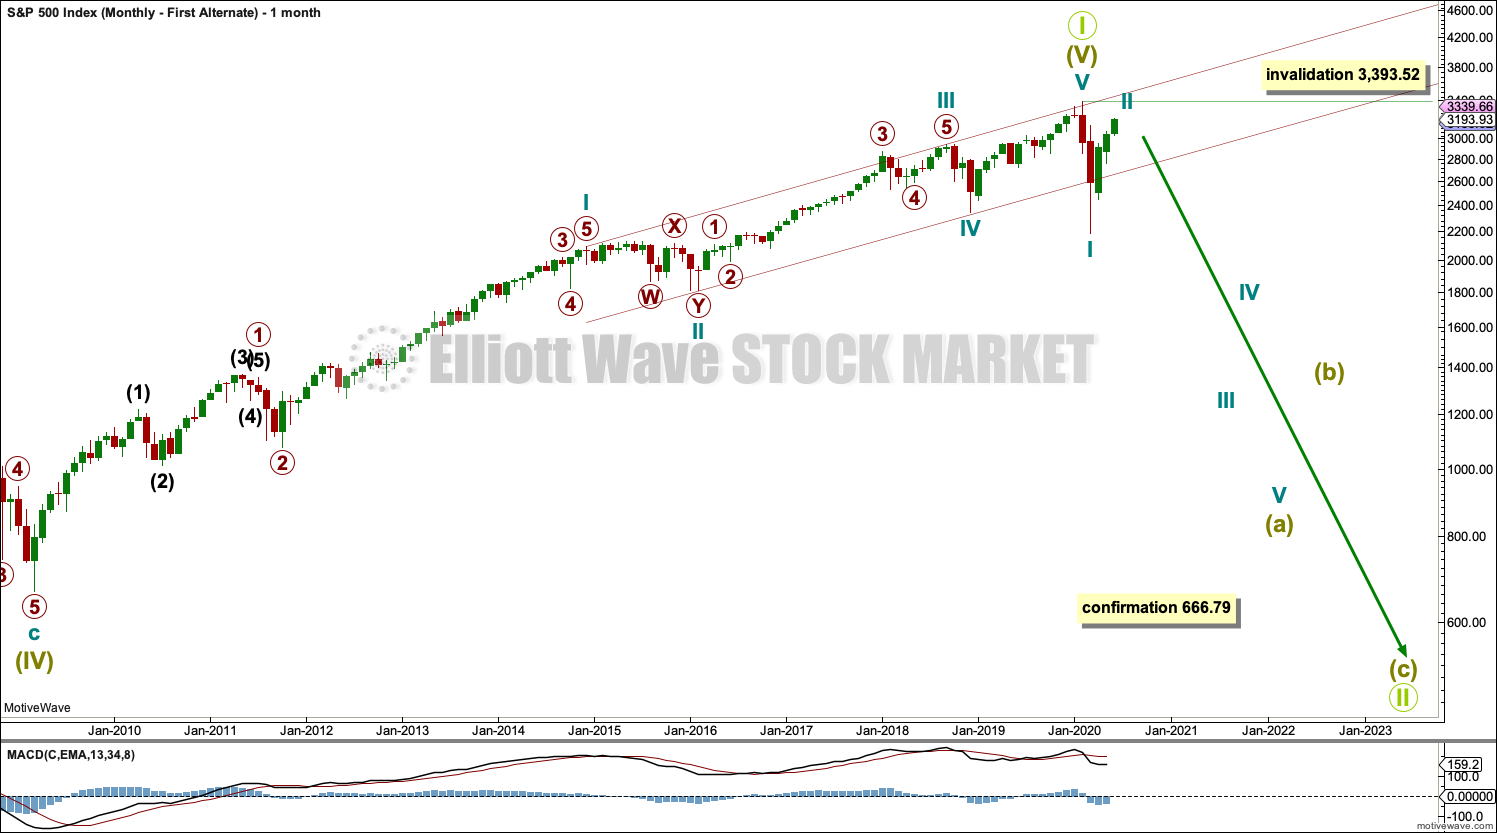
FIRST ALTERNATE MONTHLY CHART
Click chart to enlarge.
This wave count is the same as the first monthly chart, but the degree of labelling is moved down one degree. It is possible that the all time high was the end of a Grand Super Cycle first wave, and a huge market crash to historic lows may have just begun.
This wave count requires a five wave structure to unfold lower at the monthly chart level. That would be incomplete. No second wave correction within the first five wave structure downwards may move beyond the start of its first wave above 3,393.52.
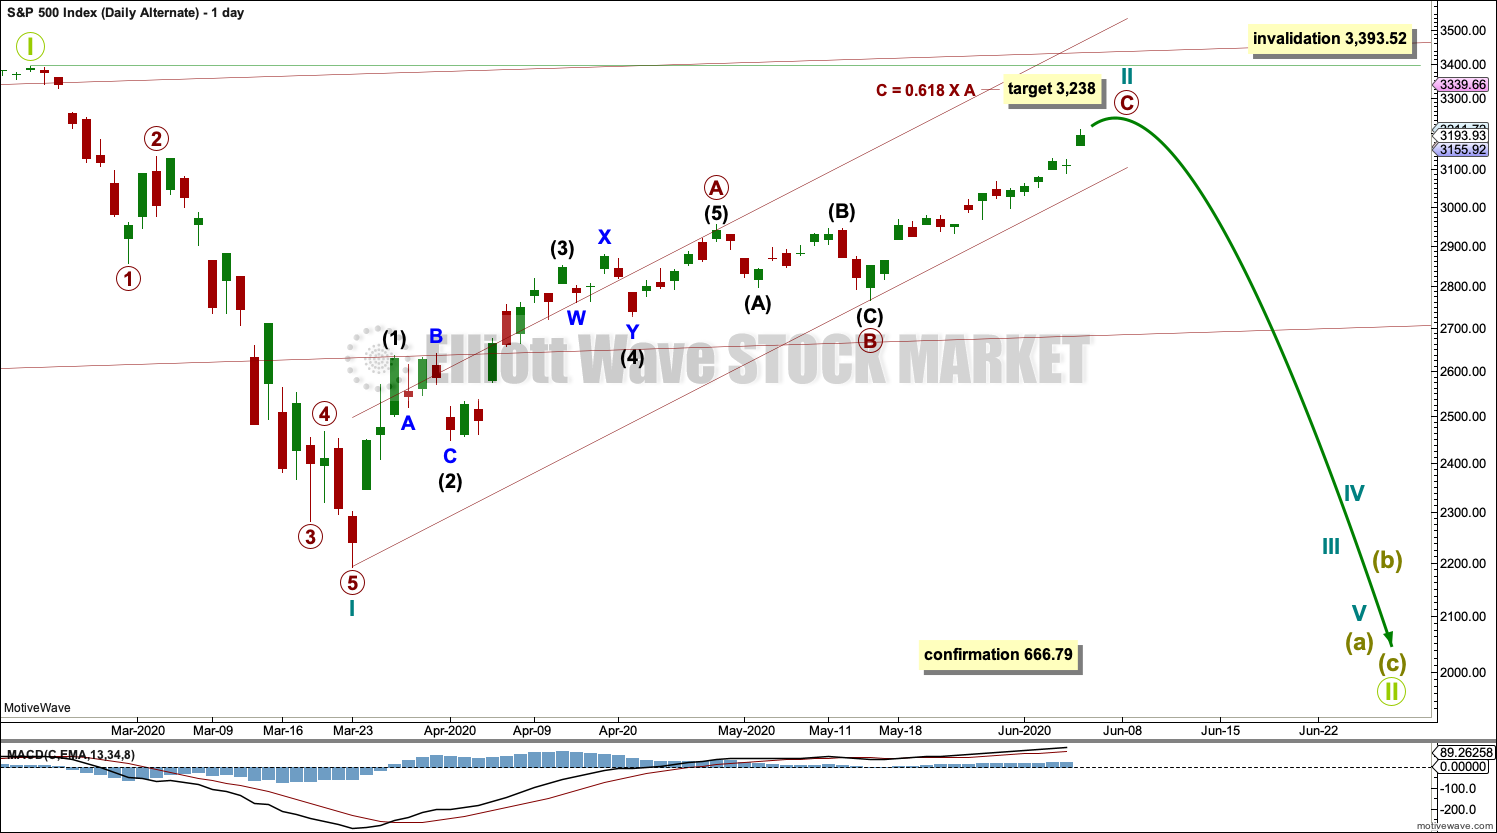
FIRST ALTERNATE DAILY CHART
Click chart to enlarge.
This alternate daily chart follows the First Alternate Monthly chart.
By simply moving the degree of labelling in the bull market beginning March 2009 up one degree, it is possible that a Grand Super Cycle trend change occurred on February 19, 2020. The bull market from March 2009 to February 2020 may have been a complete fifth wave labelled Super Cycle wave (V).
A bear market at Grand Super Cycle degree may be expected to last at least a decade, possibly longer. Corrections for this market tend to be much quicker than bullish moves, and so a fair amount of flexibility is required in expectations for duration of the different degrees.
Grand Super Cycle II would most likely subdivide as a zigzag, although it may be any corrective structure except a triangle. It should begin with a five down at the weekly chart time frame, which would be incomplete.
The first wave down on the daily chart is labelled cycle wave I. If this degree of labelling is wrong, it may be too high; it may need to be moved down one degree.
Following cycle wave I, cycle wave II may be continuing higher as a zigzag. Cycle wave II may not move beyond the start of cycle wave I above 3,393.52.
When cycle wave II may again be complete, then a target for cycle wave III may be calculated.
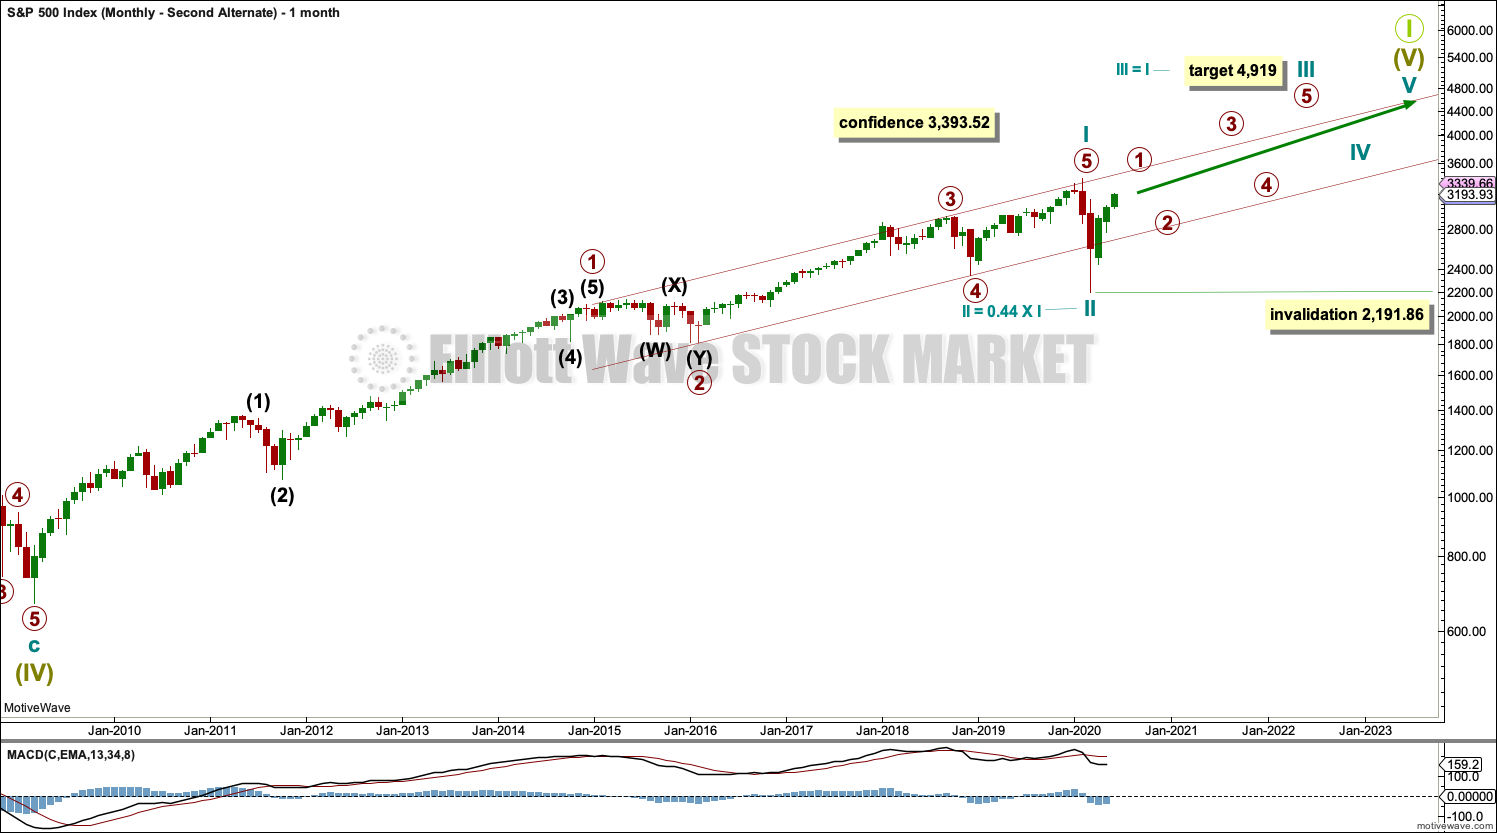
SECOND ALTERNATE MONTHLY CHART
Click chart to enlarge.
This alternate monthly chart labels the bull market from March 2009 to February 2020 in exactly the same way as the the main wave count. Thereafter, the difference is in the structure of cycle wave II.
It is possible that cycle wave II may be complete as a relatively brief and shallow zigzag. Cycle wave III may be beginning. Cycle wave III may only subdivide as an impulse.
Primary wave 1 within cycle wave III may be nearing completion. When primary wave 1 may be complete, then a multi-week pullback should begin for primary wave 2 that may not move beyond the start of primary wave 1 below 2,191.86.
This wave count is very bullish and is contradicted by inversion of the yield curve back in May 2019. Inversion of the yield curve suggests the beginning of a recession a few months to about two years afterwards. This wave count expects a bull market to continue for over two years.
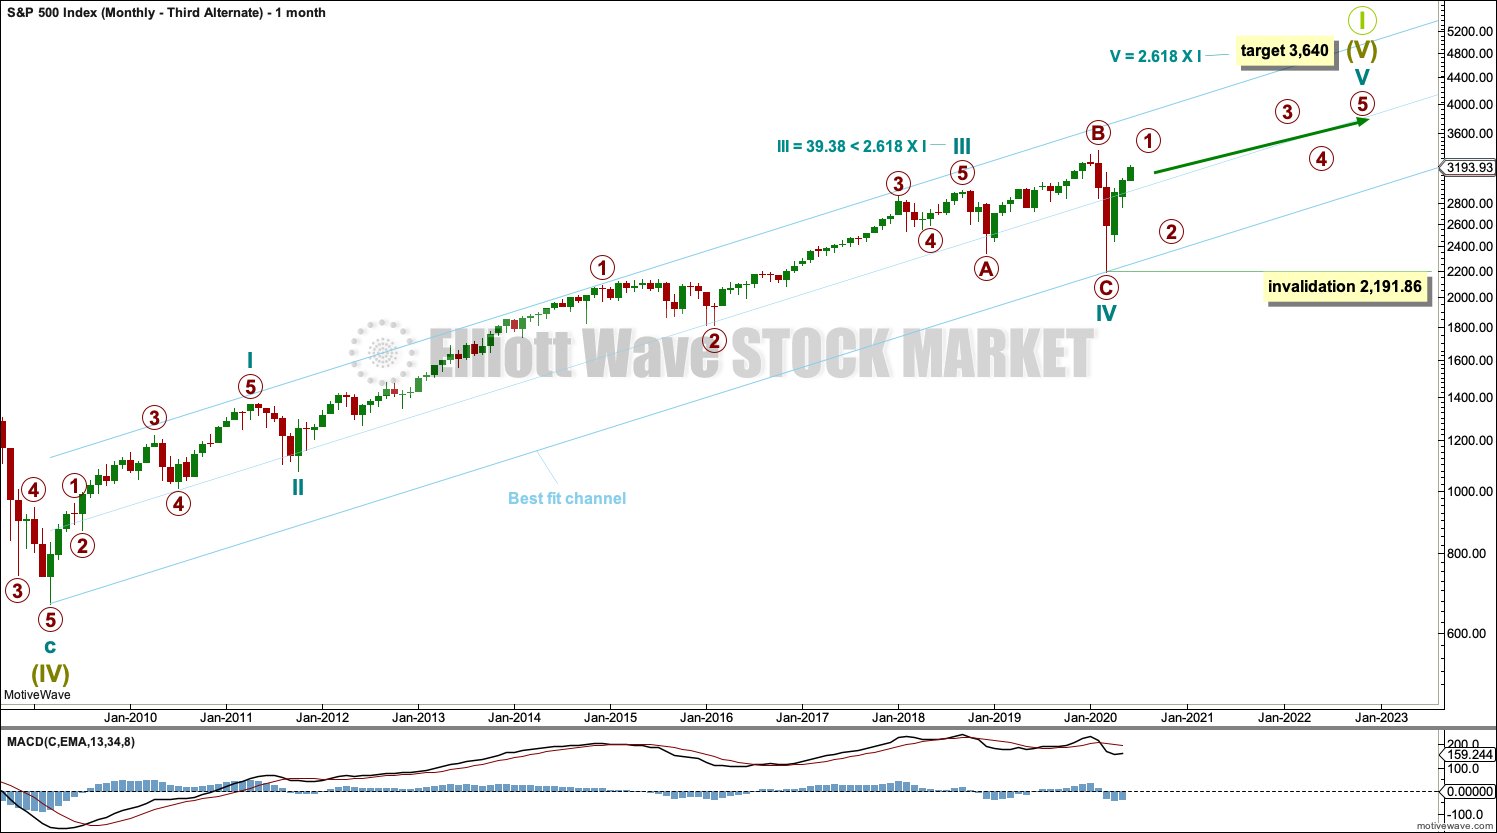
THIRD ALTERNATE MONTHLY CHART
Click chart to enlarge.
This alternate monthly chart is new. This alternate monthly chart labels the subdivisions of the long bull market differently. The channel is a best fit.
There is a reasonably close Fibonacci ratio between cycle waves I and III. It would be less likely that cycle wave V would exhibit a Fibonacci ratio to either of cycle waves I or III, as the S&P rarely exhibits Fibonacci ratios between all of its actionary waves. The target for cycle wave V would best be calculated at primary degree. That can only be done when all of primary waves 1, 2, 3 and 4 are complete. That cannot be done yet.
There is alternation between a zigzag of cycle wave II and a flat correction of cycle wave IV.
Cycle wave V must subdivide as a five wave motive structure, most likely an impulse. Primary wave 1 within cycle wave V may be nearing completion. Primary wave 2 should then unfold as a multi-week pullback and may not move beyond the start of primary wave 1 below 2,191.86.
This alternate wave count is bullish, but less so than the second alternate. This alternate wave count may still fit the prediction from the inversion of the yield curve, and it may allow for time for the AD line to diverge from price as price makes final highs before the end of the bull market.
Cycle wave V may last from one to several years. If inversion of the yield curve is followed by a recession two years afterwards, and if the stock market is a leading indicator of a recession (as it normally is), then cycle wave V may end a little before May 2021.
TECHNICAL ANALYSIS
MONTHLY CHART
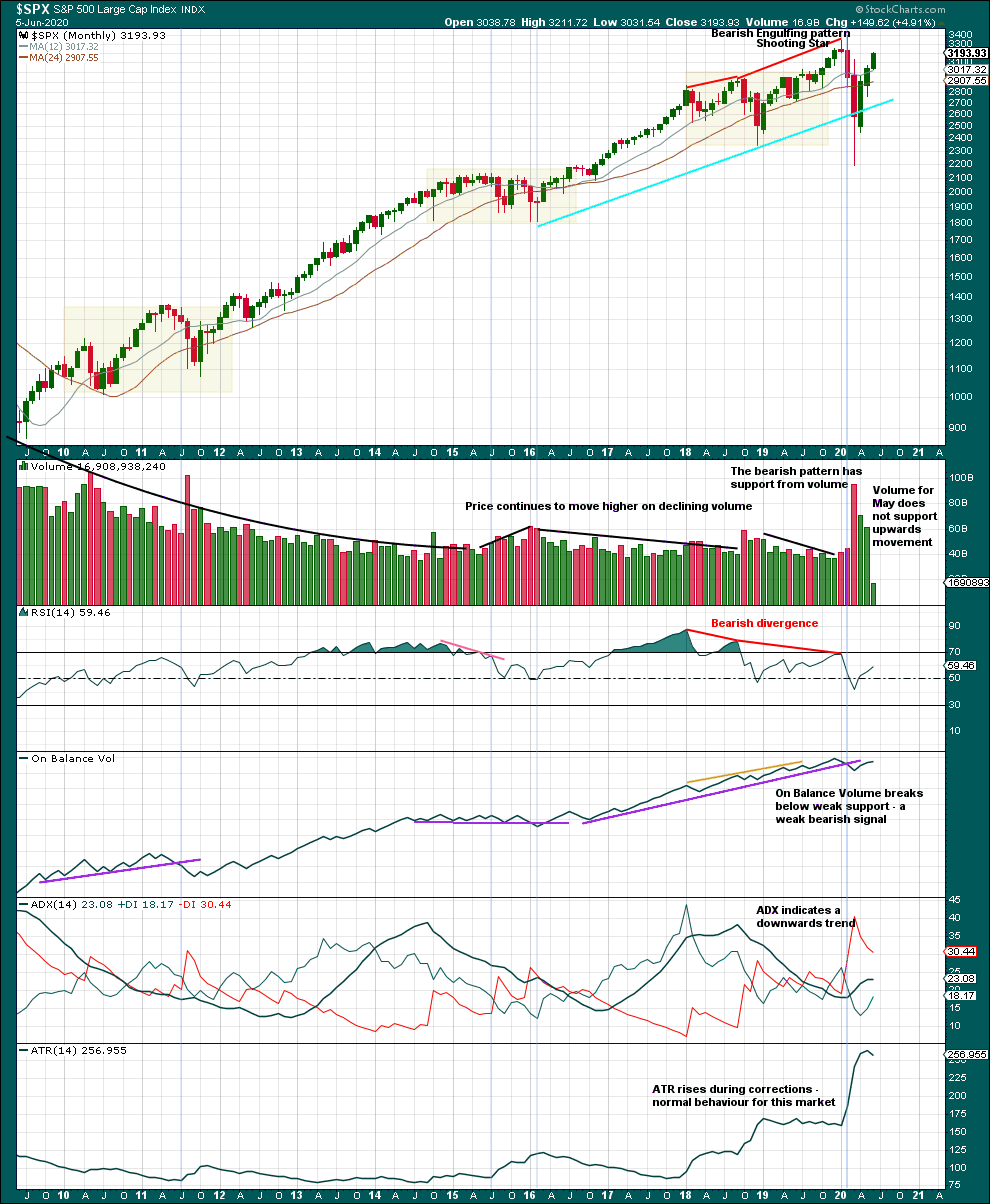
Click chart to enlarge. Chart courtesy of StockCharts.com.
Double bearish divergence between price and RSI along with two bearish candlestick reversal patterns has been followed by downwards movement, which meets the technical definition of a bear market in that more than 20% of market value was lost.
So far a V bottom has formed. There is nothing in this chart which identifies with confidence whether or not the V bottom is sustainable. It is possible that a new bull market may develop. It is also possible that the bear market may continue and the bounce may be a Dead Cat Bounce. Weak volume does suggest the bounce may not be sustainable, but there is evidence in this chart that price can rise for some years on light and declining volume.
WEEKLY CHART
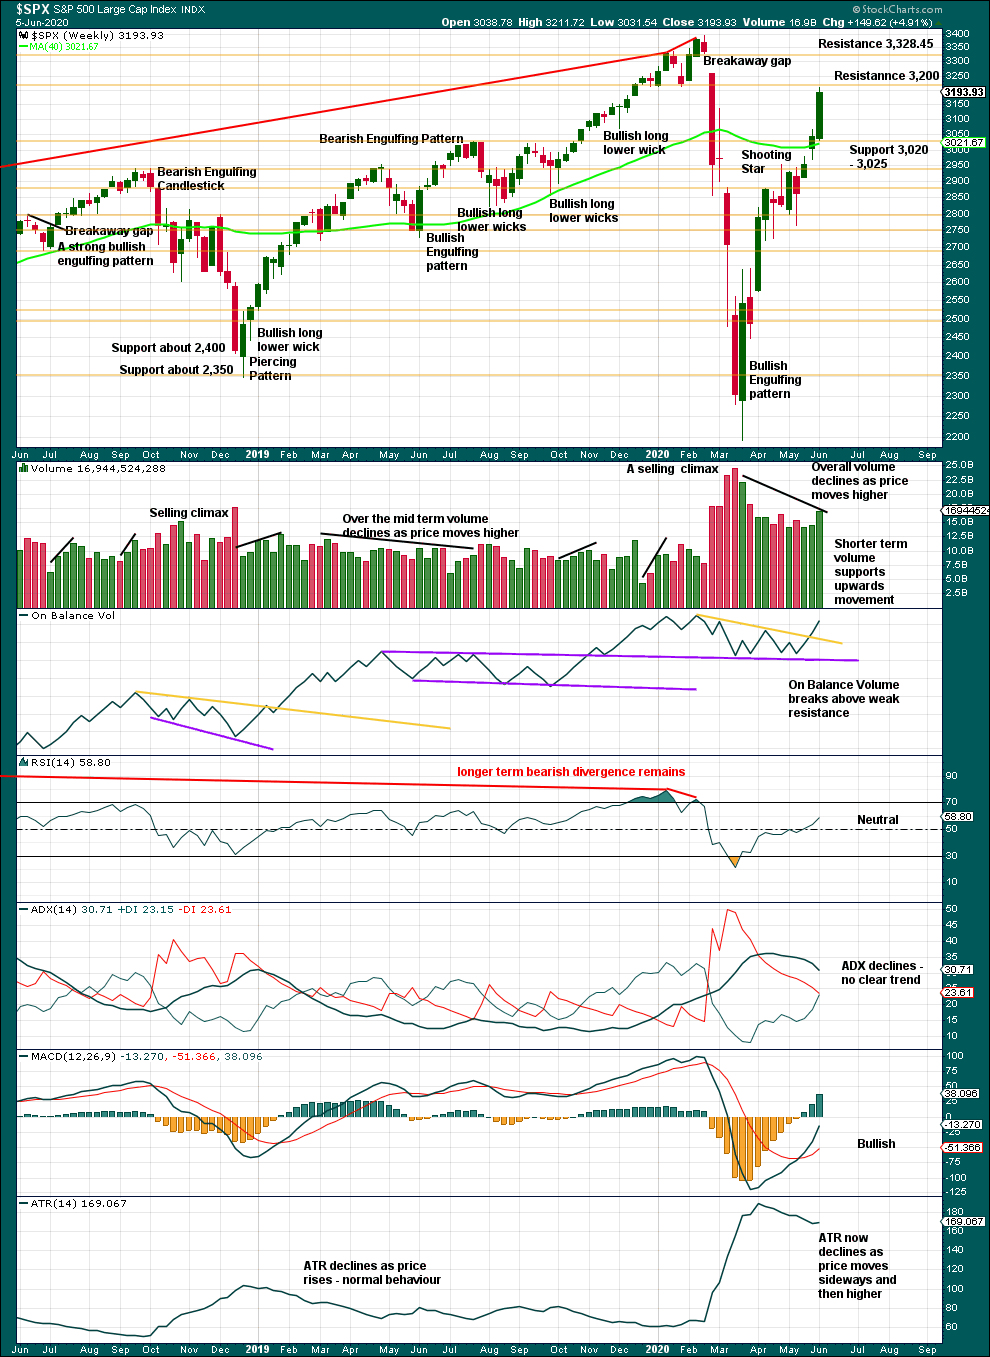
Click chart to enlarge. Chart courtesy of StockCharts.com.
The breakaway gap has its upper edge at 3,328.45. This may offer strong and final resistance. If this gap is closed, then it would suggest that the downwards wave which followed it is complete. That would suggest a more bullish Elliott wave count should be considered as more likely.
This week a strong upwards week has some support from volume. More upwards movement next week looks most likely.
DAILY CHART
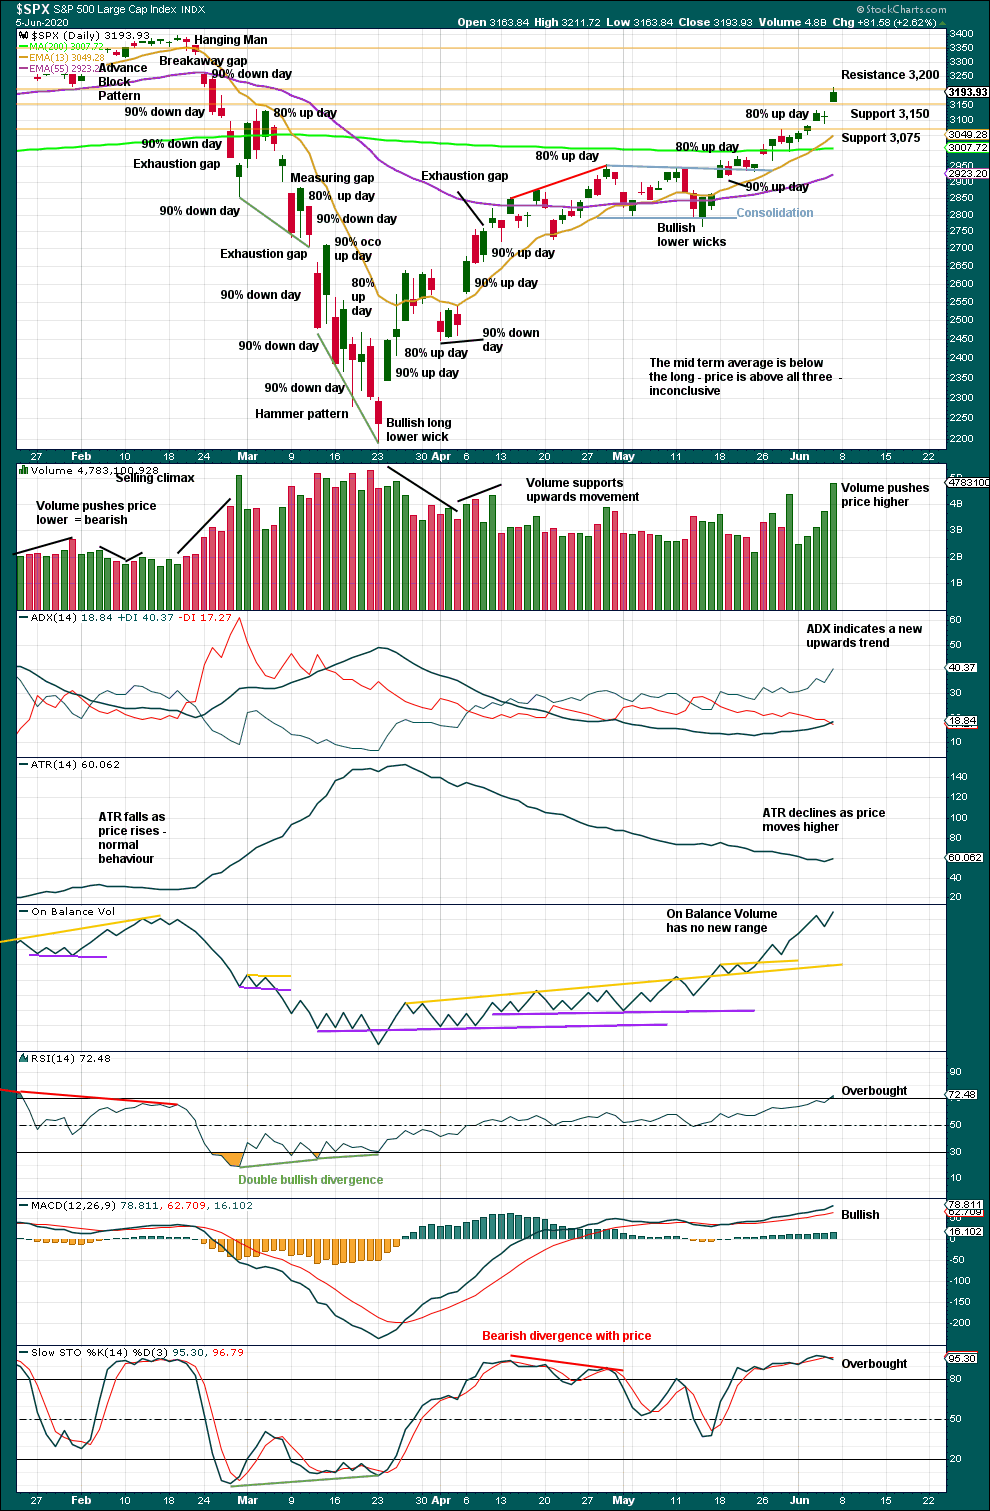
Click chart to enlarge. Chart courtesy of StockCharts.com.
The breakaway gap of 24th February has its upper edge at 3,328.45. A bearish analysis remains reasonable while this gap remains open. If this gap is closed, then a more bullish analysis that would expect new all time highs would increase in probability.
With volume now more strongly supporting upwards movement, more upwards movement next week looks likely. The gap for Friday may be a measuring gap, but the target would already be met. If this gap remains open, then it would remain a measuring gap; but if it is closed with a new low below 3,128.91, then it would be an exhaustion gap and a trend change would be possible.
BREADTH – AD LINE
WEEKLY CHART
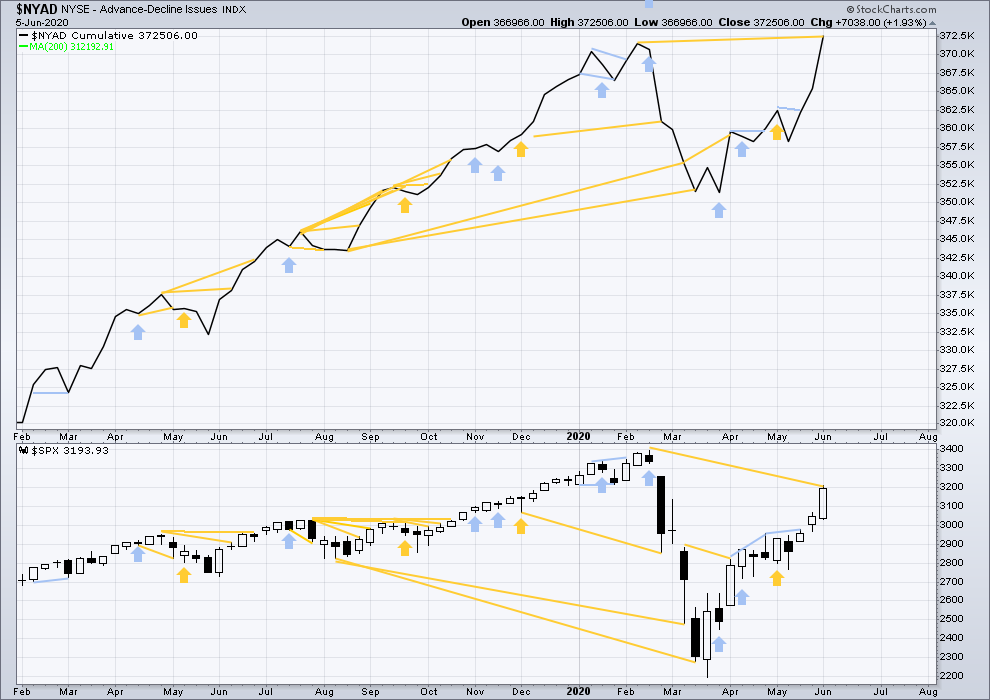
Click chart to enlarge. Chart courtesy of StockCharts.com. So that colour blind members are included, bearish signals will be noted with blue and bullish signals with yellow.
Breadth should be read as a leading indicator.
This week the AD line makes a new all time high. This divergence is bullish and is usually followed by an all time high in price shortly after. This supports the second or third alternate monthly charts.
Large caps all time high: 3,393.52 on 19th February 2020.
Mid caps all time high: 2,109.43 on 20th February 2020.
Small caps all time high: 1,100.58 on 27th August 2018.
DAILY CHART
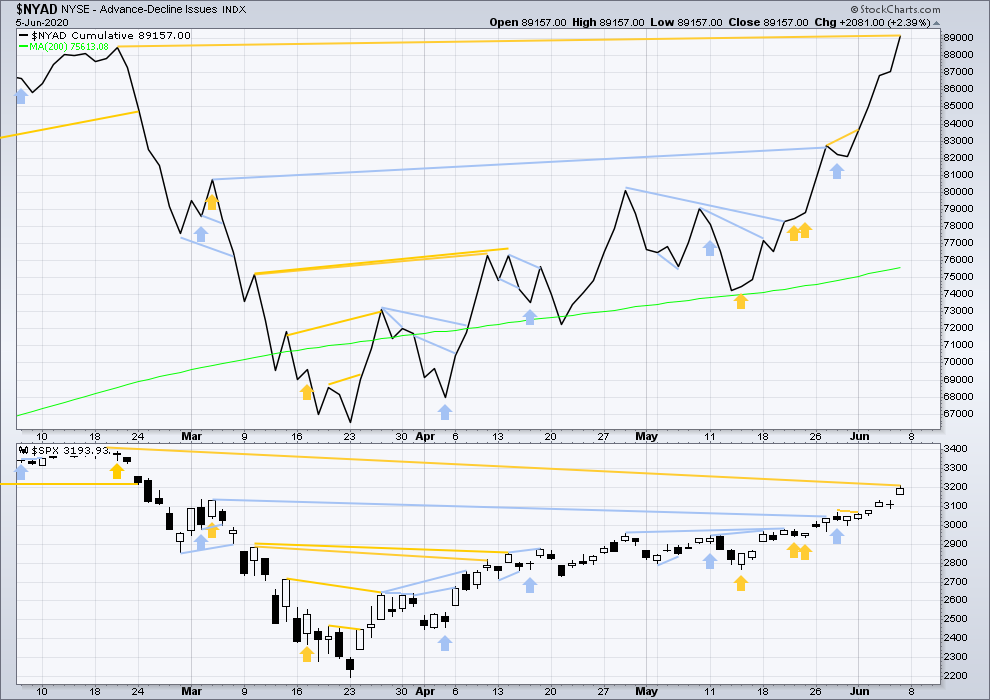
Click chart to enlarge. Chart courtesy of StockCharts.com. So that colour blind members are included, bearish signals will be noted with blue and bullish signals with yellow.
The AD line has made a new all time high at the daily chart level also. This divergence is bullish and is normally followed by an all time high from price shortly after. This supports either the second or third monthly alternate Elliott wave counts.
VOLATILITY – INVERTED VIX CHART
WEEKLY CHART
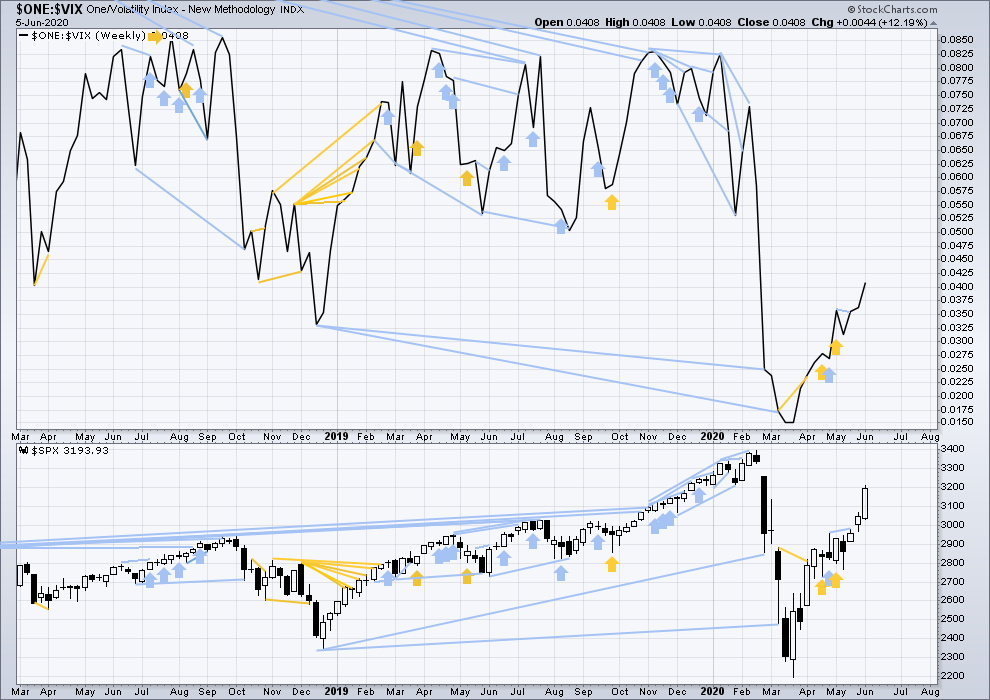
Click chart to enlarge. Chart courtesy of StockCharts.com. So that colour blind members are included, bearish signals will be noted with blue and bullish signals with yellow.
This week both price and inverted VIX have moved higher. There is no new divergence.
DAILY CHART

Click chart to enlarge. Chart courtesy of StockCharts.com. So that colour blind members are included, bearish signals will be noted with blue and bullish signals with yellow.
Today both price and inverted VIX have moved higher. There is no new divergence.
INTEREST RATE YIELD
Click chart to enlarge.
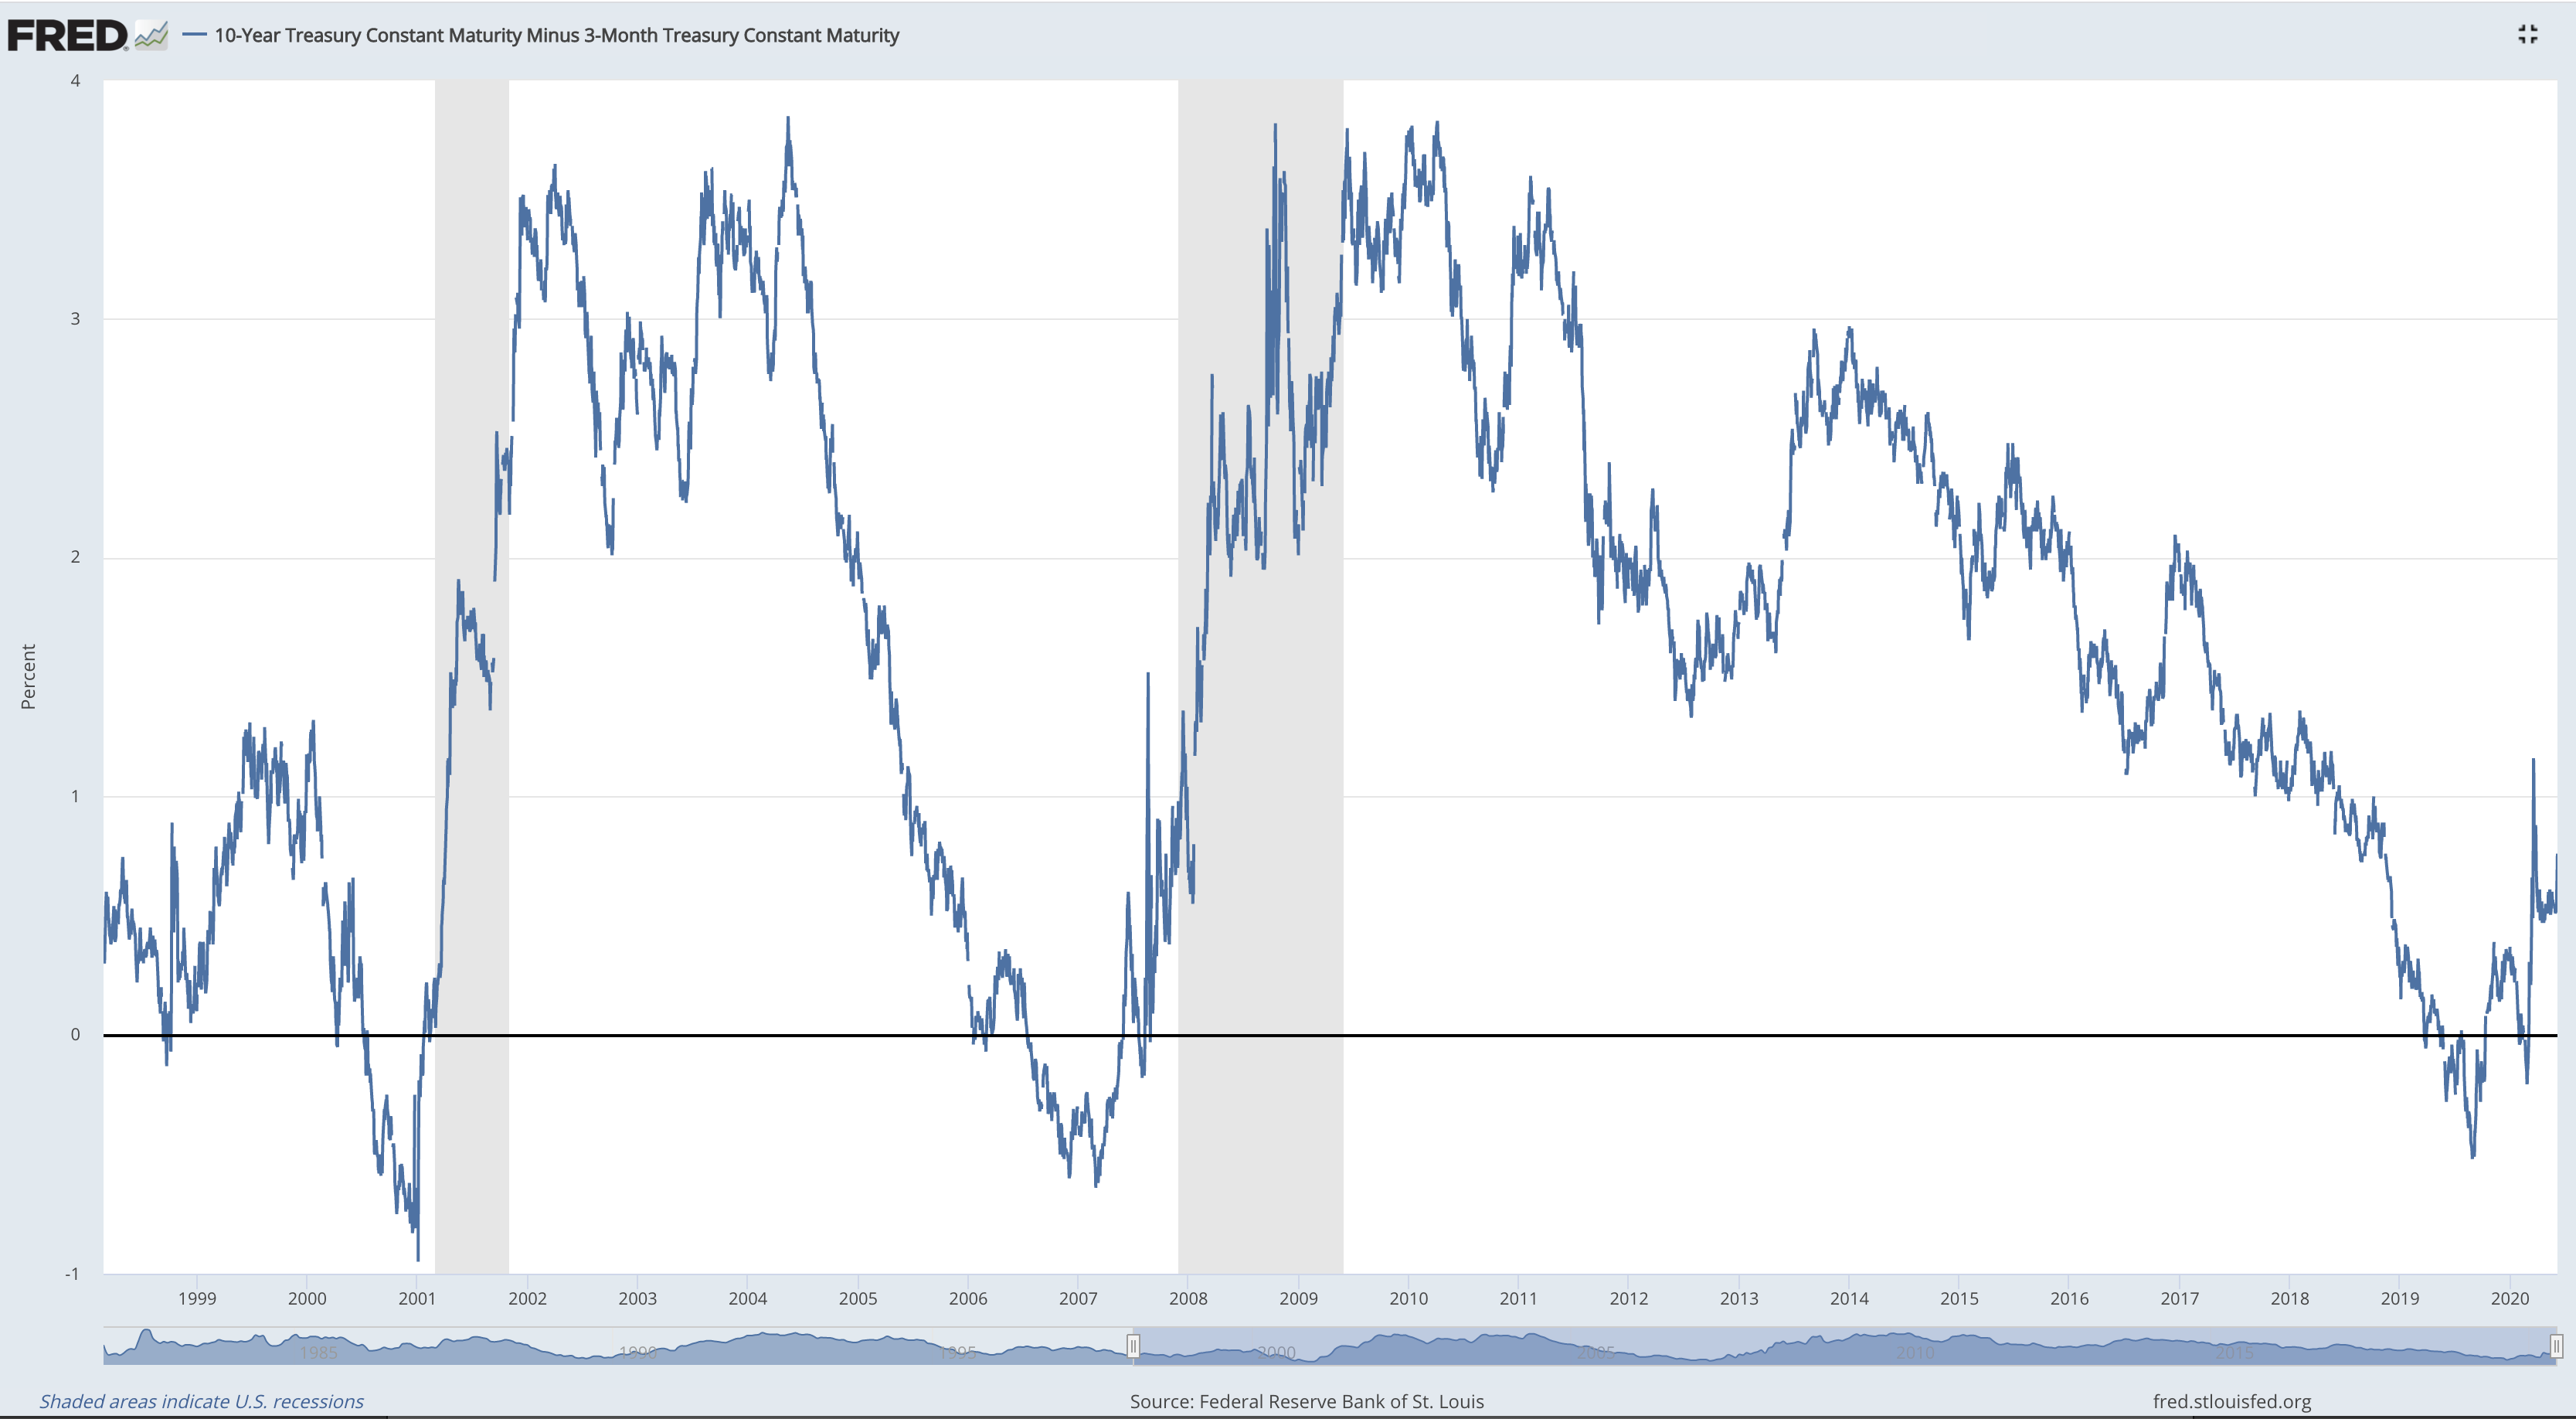
Chart from FRED.
The long-term rate dropped below the short-term rate in May 2019. This is one of the most reliable leading indicators of an economic recession. A recession usually follows several months to two years after this inversion. The stock market is also normally a leading indicator, so it normally turns downwards and begins to fall a few months prior to a recession beginning. Grey shaded areas on the chart are periods of economic recession.
DOW THEORY
Dow Theory has confirmed a bear market with the following lows made on a closing basis:
DJIA: 21,712.53 – a close below this point has been made on the March 12, 2020.
DJT: 8,636.79 – a close below this point has been made on March 9, 2020.
Adding in the S&P and Nasdaq for an extended Dow Theory, a bear market has now been confirmed:
S&P500: 2,346.58 – a close below this point has now been made on March 20, 2020.
Nasdaq: 7,292.22 – a close below this point was made on the March 12, 2020.
At this time, to shift Dow Theory from viewing a bear market to confirmation of a new bull market would require new highs made on a closing basis:
DJIA – 29,568.57
DJT – 11,623.58
Adding in the S&P and Nasdaq for an extended Dow Theory:
S&P500 – 3,393.52
Nasdaq – 9,838.37 (while this point was exceeded intraday on 5th June 2020, price has not closed above it, yet).
GOLD
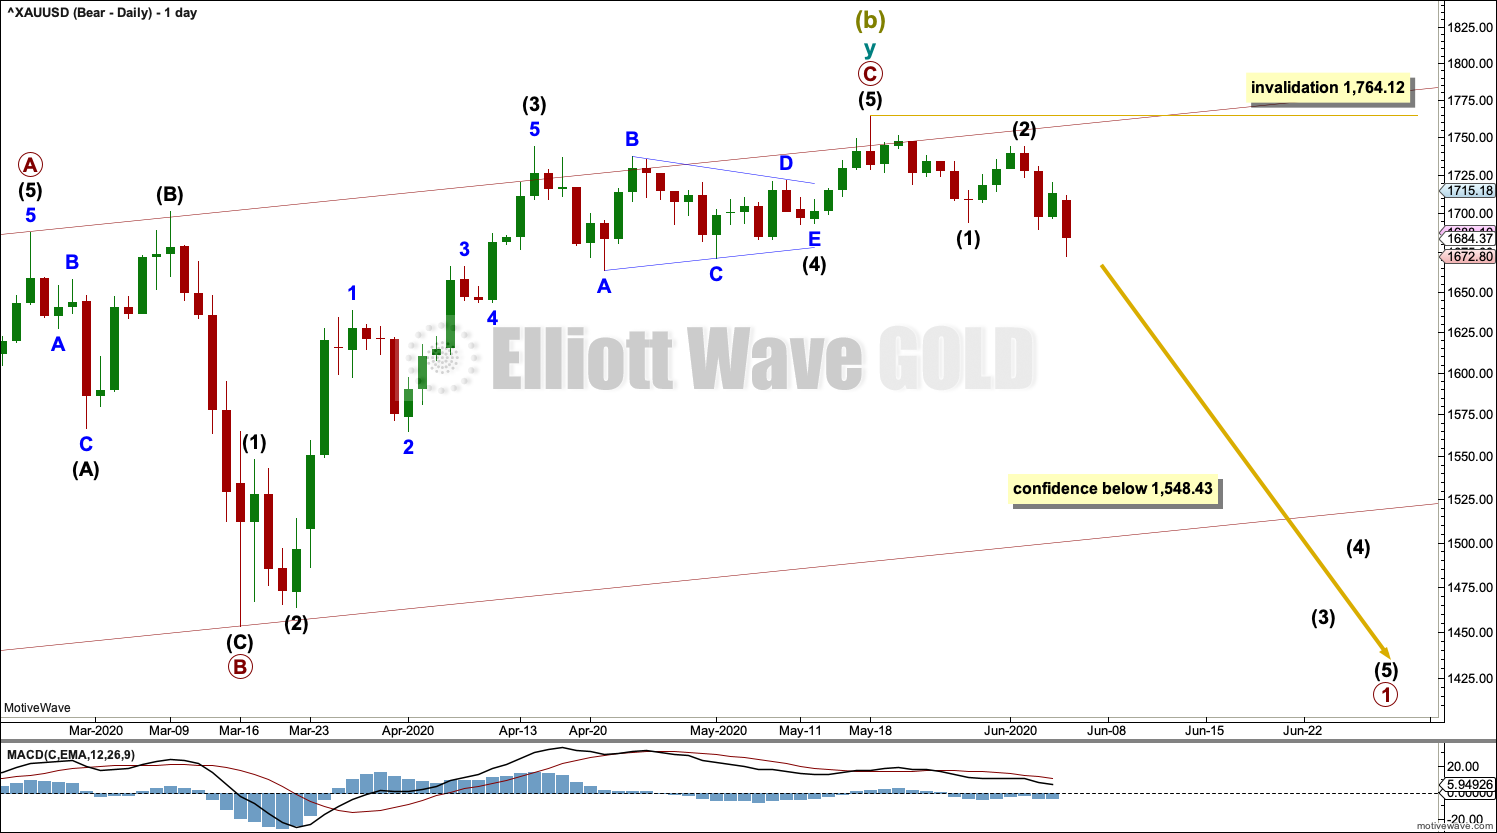
Another downwards day was expected from the main Elliott wave count. The target remains the same.
Summary: Expect continuing downwards movement to at least 1,362.
Further confidence in a downwards trend may be had if price makes a new low below 1,548.43.
A new high above 1,764.12 would indicate an upwards breakout. The target would then again be at 1,980.
Grand SuperCycle analysis is here.
Monthly charts were last updated here.
MAIN BEARISH ELLIOTT WAVE COUNT
WEEKLY CHART
Click chart to enlarge.
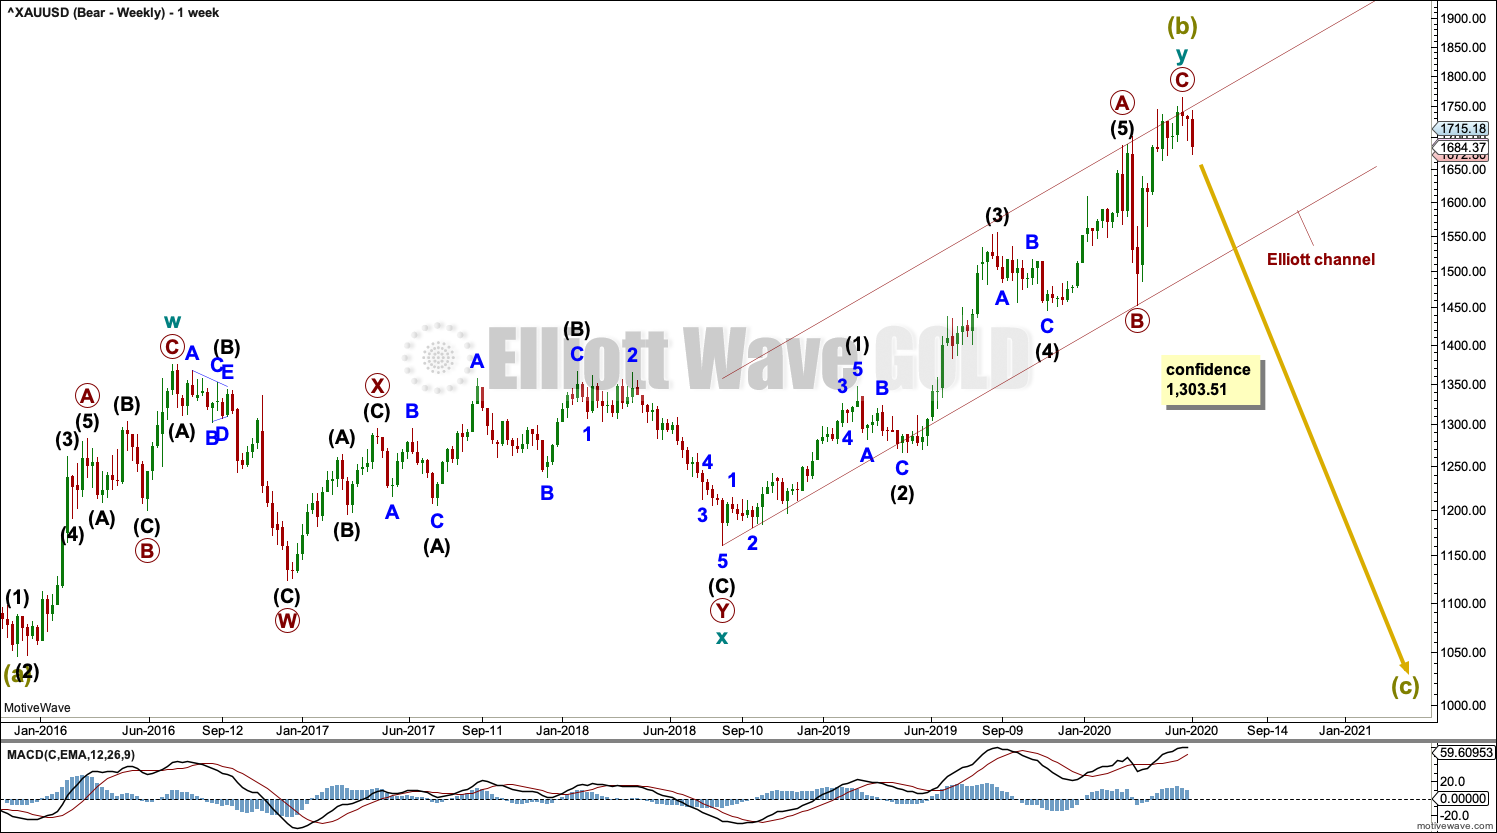
The bigger picture for this main bearish Elliott wave count sees Gold as still within a bear market, in a three steps back pattern that is labelled Grand Super Cycle wave IV on monthly charts.
Super Cycle wave (b) within Grand Super Cycle wave IV may be a complete double zigzag.
The first zigzag in the double is labelled cycle wave w. The double is joined by a three in the opposite direction, a combination labelled cycle wave x. The second zigzag in the double is labelled cycle wave y.
The purpose of the second zigzag in a double is to deepen the correction. Cycle wave y has achieved this purpose.
Super Cycle wave (c) downwards may continue to complete the larger (a)-(b)-(c) correction for Grand Super Cycle wave IV. Super Cycle wave (c) would be very likely to move below the end of Super Cycle wave (a) at 1,046.27 to avoid a truncation. When the bullish alternate wave count is invalidated, then a final target may be calculated for Super Cycle wave (c).
DAILY CHART
Click chart to enlarge.
Primary wave C within cycle wave y may be a complete five wave impulse.
A new low below 1,693.39 has added initial confidence to this wave count. A new low below 1,548.43 would invalidate a new more bullish alternate wave count (see below), so it would add further confidence to this main wave count.
When primary wave 1 is complete within the new downwards trend, then primary wave 2 may not move beyond the start of primary wave 1 above 1,764.12.
ALTERNATE DAILY CHART
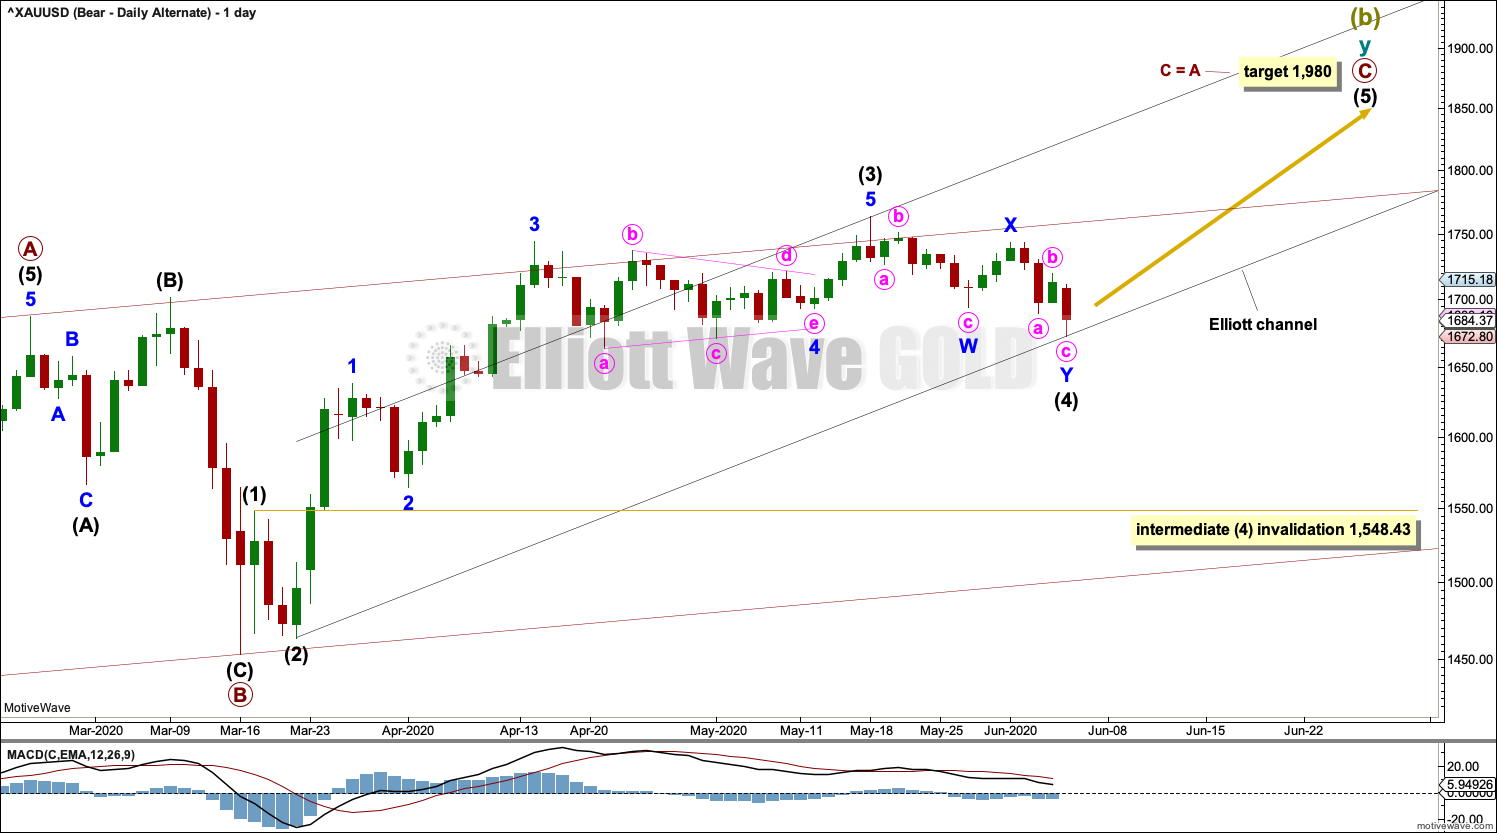
Click chart to enlarge.
It remains possible that primary wave C may be an incomplete five wave impulse.
Within the impulse: intermediate waves (1) through to (3) may be complete and intermediate wave (4) may be have continued lower as a double zigzag. Intermediate wave (4) may not move into intermediate wave (1) price territory below 1,548.43.
An Elliott channel is drawn about primary wave C. Primary wave C does not fit well within this channel, which slightly reduces the probability of this wave count.
ALTERNATE BULLISH ELLIOTT WAVE COUNT
WEEKLY CHART
Click chart to enlarge.
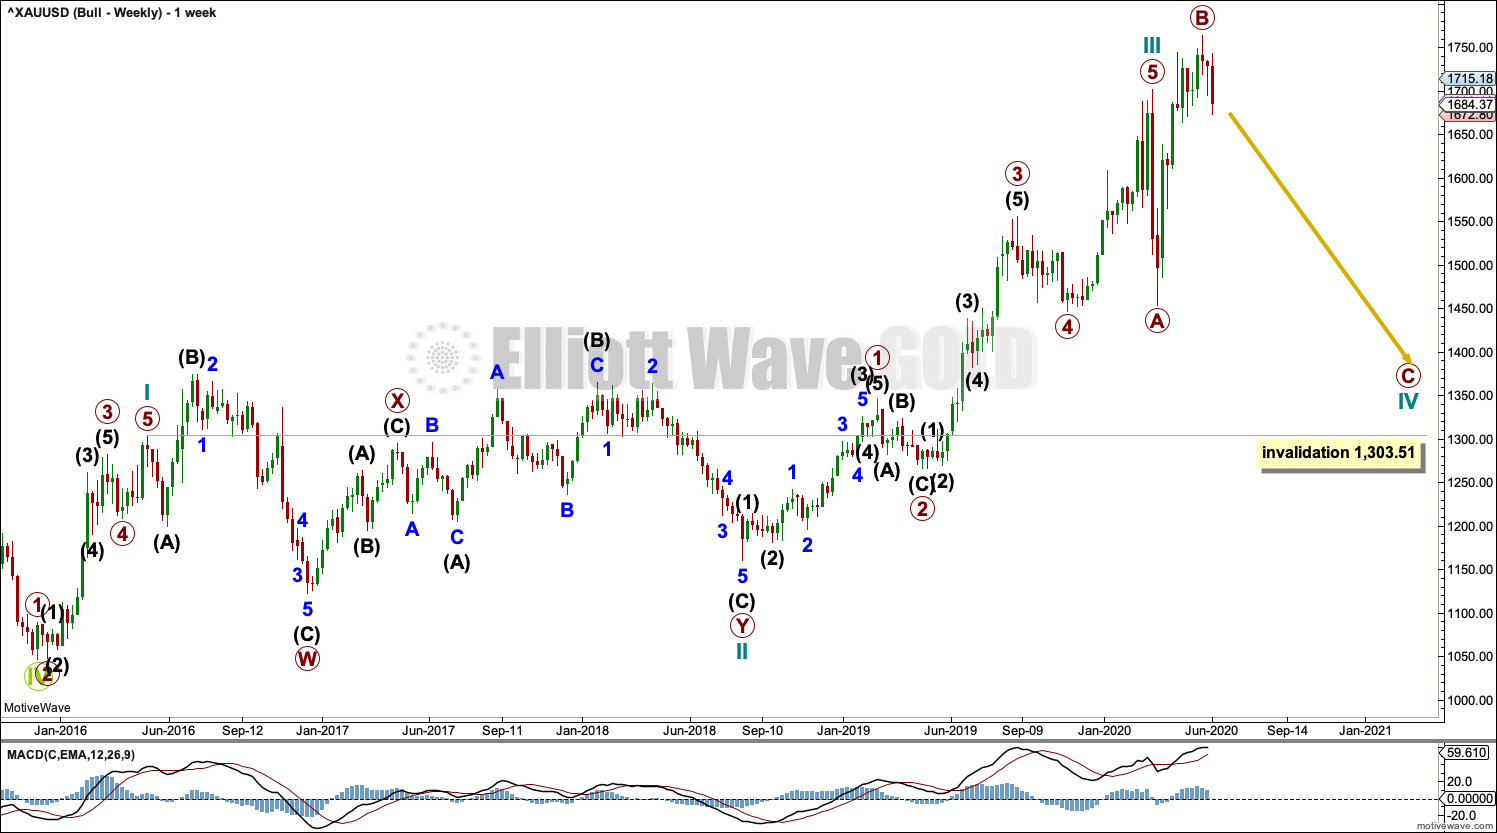
This wave count sees the the bear market complete at the last major low for Gold on 3 December 2015.
If Gold is in a new bull market, then it should begin with a five wave structure upwards on the weekly chart.
Cycle wave I fits as a five wave impulse with reasonably proportionate corrections for primary waves 2 and 4.
Cycle wave II fits as a double flat. However, within the first flat correction labelled primary wave W, this wave count needs to ignore what looks like an obvious triangle from July to September 2016 (this can be seen labelled as a triangle on the bear wave count above). This movement must be labelled as a series of overlapping first and second waves. Ignoring this triangle reduces the probability of this wave count in Elliott wave terms.
Within the first flat correction labelled primary wave W of the double flat of cycle wave II, intermediate wave (B) is 1.69 the length of intermediate wave (A). This is longer than the common range of up to 1.38, but within an allowable guideline of up to 2. The length of intermediate wave (B) reduces the probability of this wave count.
Cycle wave III may be complete. Cycle wave IV may not move into cycle wave I price territory below 1,303.51.
DAILY CHART
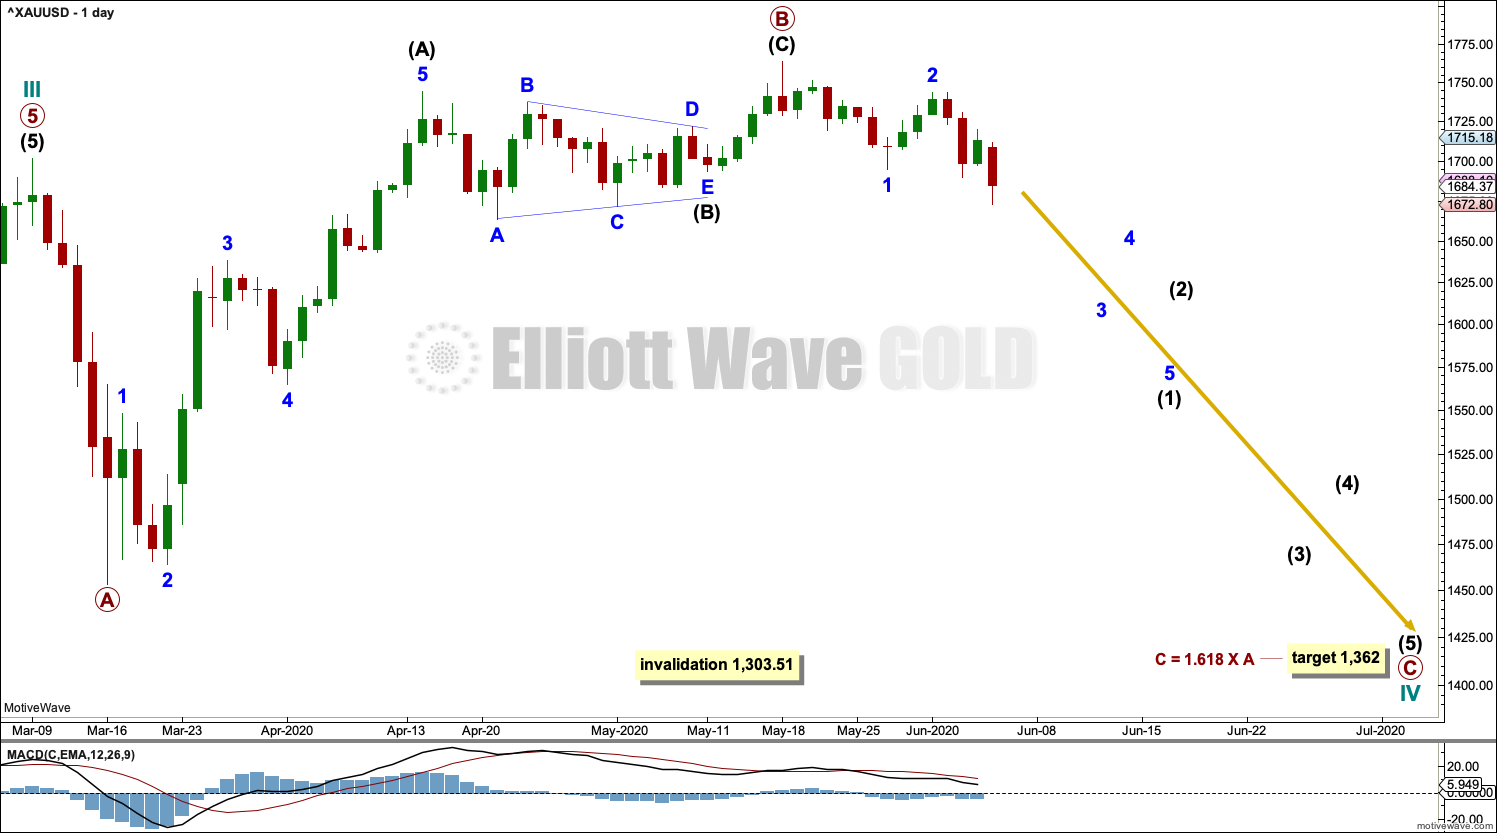
Click chart to enlarge.
Cycle wave IV may be an incomplete expanded flat correction. Primary wave A within the flat correction may have subdivided as a zigzag. Primary wave B may now be a complete zigzag. Primary wave B would be a 1.25 length of primary wave A. This is within the normal range for primary wave B within a flat from 1 to 1.38 times the length of primary wave A.
A target is calculated for primary wave C to end based upon the most common Fibonacci ratio to primary wave A within an expanded flat. Primary wave C must subdivide as a five wave motive structure.
It is still also possible that primary wave B could continue higher as a double zigzag. The common range of primary wave B would extend up to 1.38 times the length of primary wave A at 1,795.98. A maximum allowable guideline for primary wave B would be up to 2 times the length of primary wave A at 1,949.96. There is no Elliott wave rule stating a limit for B waves within expanded flat corrections, so there is no rule which may be used to determine an upper invalidation point for this wave count.
TECHNICAL ANALYSIS
WEEKLY CHART
Click chart to enlarge. Chart courtesy of StockCharts.com.
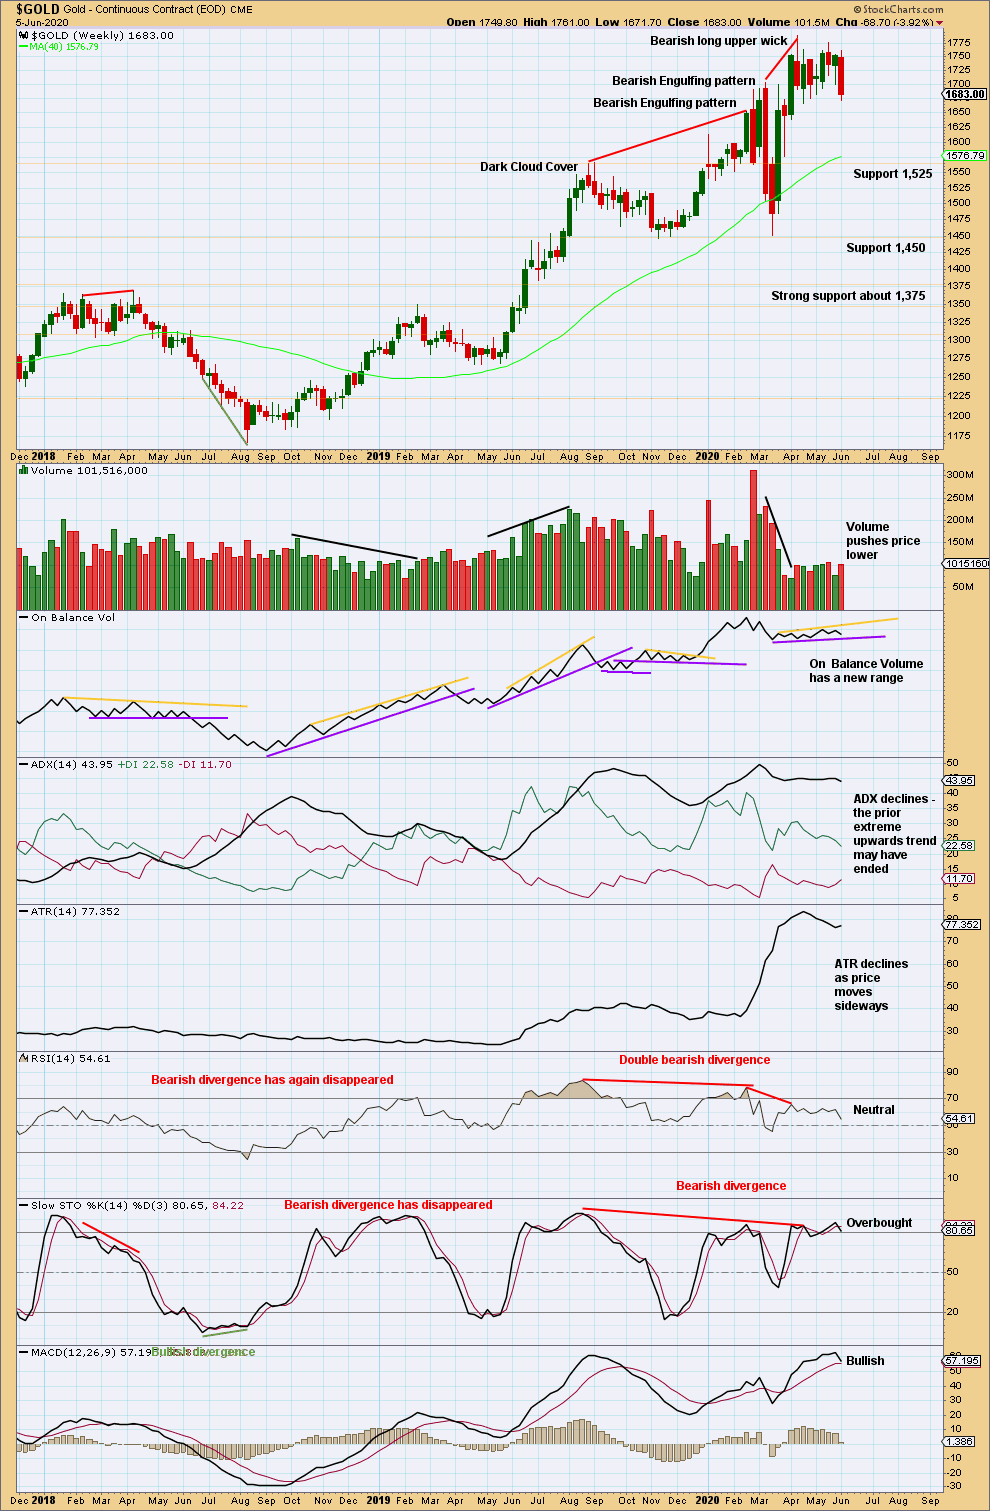
Price remains within a consolidation with support about 1,665 to 1,680. Downwards movement dominated this week but has not managed to close below support. A push from volume for downwards movement this week suggests a downwards breakout may come soon.
DAILY CHART
Click chart to enlarge. Chart courtesy of StockCharts.com.
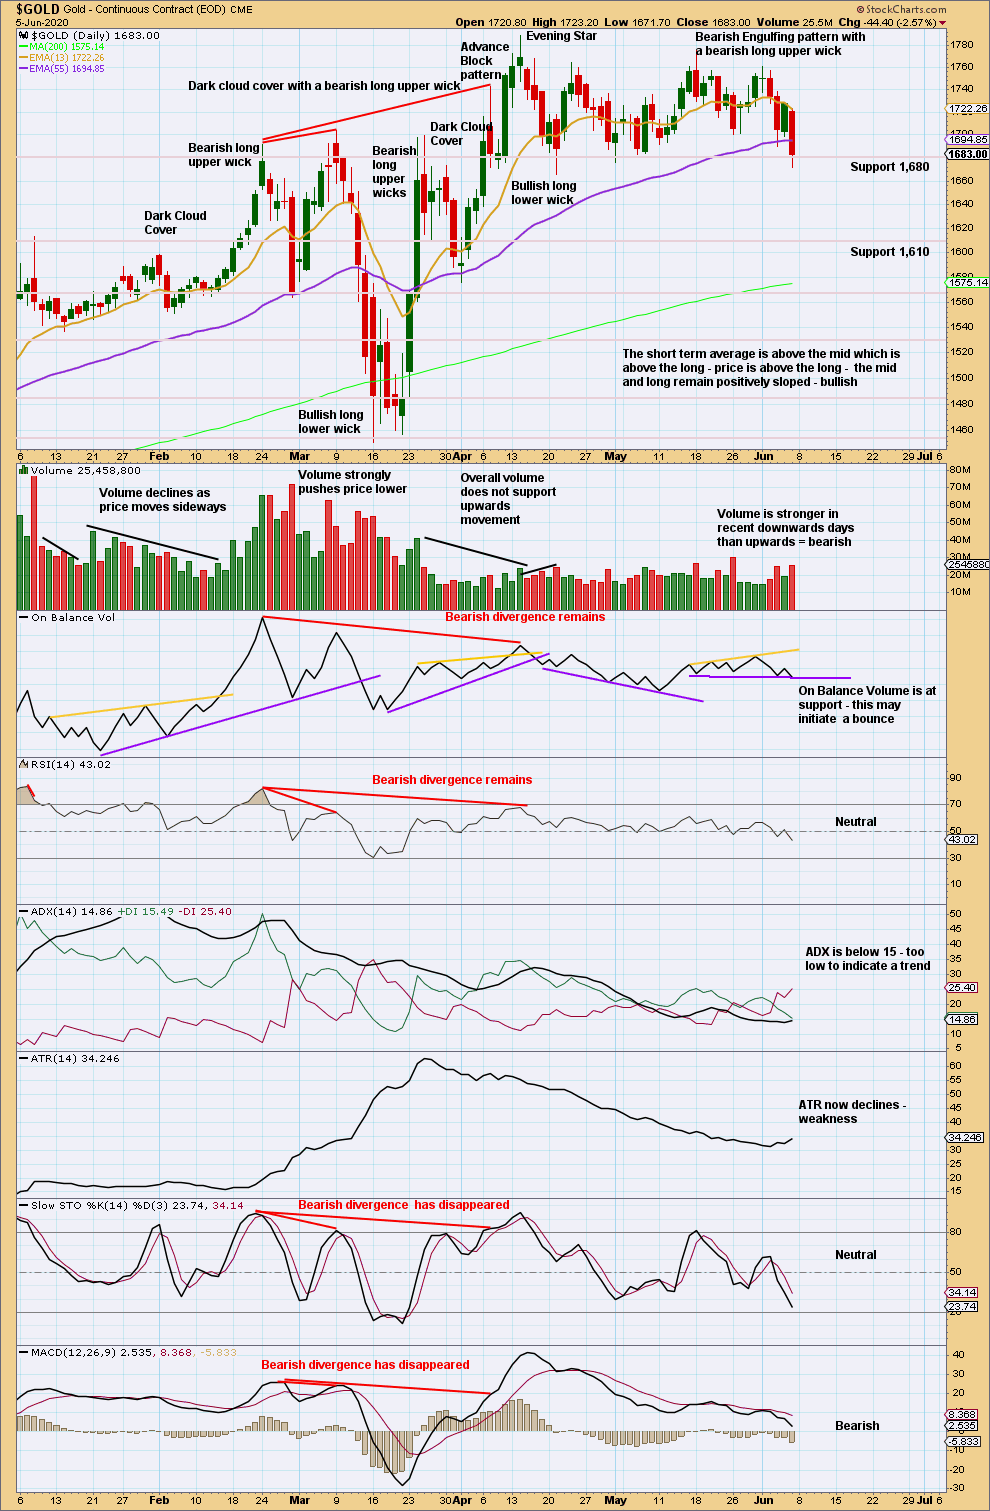
With a bearish reversal pattern having support from volume on the 18th of May, the risk that price has changed trend here is high.
The short-term volume profile remains bearish. There is strong support here about 1,680.
GDX WEEKLY CHART
Click chart to enlarge. Chart courtesy of StockCharts.com.
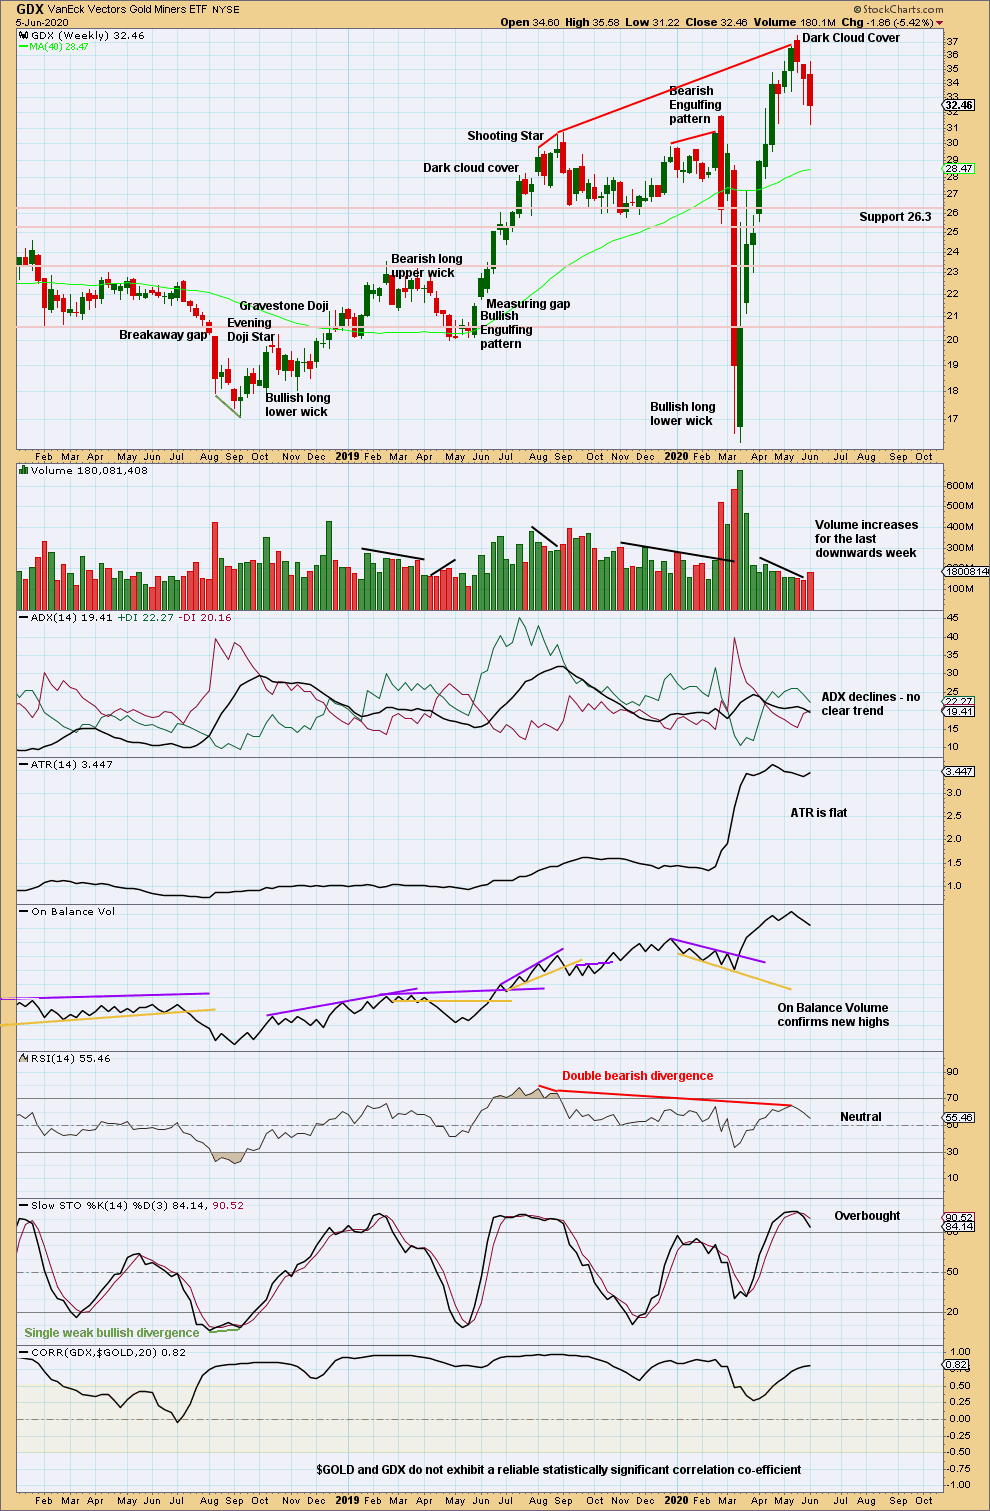
Dark Cloud Cover is a bearish candlestick reversal pattern, but not the strongest reversal pattern (which are Engulfing patterns).
Some push this week from volume with downwards movement suggests more downwards movement ahead.
GDX DAILY CHART
Click chart to enlarge. Chart courtesy of StockCharts.com.
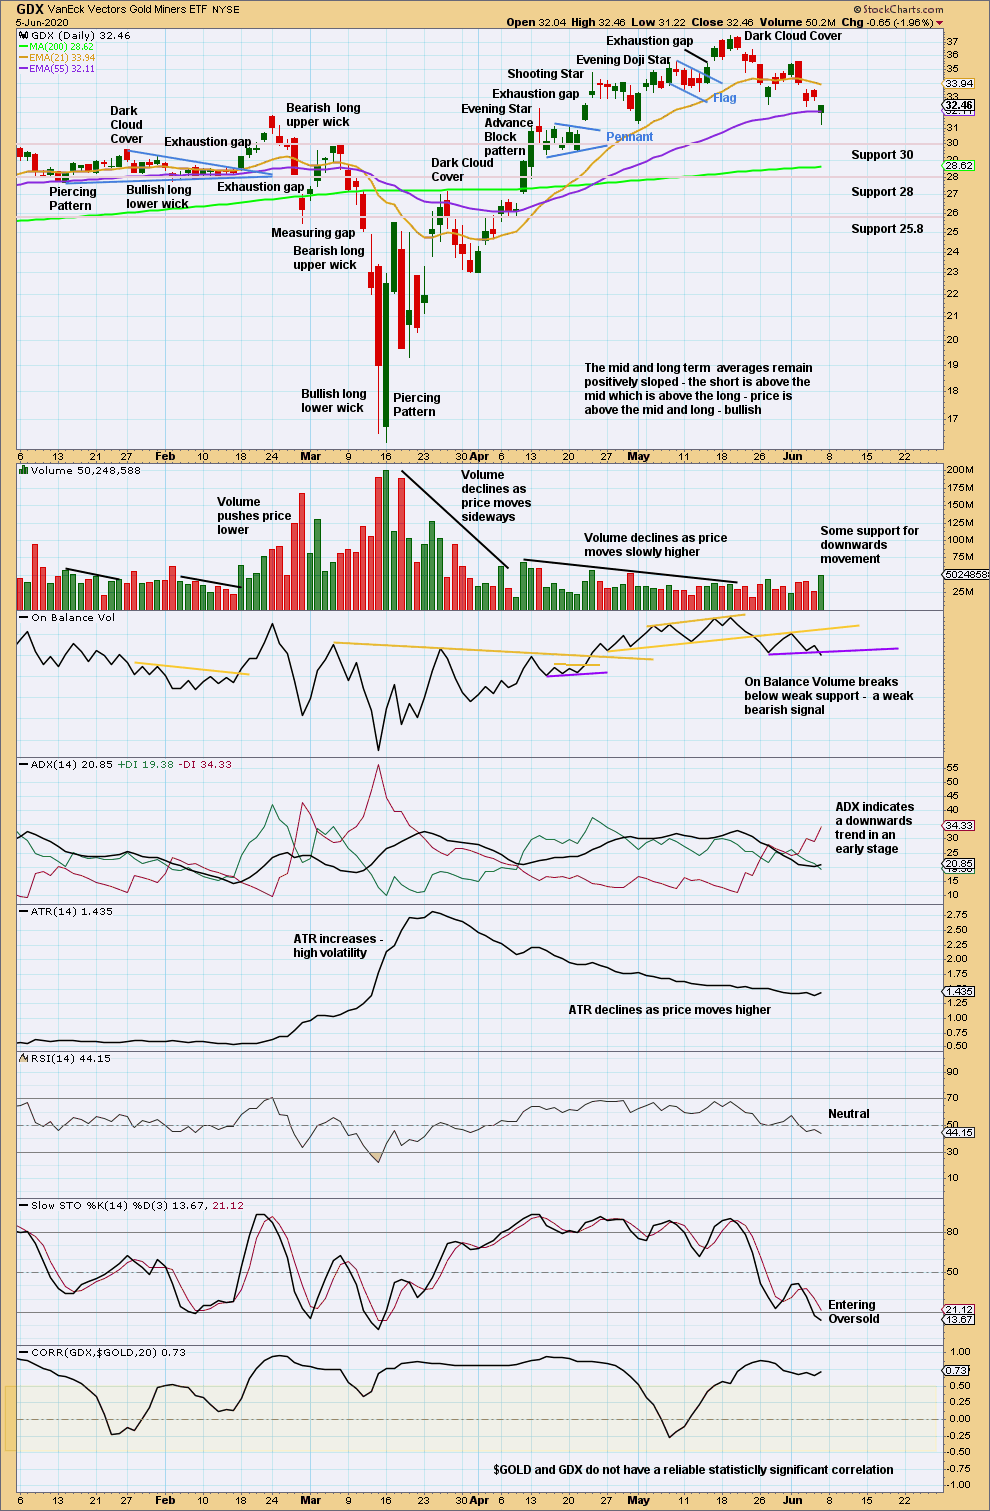
The prior upwards trend reached extreme, but not very extreme. The last gap is closed, and a new swing low below 31.31 has now been seen. The evidence that GDX may have seen a trend change is now mounting. ADX now indicates a downwards trend in an early stage.
Price has closed near highs for the session. For the short term, a bounce may begin next week. Volume pushed price lower on Friday, so any bounce may be expected to be a counter trend movement as the volume profile remains bearish.
US OIL
Further upwards movement this week has remained within an identified channel.
Summary: Oil may have found a major sustainable low. For the short term, use the channel on the daily Elliott wave count. Assume upwards movement continues while price remains within or above the channel. If price breaks below the channel, then assume a deep multi-week pullback may have begun.
ELLIOTT WAVE COUNT
MONTHLY CHART
Click chart to enlarge.
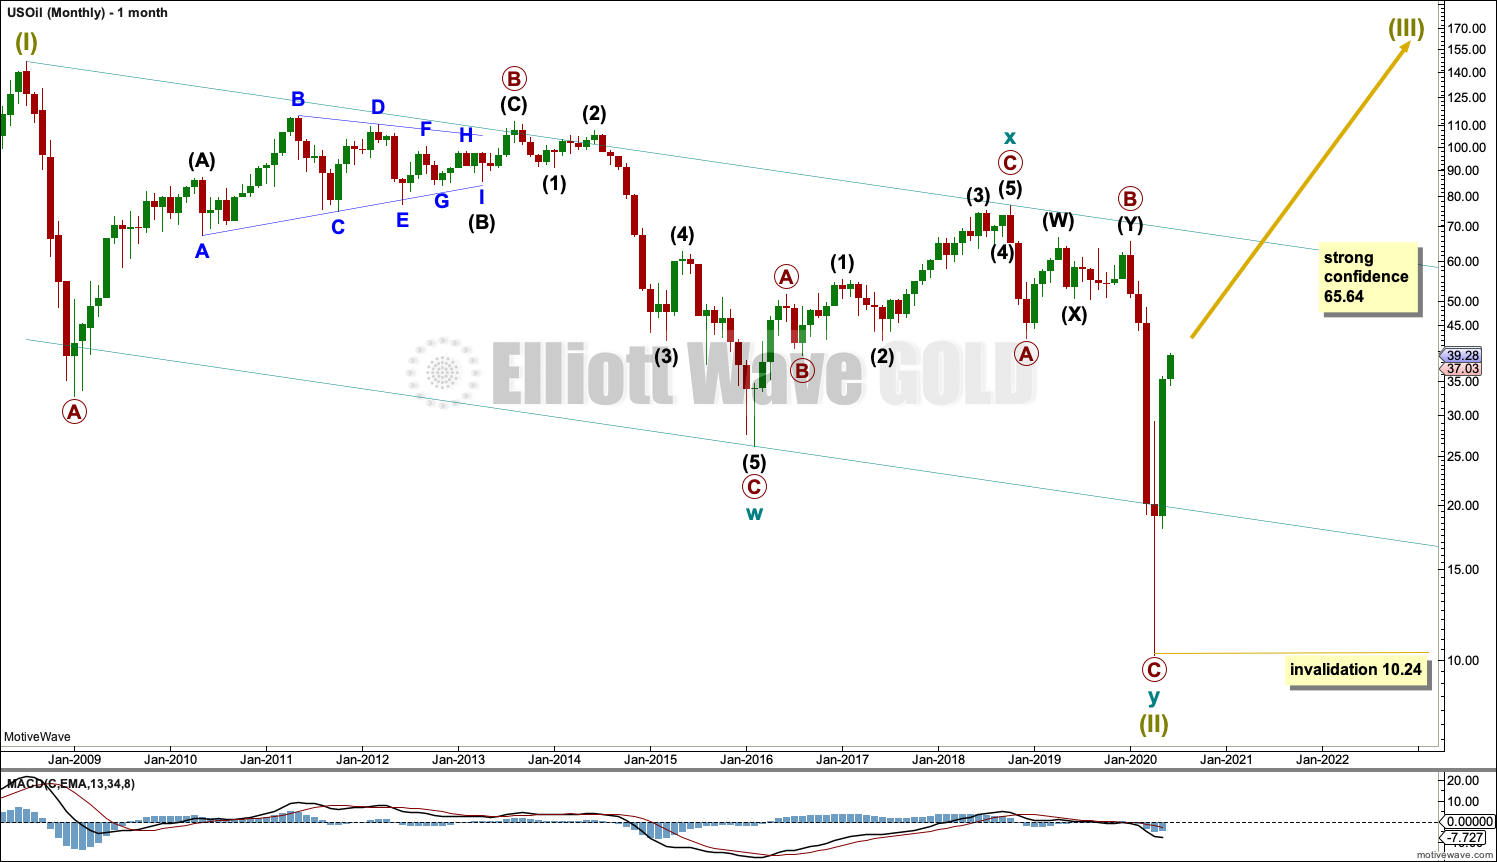
The basic Elliott wave structure is five steps forward and three steps back. This Elliott wave count expects that US Oil has completed a three steps back pattern, which began in July 2008. The Elliott wave count expects that the bear market for US Oil may now be over.
A channel is drawn about Super Cycle wave (II): draw the first trend line from the start of cycle wave w to the end of cycle wave x, then place a parallel copy on the end of cycle wave w. Price has bounced up off the channel. This trend line is breached, which is a typical look for the end of a movement for a commodity.
The upper edge of the channel may provide resistance.
Following five waves up and three steps back should be another five steps up; this is labelled Super Cycle wave (III), which may only have just begun. Super Cycle wave (III) may last a generation and must make a new high above the end of Super Cycle wave (I) at 146.73.
Super Cycle wave (III) may only subdivide as a five wave impulse. New trends for Oil usually start out very slowly with short first waves and deep time consuming second wave corrections. Basing action over a few years may now have begun.
WEEKLY CHART
Click chart to enlarge.
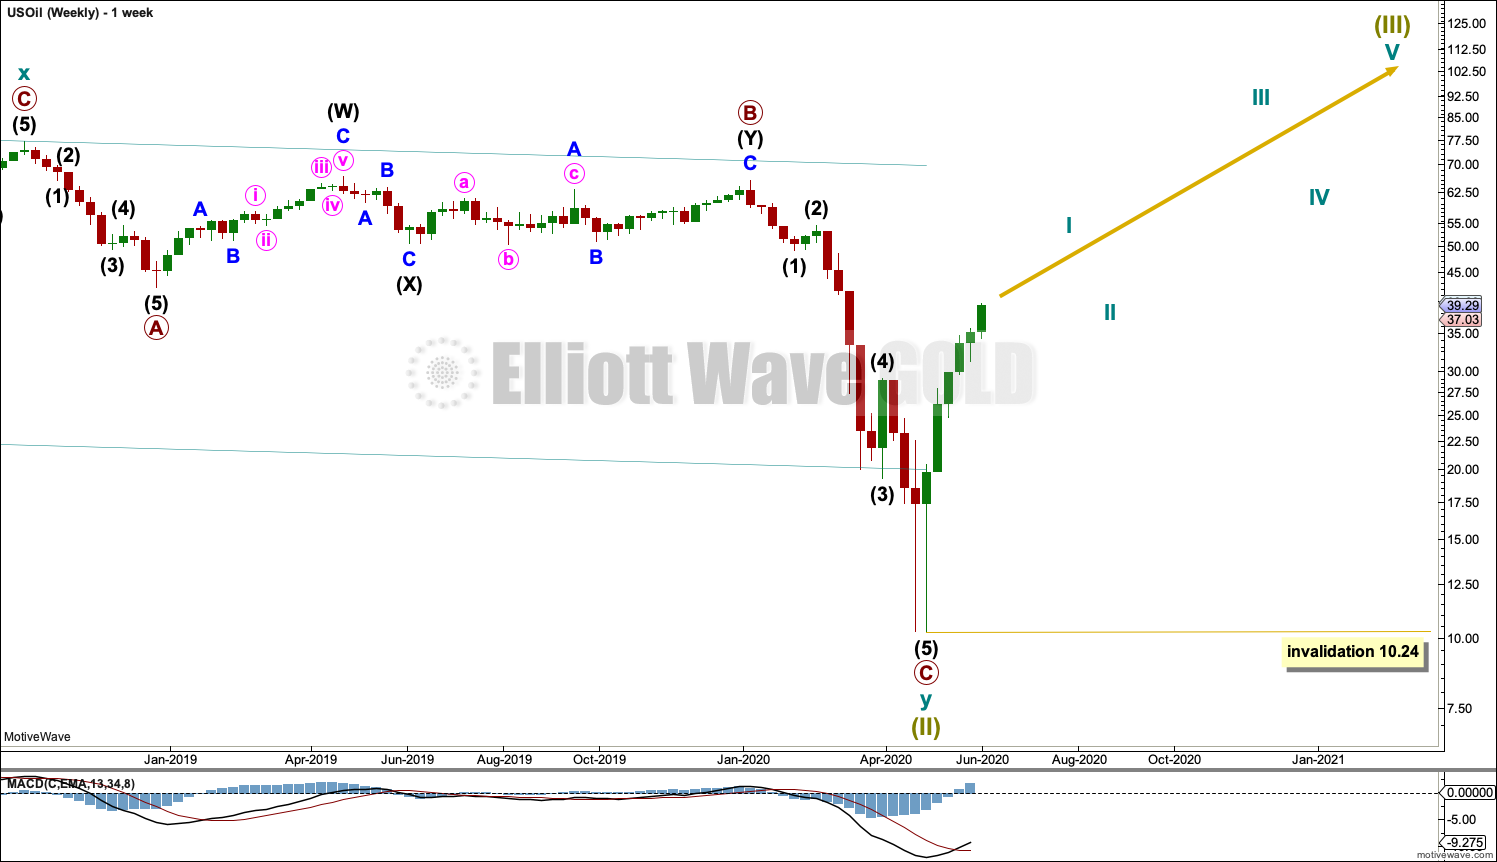
Super Cycle wave (III) must subdivide as an impulse. Cycle wave I within the impulse may now be unfolding higher and may now be very close to an end. Cycle wave II may not move beyond the start of cycle wave I below 10.24.
DAILY CHART
Click chart to enlarge.
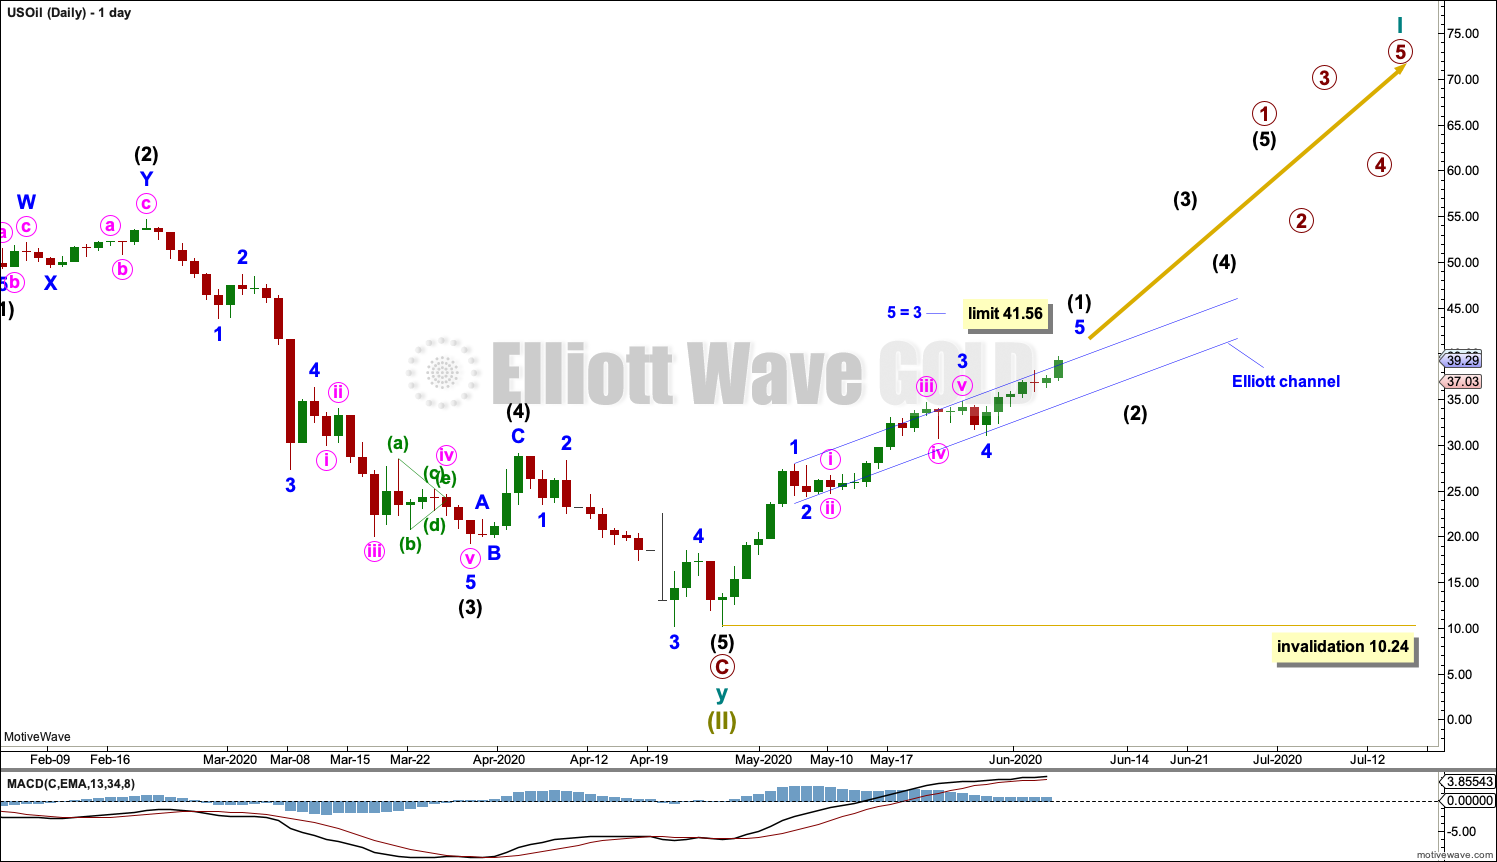
Labels are added for cycle wave I. Although the numbers are placed along the direction arrow, this does not mean that it is expected that Super Cycle wave (III) will move in a straight line. Markets do not move in straight lines; there are counter trend movements along the way.
Intermediate wave (2) and primary wave 2 within cycle wave I may be deep and time consuming. It is normal for Oil for counter trend movements early on in a new developing trend to be deep and time consuming as price forms basing action. This may take several months to possibly even years for Oil.
A small channel is drawn about intermediate wave (1). Assume intermediate wave (1) is continuing while price remains within or above this channel. If the channel is breached by downwards movement, then that may be taken as an early indication that intermediate wave (1) may be over and intermediate wave (2) may have begun. A breach may be defined by a full daily candlestick below and not touching the lower edge of the channel.
If minor degree labels within intermediate wave (1) are correct, then minor wave 3 is shorter than minor wave 1. Because minor wave 3 may not be the shortest actionary wave within intermediate wave (1), minor wave 5 is limited to no longer than equality in length with minor wave 3 at 41.56. A trend change may occur before this limit.
If the limit at 41.56 is reached and price continues higher, then the alternate daily chart below would be used.
Intermediate wave (2) may not move beyond the start of intermediate wave (1) below 10.24. Intermediate wave (2) may be reasonably expected to be very deep and last at least five weeks.
ALTERNATE DAILY CHART
Click chart to enlarge.
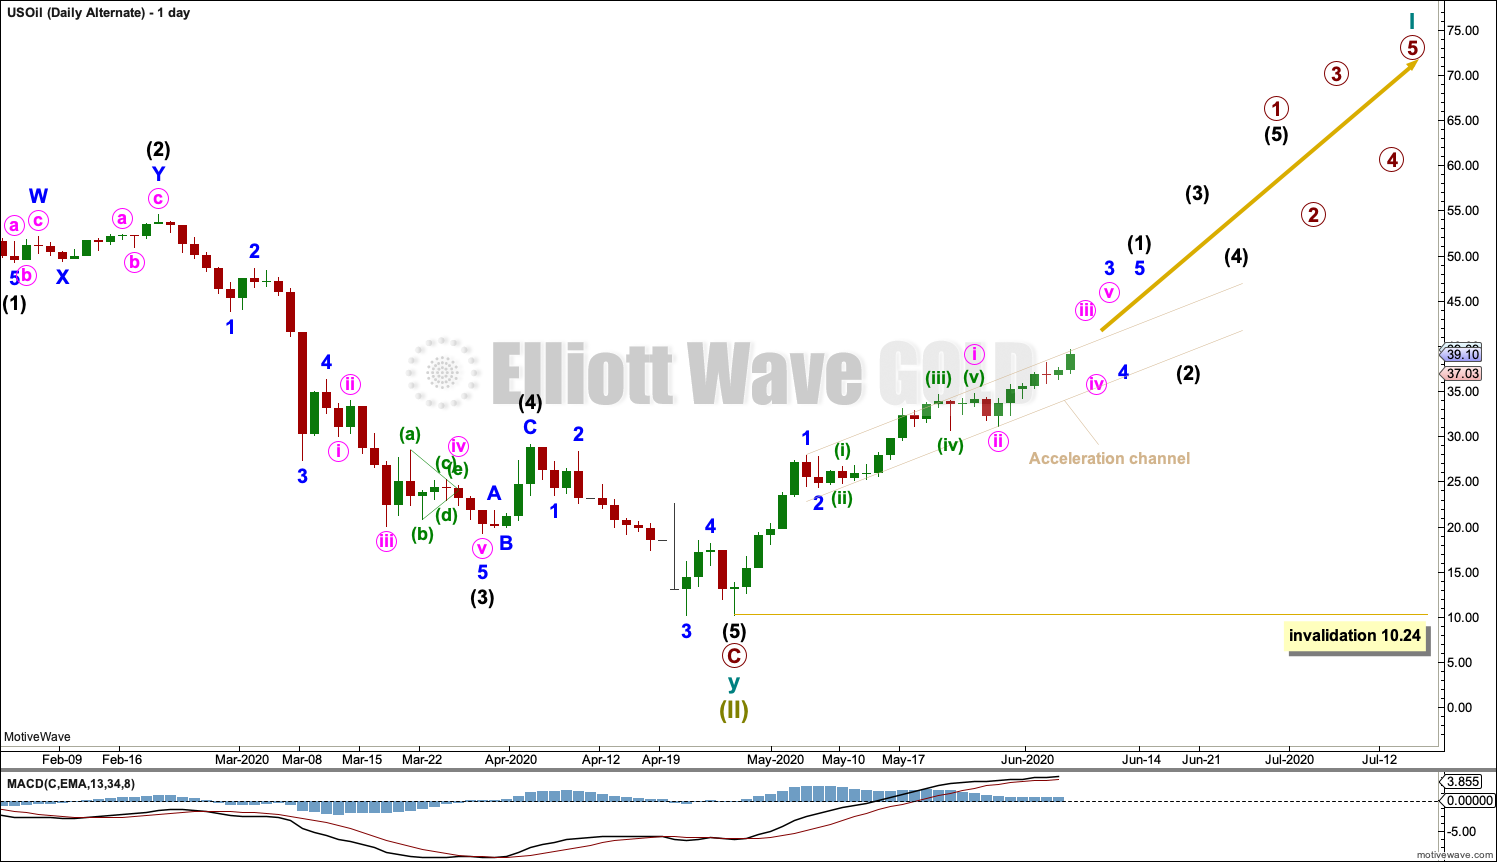
This wave count is the same as the first daily chart with the exception of the degree of labelling within minor wave 3. This alternate wave count moves the degree of labelling within minor wave 3 down one degree.
Minor wave 3 may be an incomplete impulse.
Draw an acceleration channel about upwards movement as shown. Keep redrawing the channel as price continues higher. Assume the upwards trend remains while price remains within or above this channel.
Intermediate wave (2) may not move beyond the start of intermediate wave (1) below 10.24. Intermediate wave (2) may be reasonably expected to be very deep and last at least five weeks.
TECHNICAL ANALYSIS
WEEKLY CHART
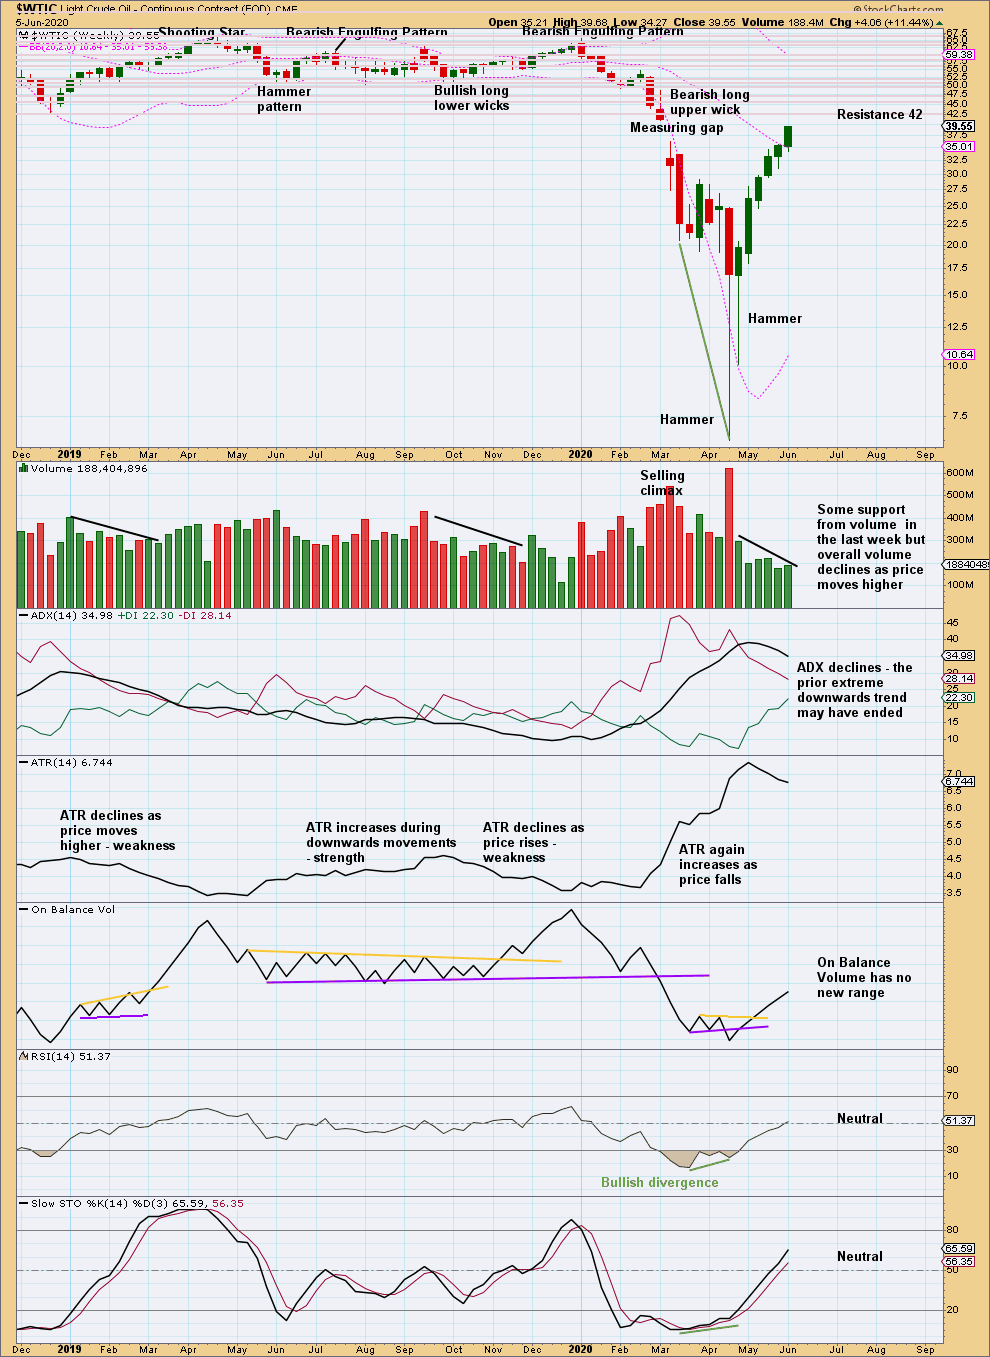
Click chart to enlarge. Chart courtesy of StockCharts.com.
Price is continuing higher despite declining range and volume; declining volume and range indicate this upwards movement is at risk of a pullback. However, a close this week very near highs for the week suggest more upwards movement immediately ahead.
DAILY CHART
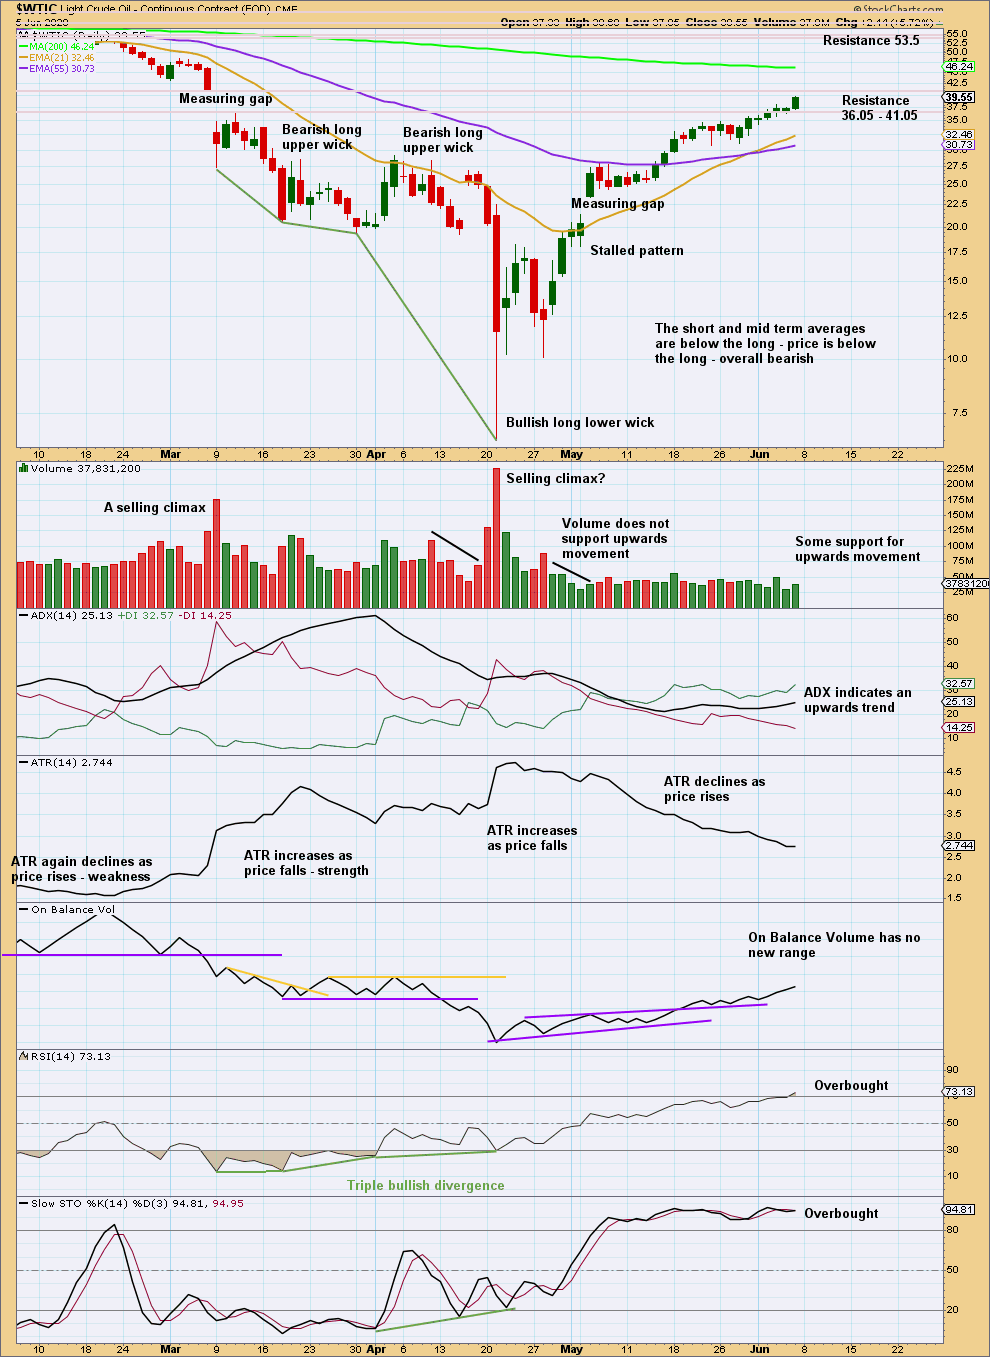
Click chart to enlarge. Chart courtesy of StockCharts.com.
Price approaches strong resistance. RSI is now just overbought. There is still a little room for upwards movement to continue.
—
Always practice good risk management as the most important aspect of trading. Always trade with stops and invest only 1-5% of equity on any one trade. Failure to manage risk is the most common mistake new traders make.