
SILVER: Elliott Wave and Technical Analysis | Charts – June 5, 2020
Upwards movement continued overall this week for Silver as expected. Price remains within a channel.
Summary: The main wave count now expects new highs substantially above 49.752 in coming years.
For the short to mid term, a multi-week pullback may have begun this week that may end about 14.245 or below.
ELLIOTT WAVE COUNT
MONTHLY CHART
Click chart to enlarge.
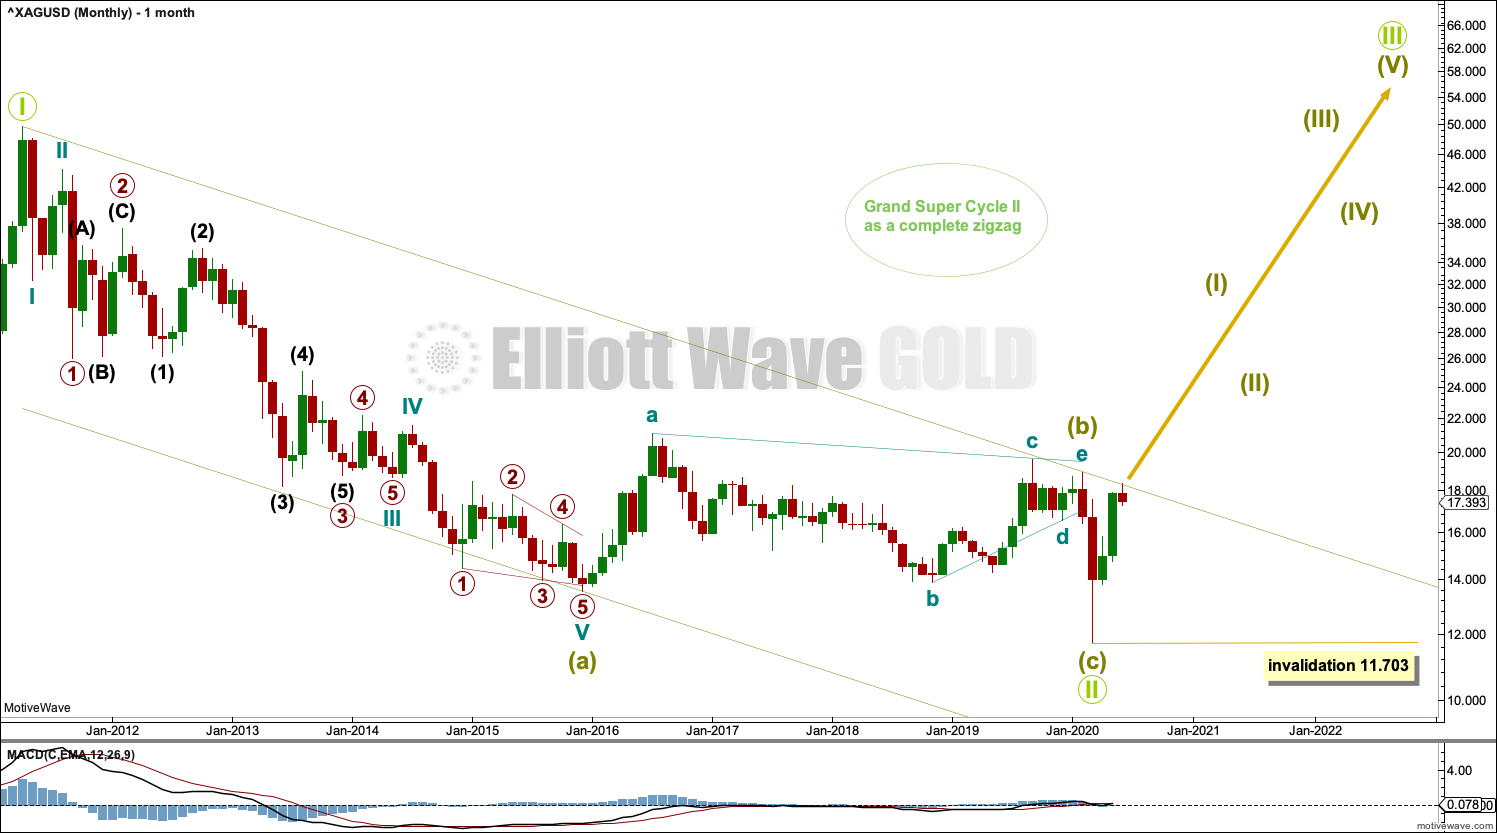
The bear market for Silver may be complete.
This Elliott wave structure for this bear market is labelled as a single zigzag for Grand Super Cycle wave II. Single zigzags are the most common Elliott wave corrective structure.
Within the zigzag: Super Cycle wave (a) subdivides as a five wave impulse, Super Cycle wave (b) subdivides as a complete regular contracting triangle, and Super Cycle wave (c) subdivides as a complete five wave impulse that is relatively brief and shallow.
Draw a channel about the entire bear market of Grand Super Cycle wave II as shown. A breach of the upper edge of this channel would add confidence to this wave count. It is possible that price may find resistance at the upper edge of this channel, which may initiate a pullback. The trend line has been reached this week and price has so far turned down from there.
Grand Super Cycle wave III must subdivide as a five wave impulse at Super Cycle degree.
WEEKLY CHART
Click chart to enlarge.
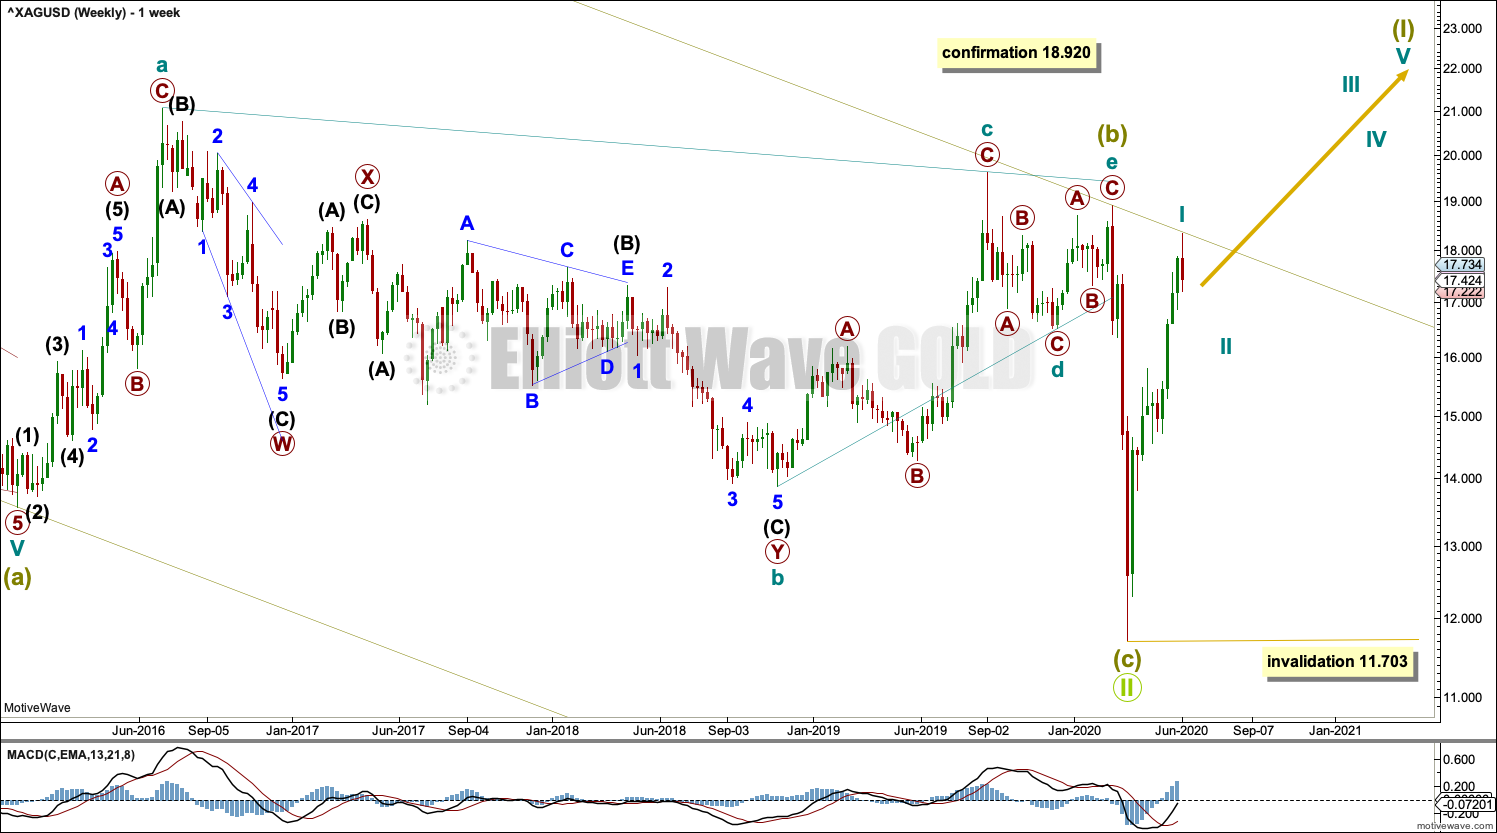
Grand Super Cycle wave II may be a complete zigzag. A new bull market may have begun for Silver.
The channel about Grand Super Cycle wave II is copied over from the monthly chart and extended outwards. The upper edge may provide resistance and may initiate a pullback.
Super Cycle wave (I) must subdivide as a five wave motive structure, either an impulse or a leading diagonal. An impulse is much more common, so that is what shall be expected unless overlapping suggests a diagonal should be considered.
Cycle wave I may be complete as per the main daily chart below, or it may be incomplete as per the alternate daily chart below.
Cycle wave II may not move beyond the start of cycle wave I below 11.703.
DAILY CHART
Click chart to enlarge.
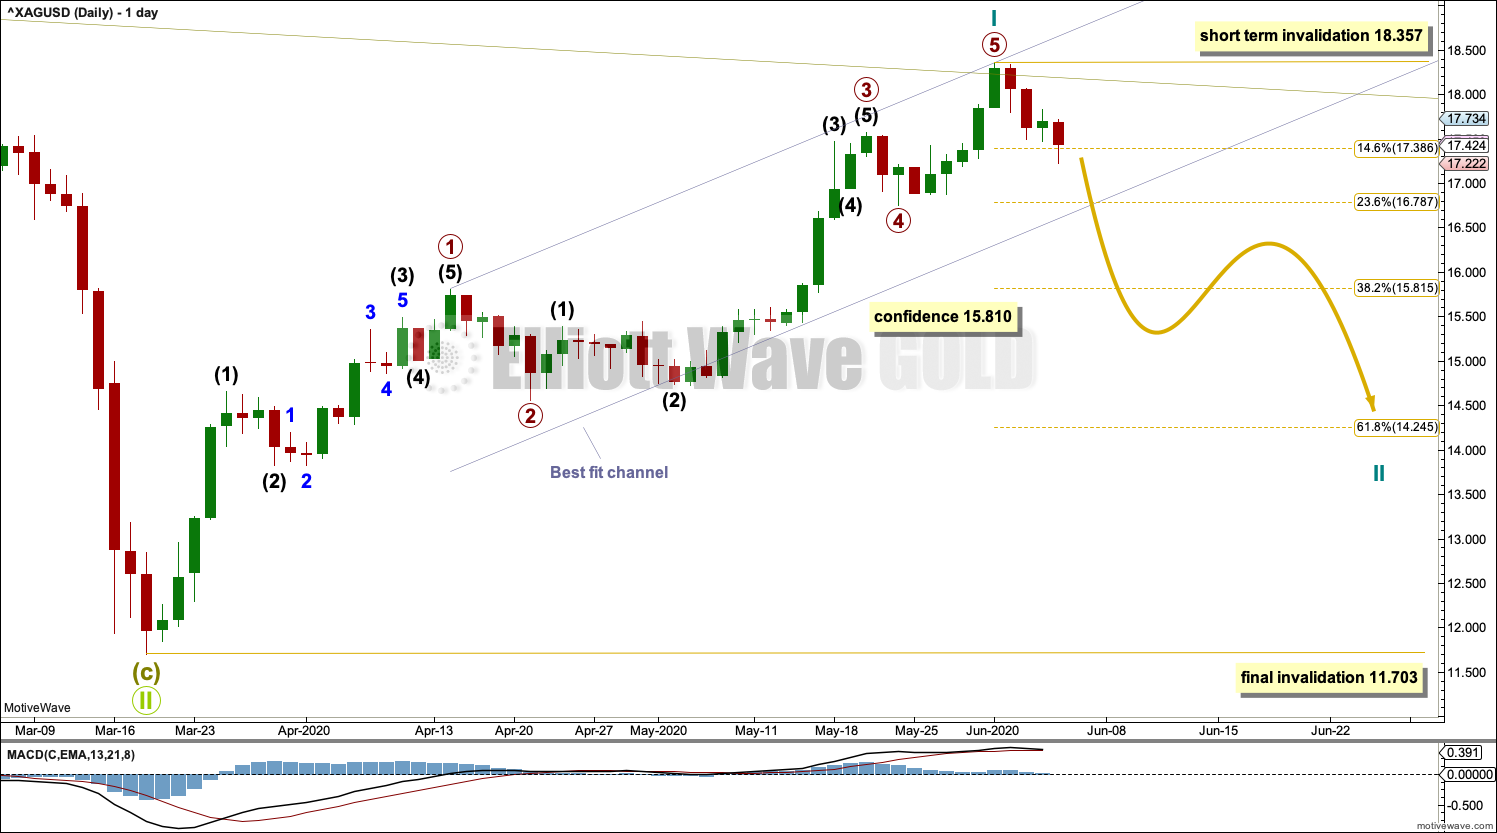
It is possible that cycle wave I upwards is a complete five wave impulse that found resistance and ended at the upper edge of the channel copied over from monthly and weekly charts. It is possible that a multi-week pullback for cycle wave II has begun at this week’s high.
The first large correction within a new trend for Silver is often very time consuming and deep. Cycle wave II may end about the 0.618 Fibonacci ratio of cycle wave I, or it may end below this point.
ALTERNATE DAILY CHART
Click chart to enlarge.
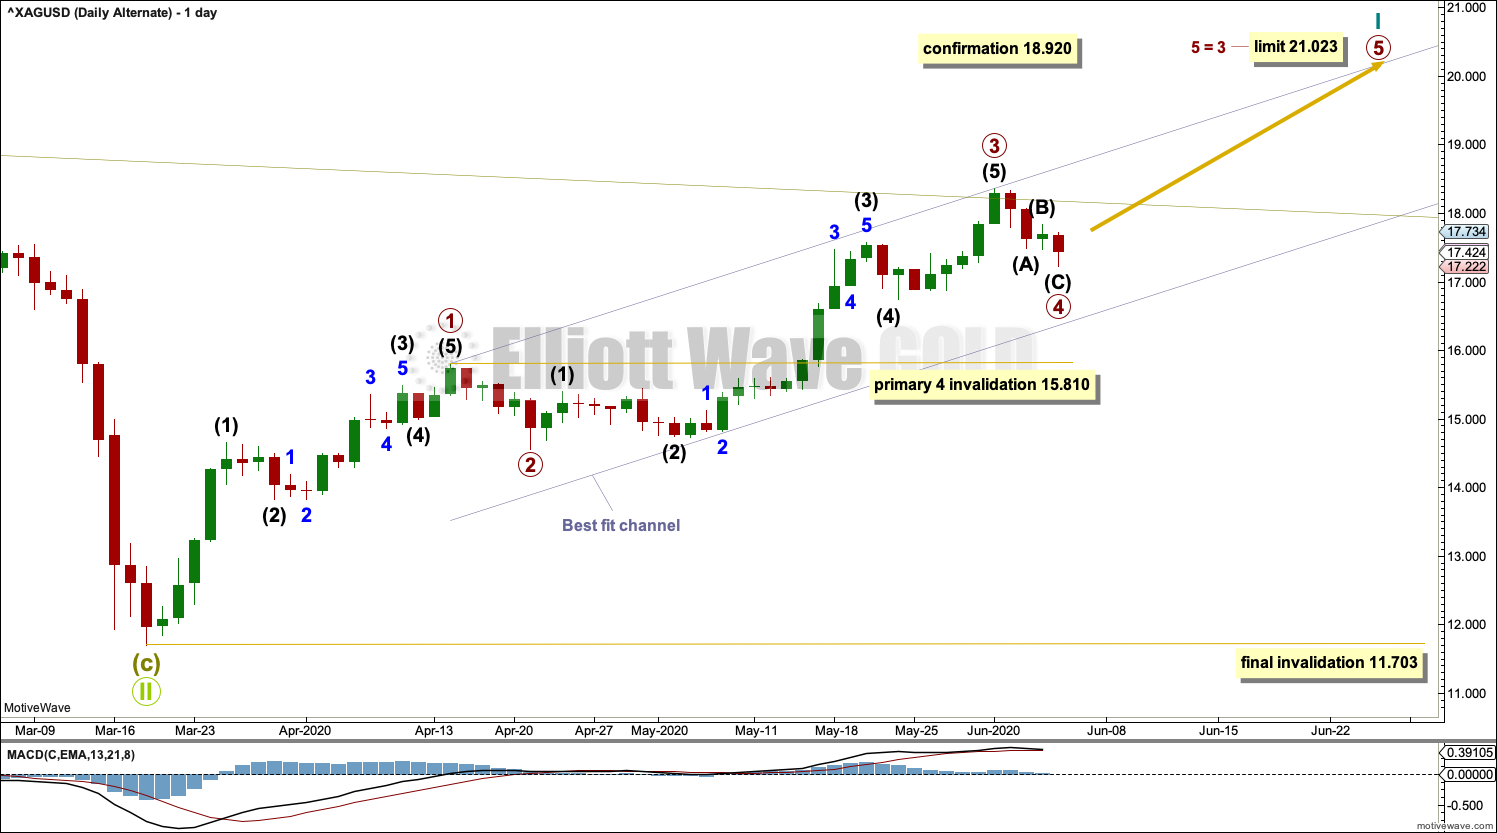
Cycle wave I may be an incomplete five wave impulse. Primary waves 1 and 2 within the impulse may be complete.
Primary wave 3 may be complete, finding resistance at the upper edge of the channel copied over from weekly and monthly charts.
Primary wave 4 may not move into primary wave 1 price territory below 15.810.
Draw a channel as shown about cycle wave I. Primary wave 4 may find support about the lower edge. If this channel is breached by downwards movement, then this wave count would be discarded.
Cycle wave II may not move beyond the start of cycle wave I below 11.703.
TECHNICAL ANALYSIS
WEEKLY CHART
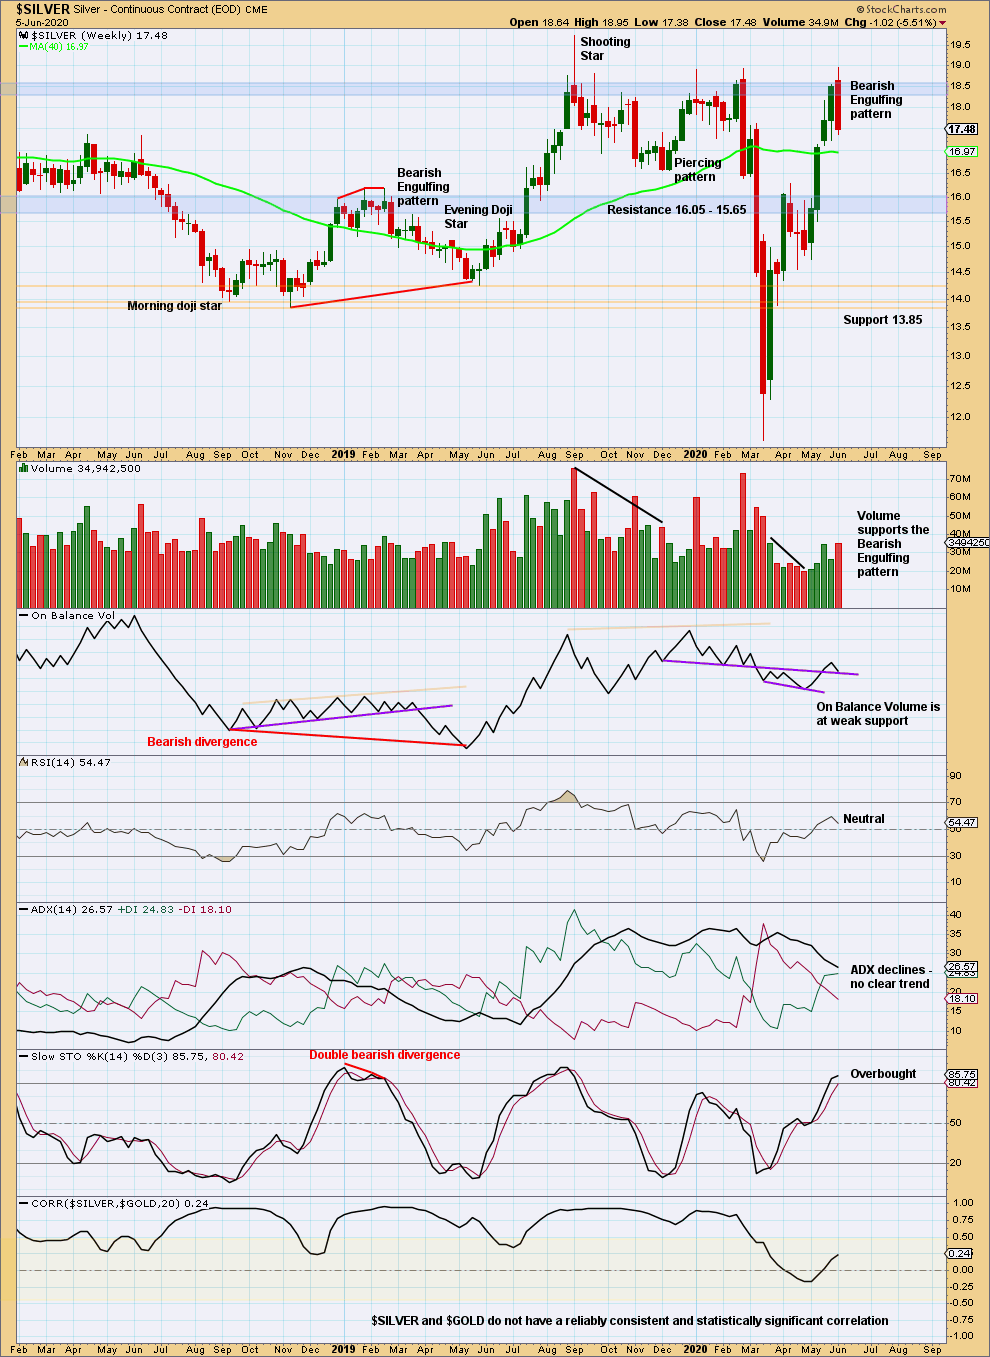
Click chart to enlarge. Chart courtesy of StockCharts.com.
Price has reached up into a strong zone of resistance and turned down there. The bearish candlestick reversal pattern with support from volume suggests a trend change is fairly likely.
DAILY CHART
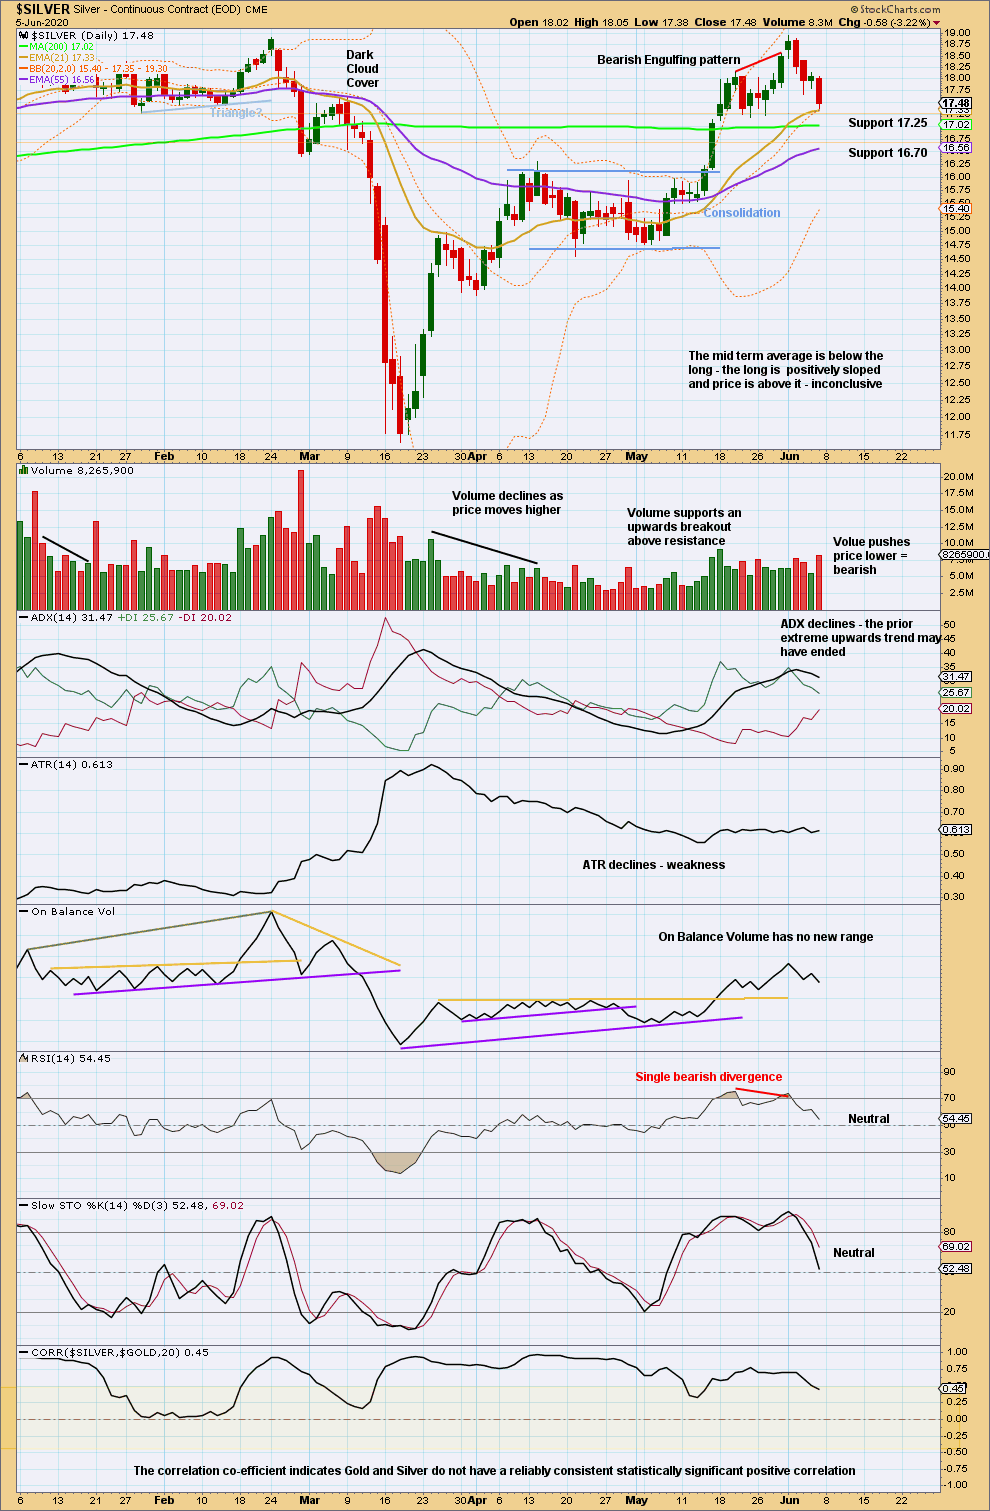
Click chart to enlarge. Chart courtesy of StockCharts.com.
The prior upwards trend reached extreme while RSI reached overbought and there exhibited bearish divergence. This situation is often associated with trend changes.
Now downwards movement has support from volume. It looks fairly likely that Silver may have had a trend change.
Published @ 04:27 p.m. EST on June 6, 2020.
—
Careful risk management protects your trading account(s).
Follow my two Golden Rules:
1. Always trade with stops.
2. Risk only 1-5% of equity on any one trade.
—
New updates to this analysis are in bold.