
SILVER: Elliott Wave and Technical Analysis | Charts – June 26, 2020
Summary: For the short to mid term, a multi-week pullback may have begun that may end about 14.245 or below.
The main wave count is now bullish and expects new highs substantially above 49.752 in coming years.
ELLIOTT WAVE COUNT
MONTHLY CHART
Click chart to enlarge.
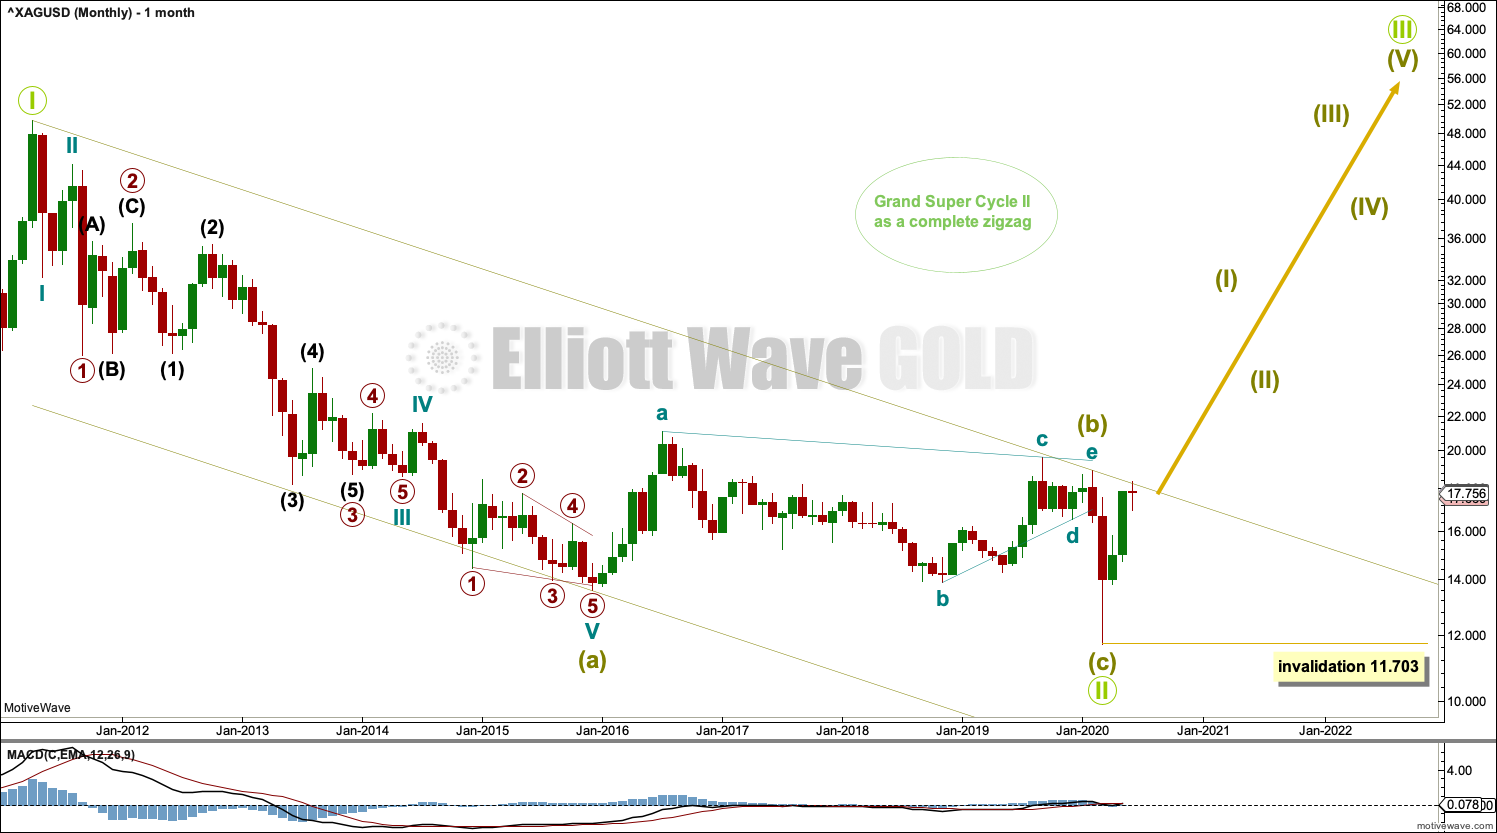
The bear market for Silver may be complete.
This Elliott wave structure for this bear market is labelled as a single zigzag for Grand Super Cycle wave II. Single zigzags are the most common Elliott wave corrective structure.
Within the zigzag: Super Cycle wave (a) subdivides as a five wave impulse, Super Cycle wave (b) subdivides as a complete regular contracting triangle, and Super Cycle wave (c) subdivides as a complete five wave impulse that is relatively brief and shallow.
Draw a channel about the entire bear market of Grand Super Cycle wave II as shown. A breach of the upper edge of this channel would add confidence to this wave count. Price may have found resistance at the upper edge of this channel, which may have initiated a pullback.
When charts are drawn on a semi-log scale, price has perfectly turned down from the upper edge of the trend channel. Copy this channel over to weekly and daily charts.
Grand Super Cycle wave III must subdivide as a five wave impulse at Super Cycle degree.
WEEKLY CHART
Click chart to enlarge.
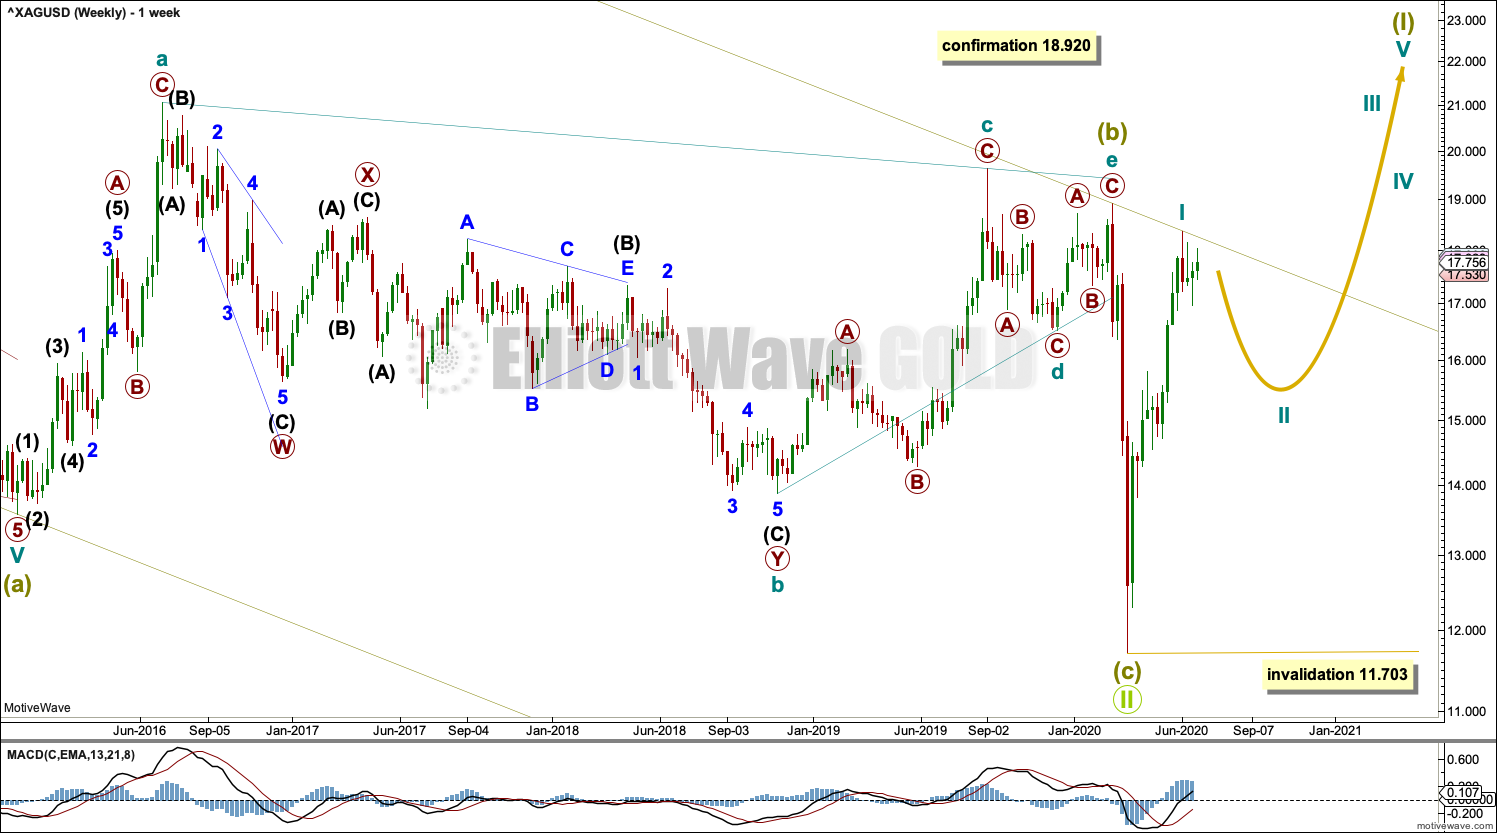
Grand Super Cycle wave II may be a complete zigzag. A new bull market may have begun for Silver.
The channel about Grand Super Cycle wave II is copied over from the monthly chart and extended outwards.
Super Cycle wave (I) must subdivide as a five wave motive structure, either an impulse or a leading diagonal. An impulse is much more common, so that is what shall be expected unless overlapping suggests a diagonal should be considered.
Cycle wave I may be complete as per the main daily chart below, or it may be incomplete as per the alternate daily chart below.
Cycle wave II may not move beyond the start of cycle wave I below 11.703.
DAILY CHART
Click chart to enlarge.
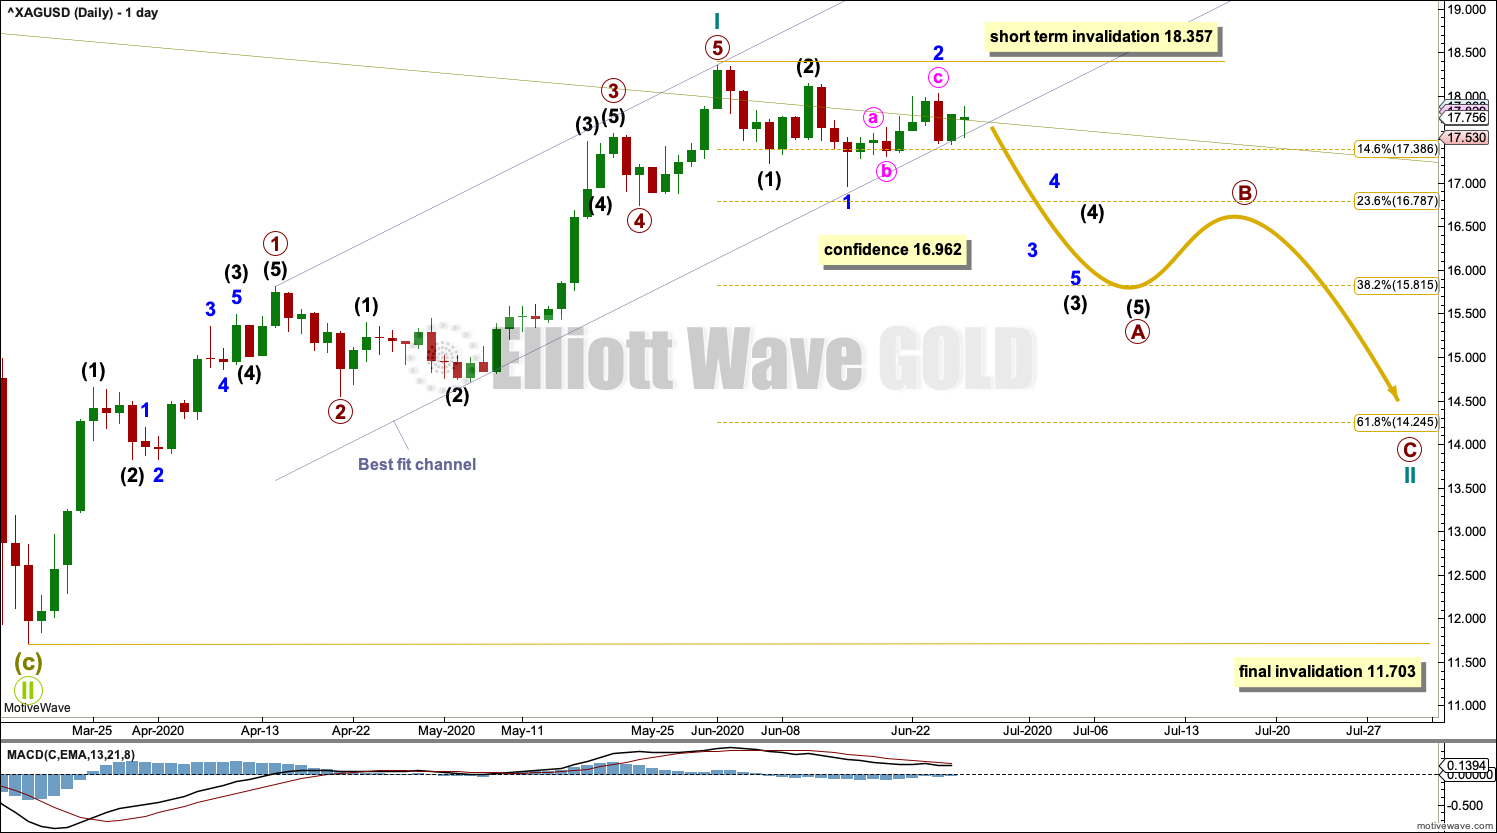
It is possible that cycle wave I upwards is a complete five wave impulse that found resistance and ended at the upper edge of the channel copied over from monthly and weekly charts.
Note that monthly and weekly charts are on a semi-log scale, but daily charts are on an arithmetic scale. This makes a slight difference to where the trend line sits. On a semi-log scale price has reacted perfectly at the trend line.
It is possible that a multi-week pullback for cycle wave II has begun.
The first large correction within a new trend for Silver is often very time consuming and deep. Cycle wave II may end about the 0.618 Fibonacci ratio of cycle wave I, or it may end below this point.
At this stage, it is not possible to know which Elliott wave corrective structure may unfold for cycle wave II. The most common structure is a zigzag, so that would be most likely; that is how cycle wave II is labelled.
Cycle wave II may also unfold as any one of a flat, combination or multiple zigzag. The only Elliott wave corrective structure it may not unfold as is a triangle. As cycle wave II continues further, labelling of subdivisions and structure within it will very likely change and alternate wave counts may be used. Focus should not be on identifying which structure is unfolding and so trying to anticipate each small swing within it. Focus should be on identifying when a complete corrective structure can be seen and when a breakout may occur.
At this stage, it looks like cycle wave II may be incomplete.
ALTERNATE DAILY CHART
Click chart to enlarge.
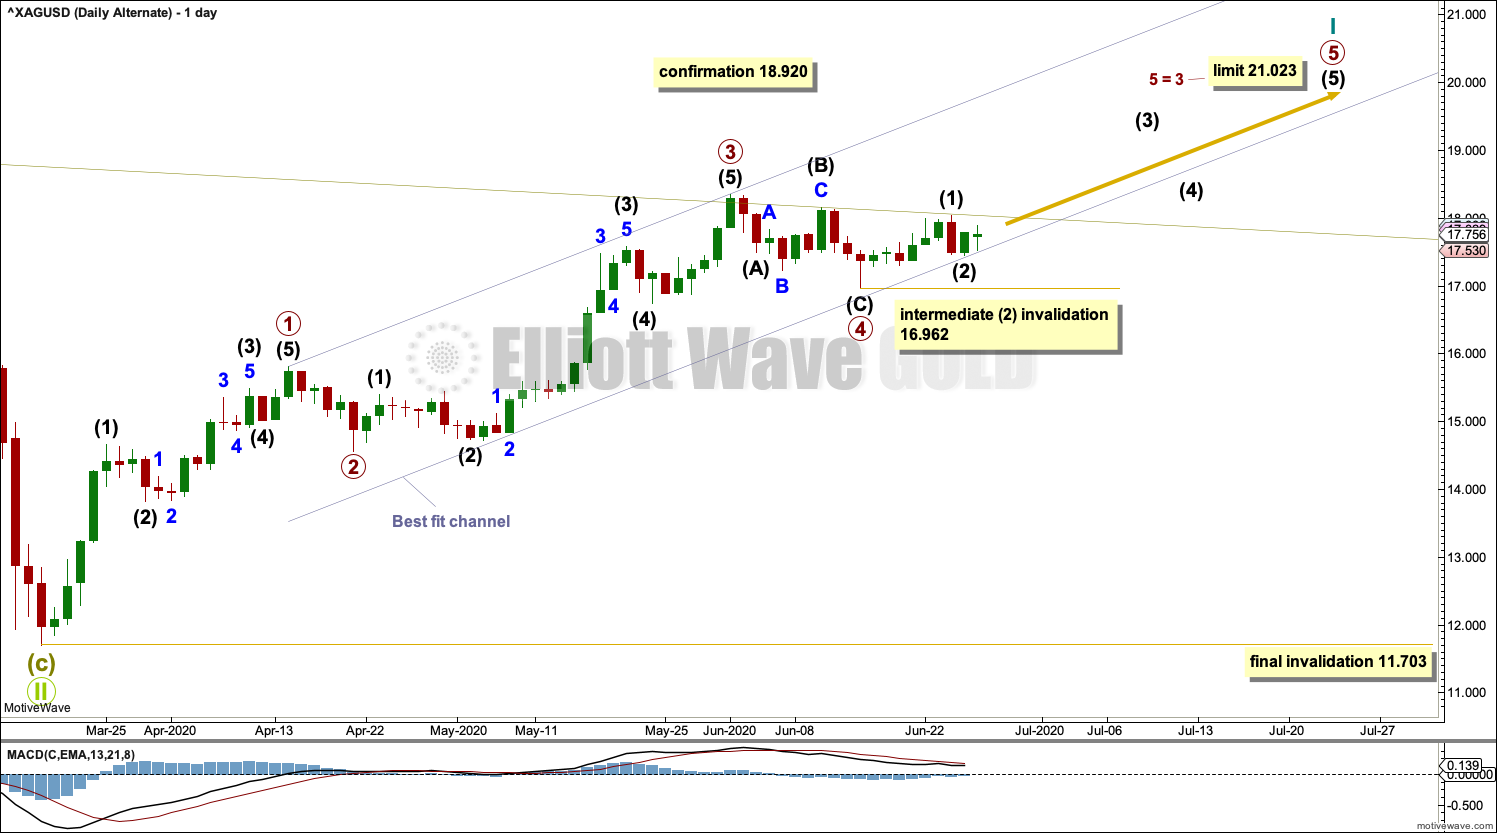
Cycle wave I may be an incomplete five wave impulse. Primary waves 1 and 2 within the impulse may be complete.
Primary wave 3 may be complete, finding resistance at the upper edge of the channel copied over from weekly and monthly charts.
Primary wave 4 may be complete.
Primary wave 5 may have begun. Intermediate wave (2) within primary wave 5 may not move beyond the start of intermediate wave (1) below 16.962.
Draw a channel as shown about cycle wave I. Primary wave 4 may have found support about the lower edge. If this channel is breached by downwards movement, then this wave count would be discarded prior to invalidation.
Cycle wave II may not move beyond the start of cycle wave I below 11.703.
TECHNICAL ANALYSIS
WEEKLY CHART
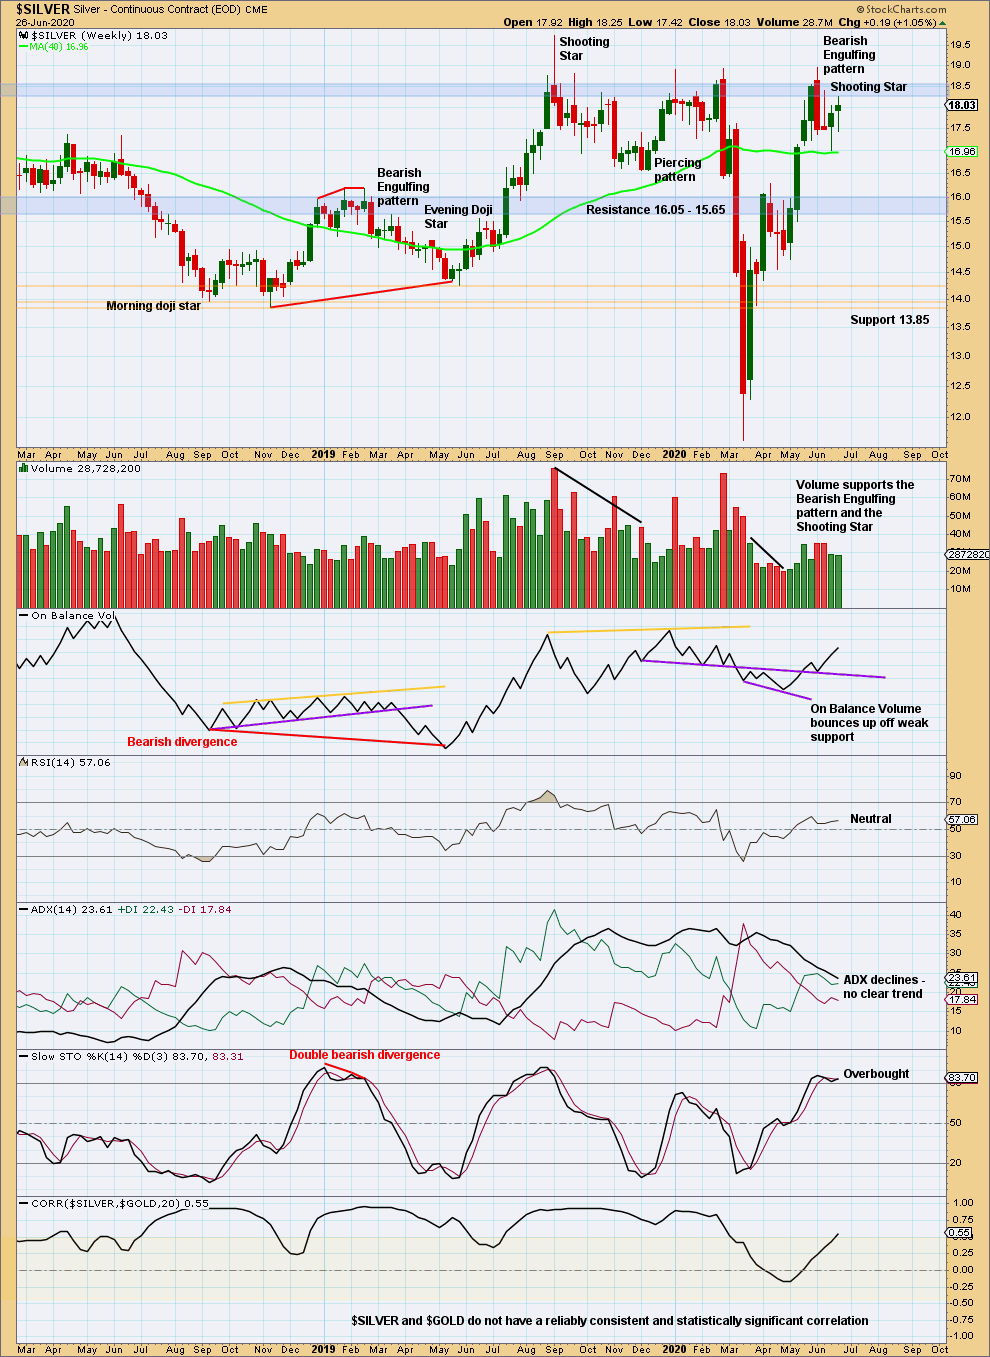
Click chart to enlarge. Chart courtesy of StockCharts.com.
Although price has again moved higher this week, volume does not support upwards movement. Price remains below resistance.
DAILY CHART
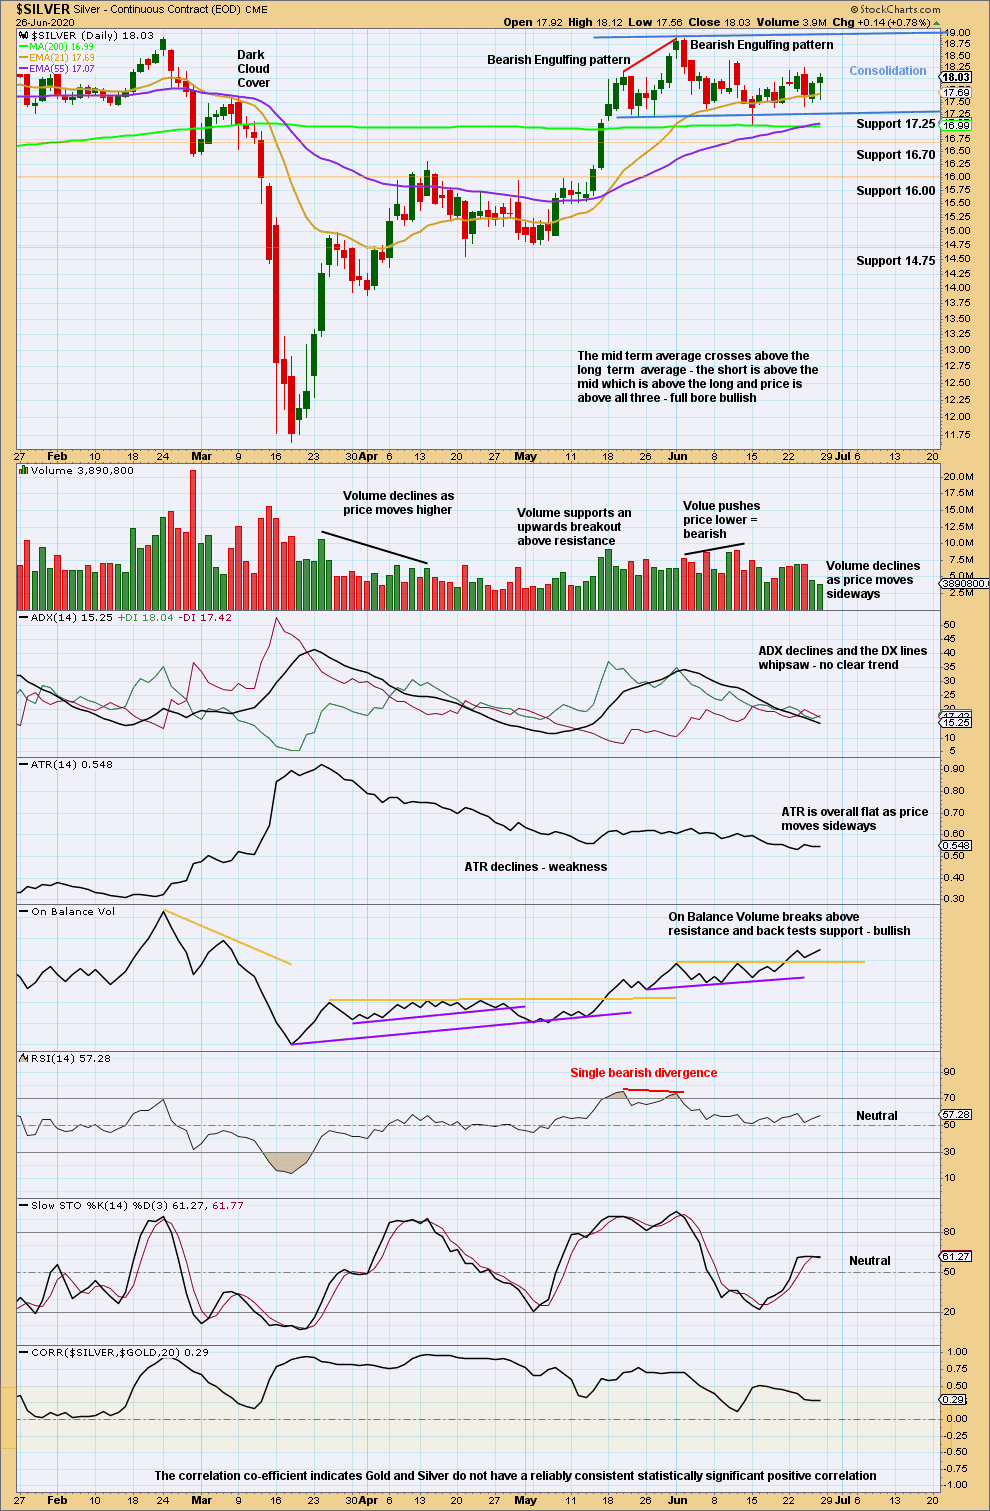
Click chart to enlarge. Chart courtesy of StockCharts.com.
Price is consolidating with resistance about 18.95 and support about 17.20. A breakout is required for confidence in the next trend direction. On Balance Volume suggests the breakout may be upwards, which would support the alternate Elliott wave count.
Published @ 07:42 p.m. ET on June 27, 2020.
—
Careful risk management protects your trading account(s).
Follow my two Golden Rules:
1. Always trade with stops.
2. Risk only 1-5% of equity on any one trade.
—
New updates to this analysis are in bold.