
US OIL: Elliott Wave and Technical Analysis | Charts – June 5, 2020
Further upwards movement this week has remained within an identified channel.
Summary: Oil may have found a major sustainable low. For the short term, use the channel on the daily Elliott wave count. Assume upwards movement continues while price remains within or above the channel. If price breaks below the channel, then assume a deep multi-week pullback may have begun.
ELLIOTT WAVE COUNT
MONTHLY CHART
Click chart to enlarge.
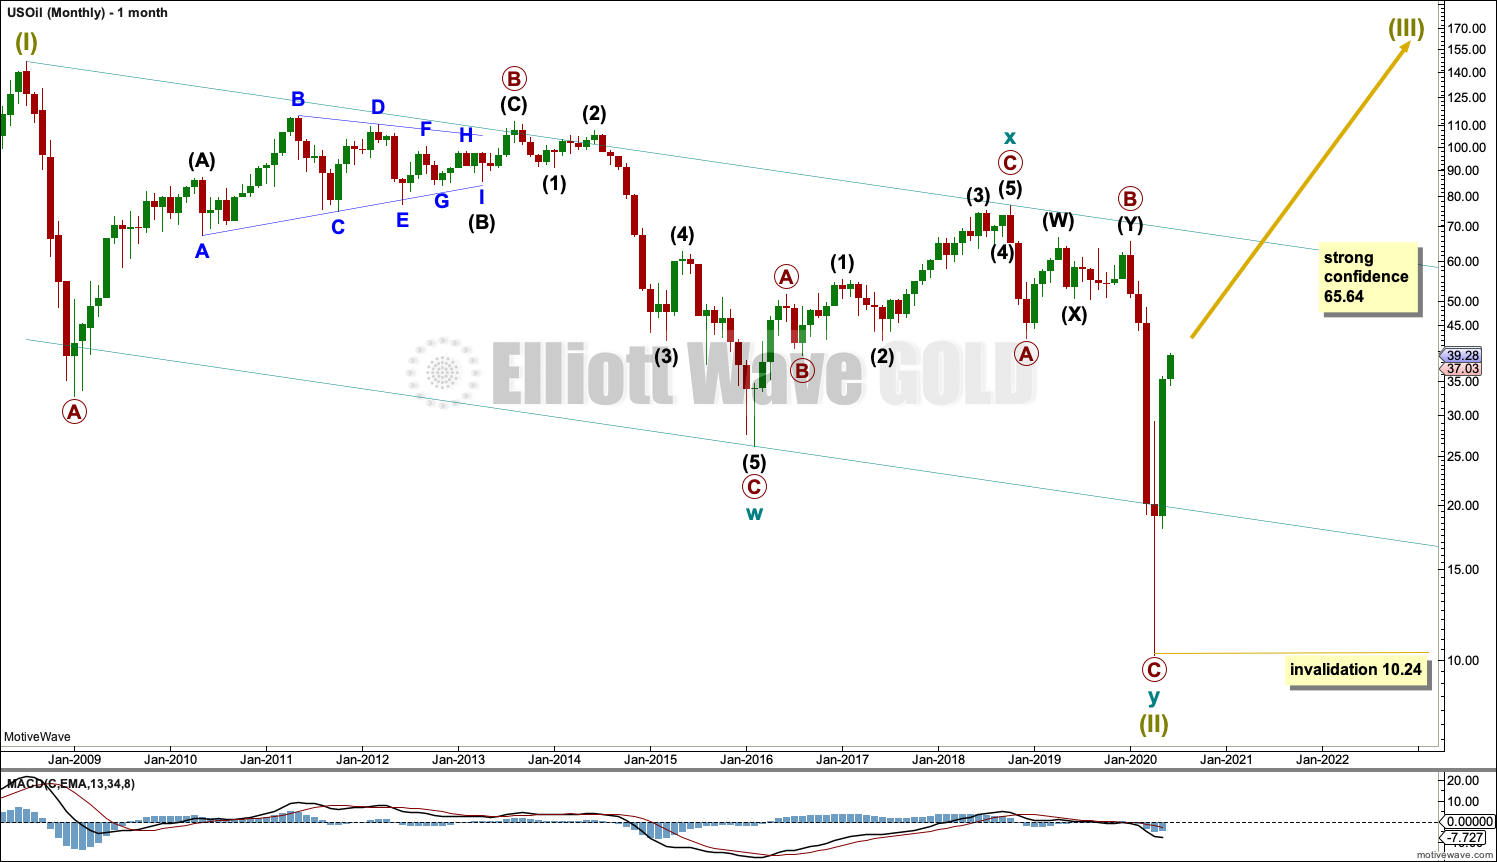
The basic Elliott wave structure is five steps forward and three steps back. This Elliott wave count expects that US Oil has completed a three steps back pattern, which began in July 2008. The Elliott wave count expects that the bear market for US Oil may now be over.
A channel is drawn about Super Cycle wave (II): draw the first trend line from the start of cycle wave w to the end of cycle wave x, then place a parallel copy on the end of cycle wave w. Price has bounced up off the channel. This trend line is breached, which is a typical look for the end of a movement for a commodity.
The upper edge of the channel may provide resistance.
Following five waves up and three steps back should be another five steps up; this is labelled Super Cycle wave (III), which may only have just begun. Super Cycle wave (III) may last a generation and must make a new high above the end of Super Cycle wave (I) at 146.73.
Super Cycle wave (III) may only subdivide as a five wave impulse. New trends for Oil usually start out very slowly with short first waves and deep time consuming second wave corrections. Basing action over a few years may now have begun.
WEEKLY CHART
Click chart to enlarge.
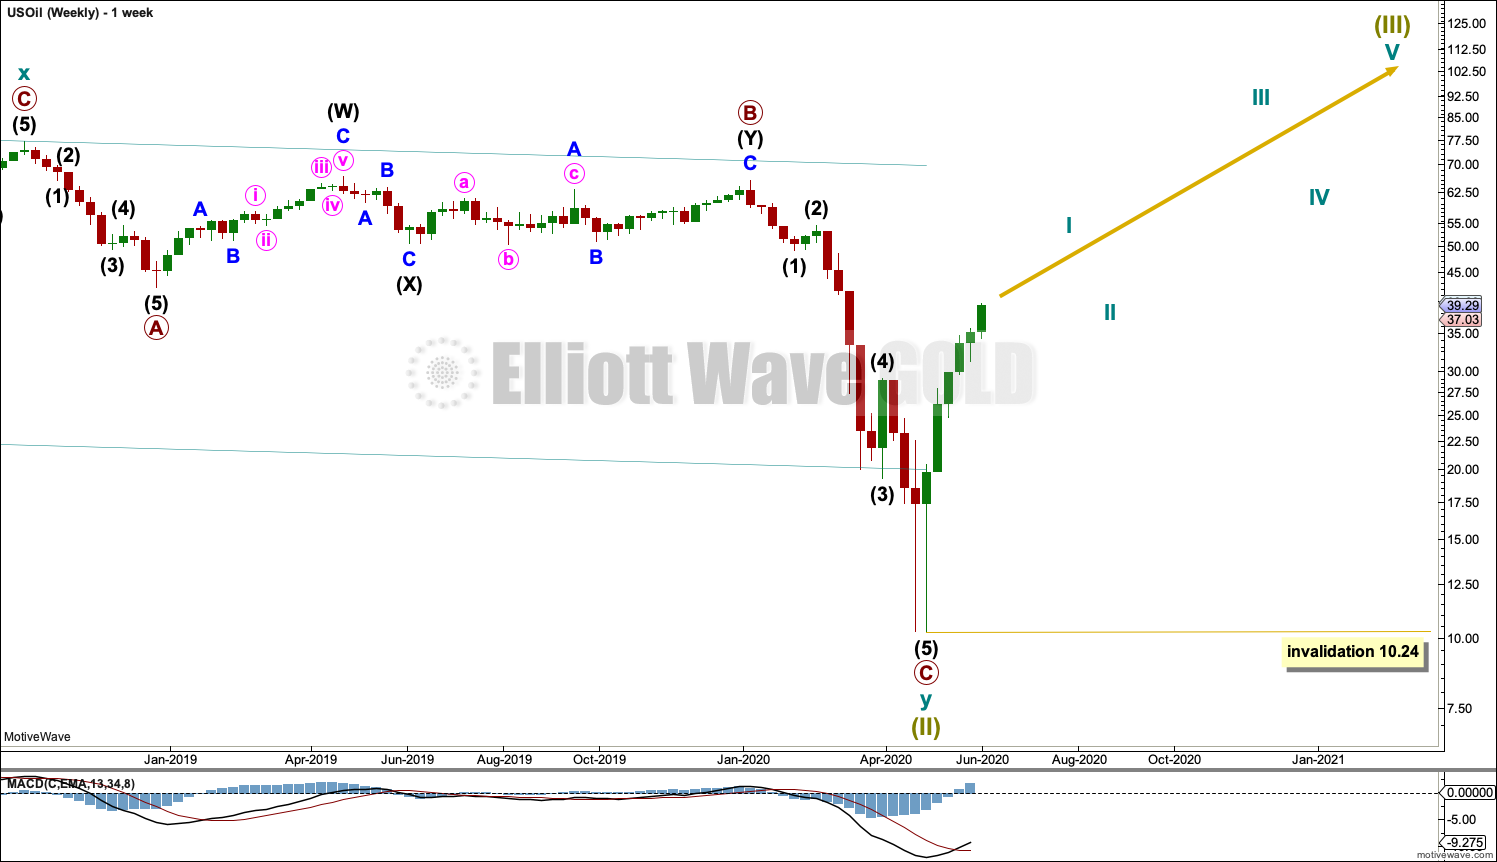
Super Cycle wave (III) must subdivide as an impulse. Cycle wave I within the impulse may now be unfolding higher and may now be very close to an end. Cycle wave II may not move beyond the start of cycle wave I below 10.24.
DAILY CHART
Click chart to enlarge.
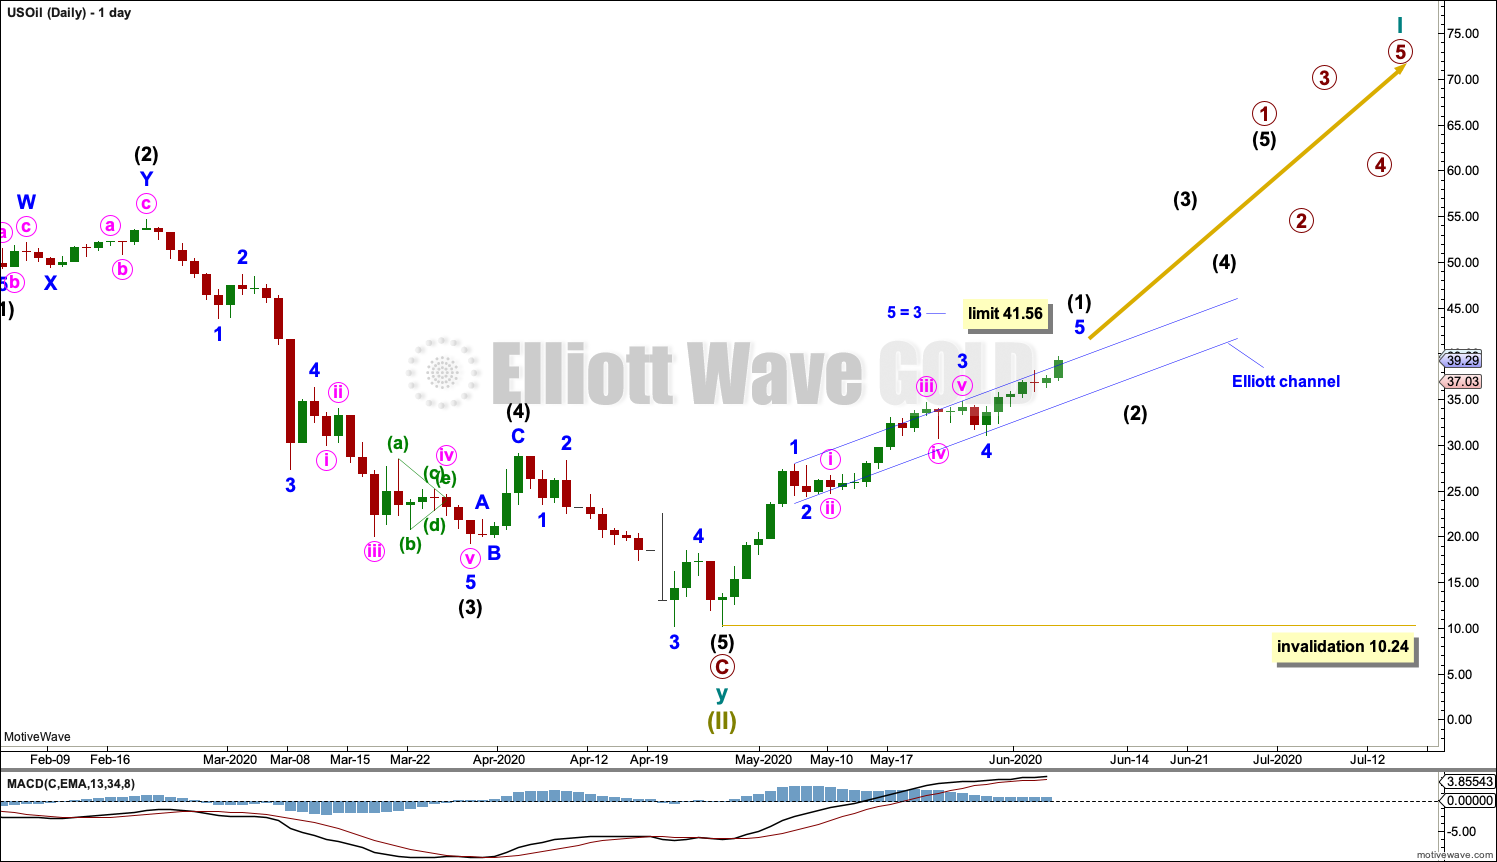
Labels are added for cycle wave I. Although the numbers are placed along the direction arrow, this does not mean that it is expected that Super Cycle wave (III) will move in a straight line. Markets do not move in straight lines; there are counter trend movements along the way.
Intermediate wave (2) and primary wave 2 within cycle wave I may be deep and time consuming. It is normal for Oil for counter trend movements early on in a new developing trend to be deep and time consuming as price forms basing action. This may take several months to possibly even years for Oil.
A small channel is drawn about intermediate wave (1). Assume intermediate wave (1) is continuing while price remains within or above this channel. If the channel is breached by downwards movement, then that may be taken as an early indication that intermediate wave (1) may be over and intermediate wave (2) may have begun. A breach may be defined by a full daily candlestick below and not touching the lower edge of the channel.
If minor degree labels within intermediate wave (1) are correct, then minor wave 3 is shorter than minor wave 1. Because minor wave 3 may not be the shortest actionary wave within intermediate wave (1), minor wave 5 is limited to no longer than equality in length with minor wave 3 at 41.56. A trend change may occur before this limit.
If the limit at 41.56 is reached and price continues higher, then the alternate daily chart below would be used.
Intermediate wave (2) may not move beyond the start of intermediate wave (1) below 10.24. Intermediate wave (2) may be reasonably expected to be very deep and last at least five weeks.
ALTERNATE DAILY CHART
Click chart to enlarge.
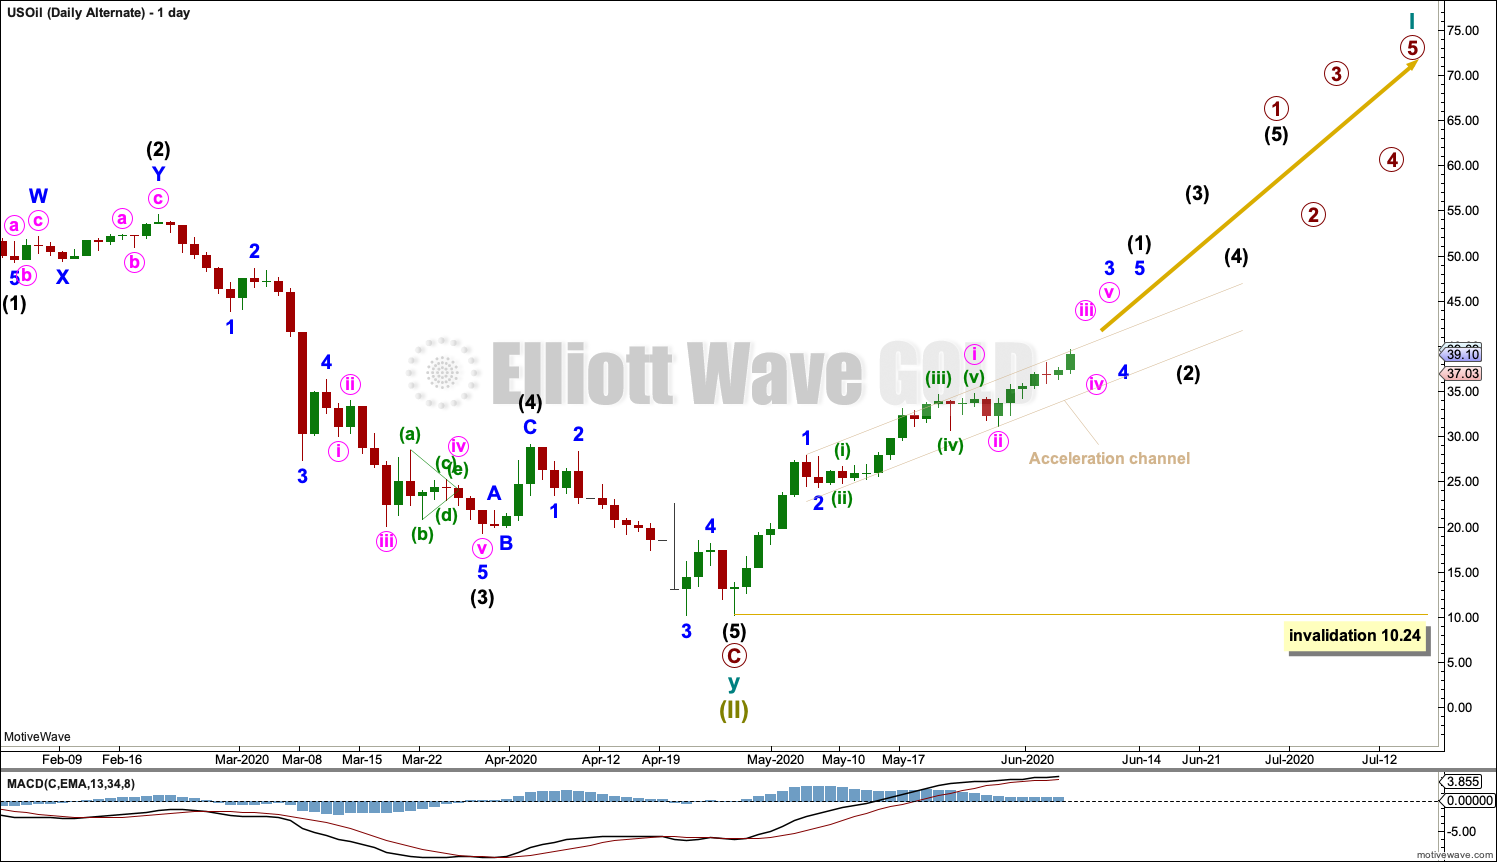
This wave count is the same as the first daily chart with the exception of the degree of labelling within minor wave 3. This alternate wave count moves the degree of labelling within minor wave 3 down one degree.
Minor wave 3 may be an incomplete impulse.
Draw an acceleration channel about upwards movement as shown. Keep redrawing the channel as price continues higher. Assume the upwards trend remains while price remains within or above this channel.
Intermediate wave (2) may not move beyond the start of intermediate wave (1) below 10.24. Intermediate wave (2) may be reasonably expected to be very deep and last at least five weeks.
TECHNICAL ANALYSIS
WEEKLY CHART
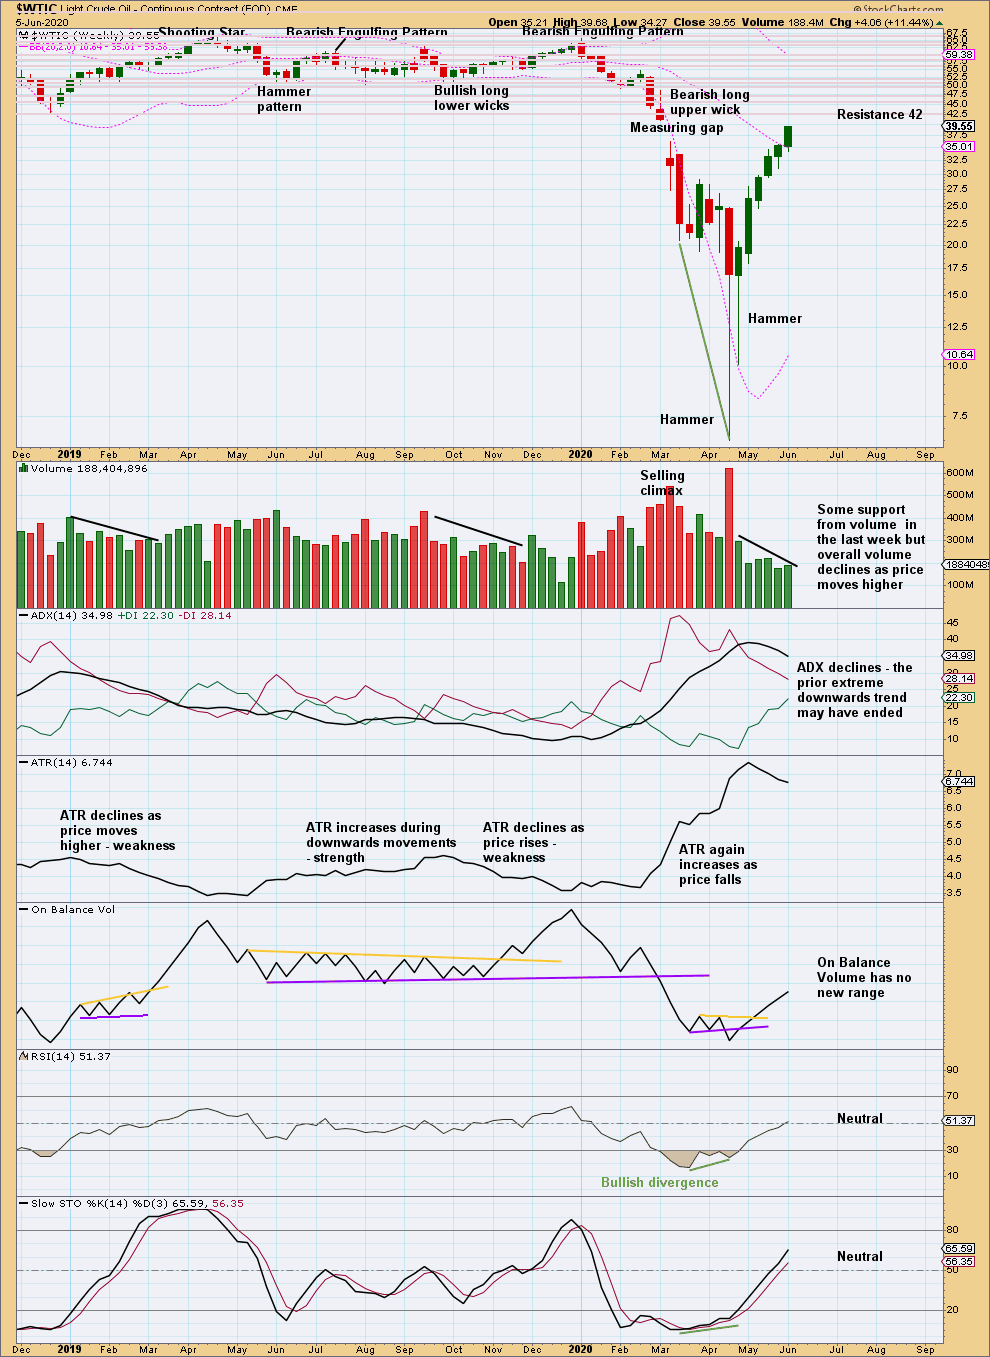
Click chart to enlarge. Chart courtesy of StockCharts.com.
Price is continuing higher despite declining range and volume; declining volume and range indicate this upwards movement is at risk of a pullback. However, a close this week very near highs for the week suggest more upwards movement immediately ahead.
DAILY CHART
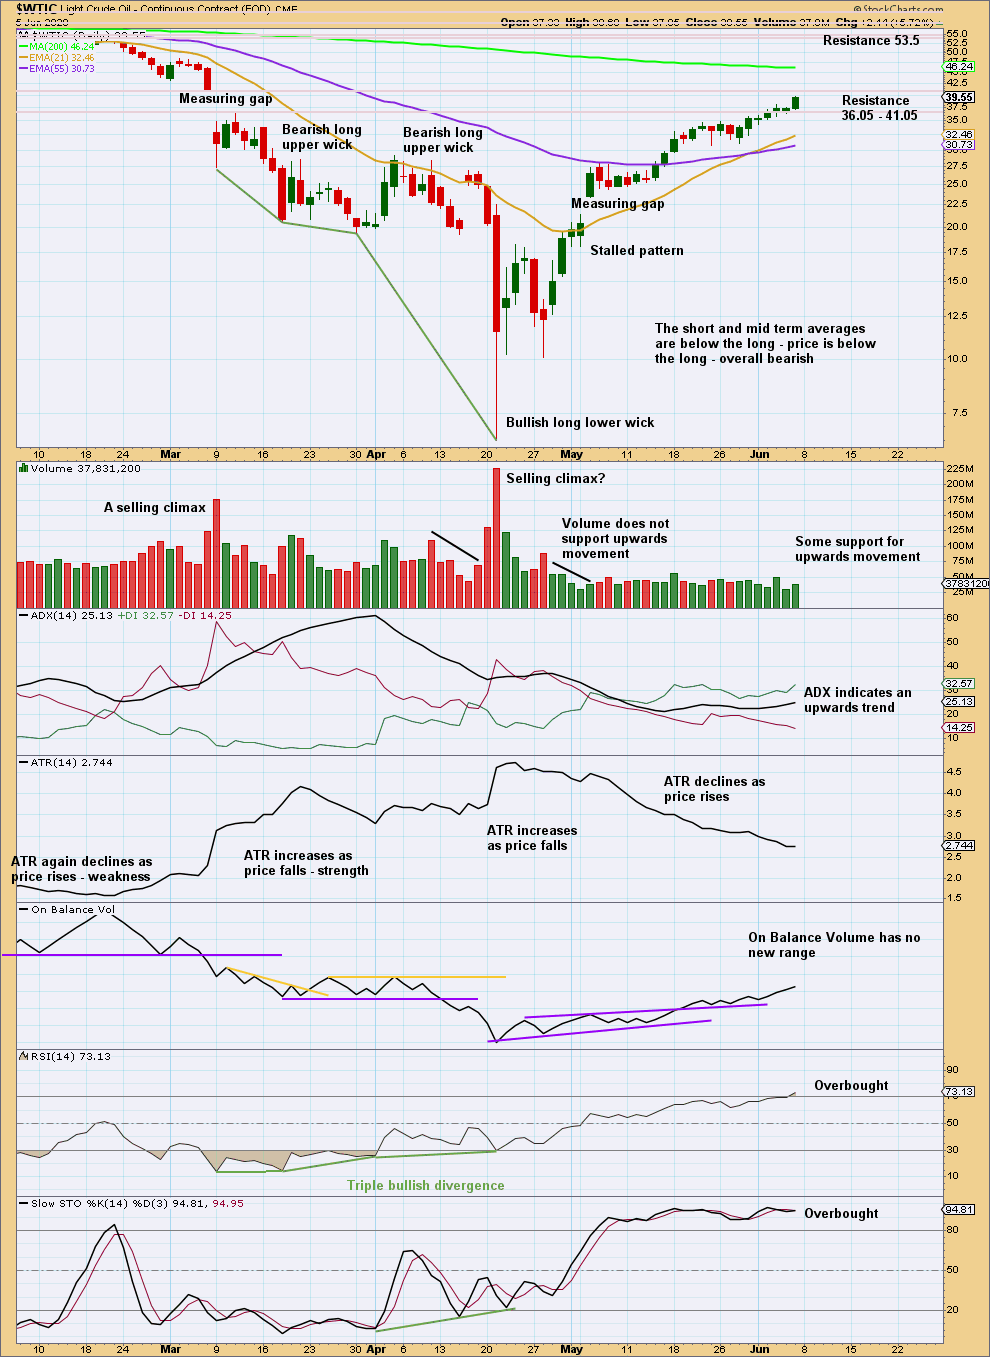
Click chart to enlarge. Chart courtesy of StockCharts.com.
Price approaches strong resistance. RSI is now just overbought. There is still a little room for upwards movement to continue.
Published @ 05:10 p.m. EST.
—
Careful risk management protects your trading account(s).
Follow my two Golden Rules:
1. Always trade with stops.
2. Risk only 1-5% of equity on any one trade.
—
New updates to this analysis are in bold.