
GOLD: Elliott Wave and Technical Analysis | Charts – July 31, 2020
The high remains in place although a short-term price point used for confidence has not been breached.
Summary: The target at 1,984 for a third wave to end may not be met. Intermediate wave (3) may be over. A new low below 1,911.71 is required for confidence in this view.
If price continues higher, then the first target would be at 1,984 and the next target would be at 2,175. The next longer-term target is at 2,306 or 2,250.
Grand SuperCycle analysis is here.
BEARISH ELLIOTT WAVE COUNT
MONTHLY CHART
Click chart to enlarge.
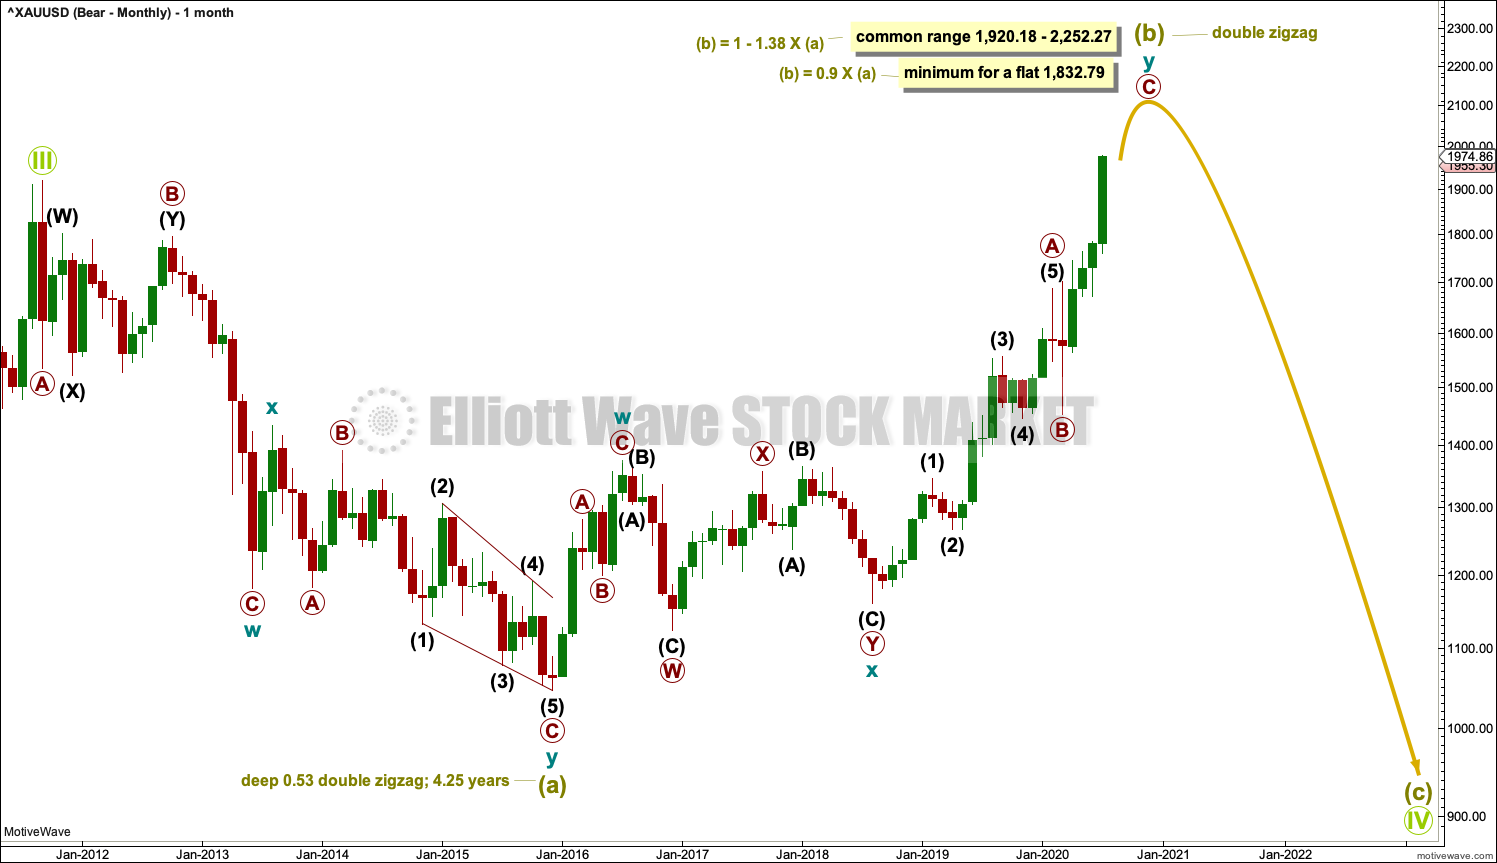
It is possible to see the large downwards wave labelled Super Cycle wave (a) subdividing as a double zigzag, which is a corrective structure.
If Super Cycle wave (a) has subdivided as a double zigzag, then Grand Super Cycle wave IV may be unfolding as a flat correction. A flat correction would require Super Cycle wave (b) to retrace a minimum 0.9 length of Super Cycle wave (a) at 1,832.79. This minimum has now been met.
A flat correction for Grand Super Cycle wave IV may see Super Cycle wave (b) make a new high above the start of Super Cycle wave (a) at 1,920.18 as in an expanded flat. Expanded flat corrections are fairly common Elliott wave corrective structures, particularly in fourth wave positions. The common range for Super Cycle wave (b) within a flat correction would be from 1 to 1.38 times the length of Super Cycle wave (a) from 1,920.18 to 2,252.27.
There is no Elliott wave rule stating a limit for Super Cycle wave (b) within a flat correction, so there is no rule to apply to determine an upper invalidation point for this wave count.
WEEKLY CHART
Click chart to enlarge.
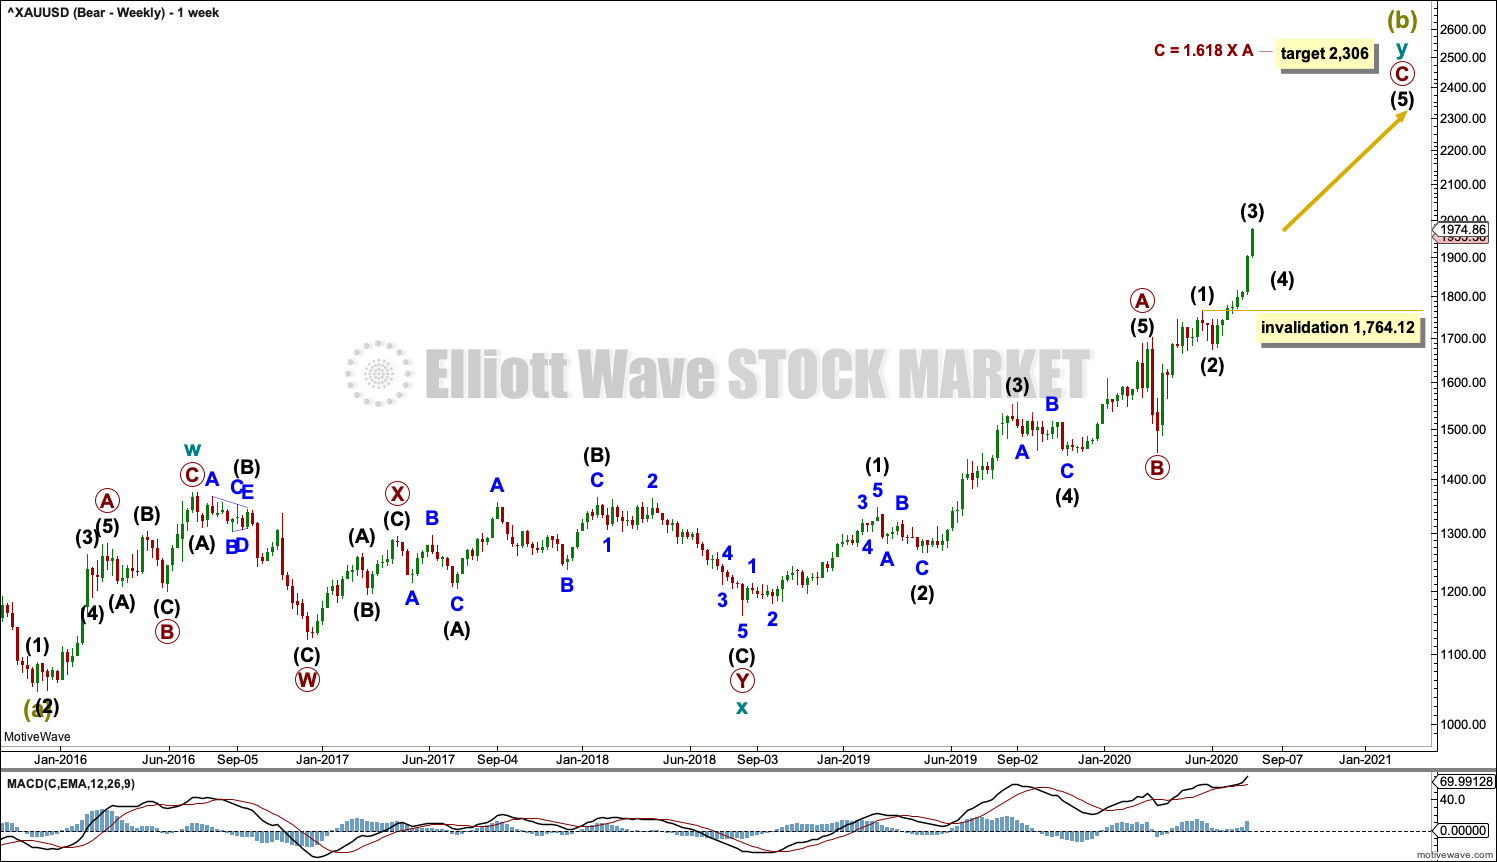
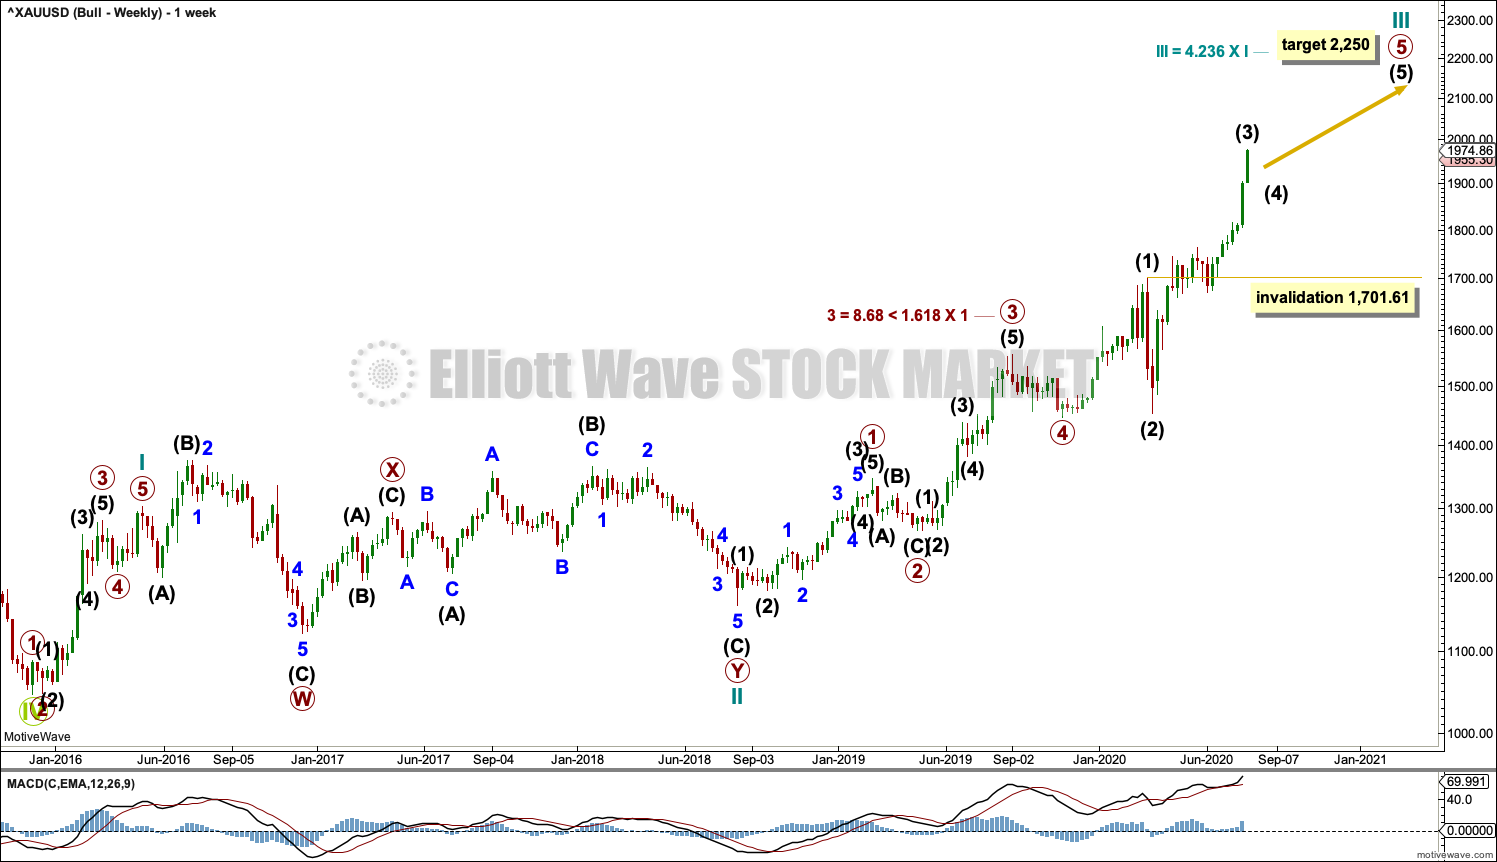
The bigger picture for this main bearish Elliott wave count sees Gold as still within a bear market, in a three steps back pattern that is labelled Grand Super Cycle wave IV on monthly charts.
Super Cycle wave (b) within Grand Super Cycle wave IV may be an incomplete double zigzag. When Super Cycle wave (b) may be complete, then this wave count expects Super Cycle wave (c) to begin and to move price below the end of Super Cycle wave (a) at 1,046.27.
The first zigzag in the double is labelled cycle wave w. The double is joined by a three in the opposite direction, a combination labelled cycle wave x. The second zigzag in the double is labelled cycle wave y.
The purpose of the second zigzag in a double is to deepen the correction. Cycle wave y has achieved this purpose.
Primary wave C within cycle wave y may be subdividing as an impulse. Intermediate waves (1) through to (3) within primary wave C may be complete. Intermediate wave (4) may not move into intermediate wave (1) price territory below 1,764.12.
We should always assume the trend remains the same until proven otherwise. At this stage, Gold is in a bull market for the mid term.
DAILY CHART
Click chart to enlarge.
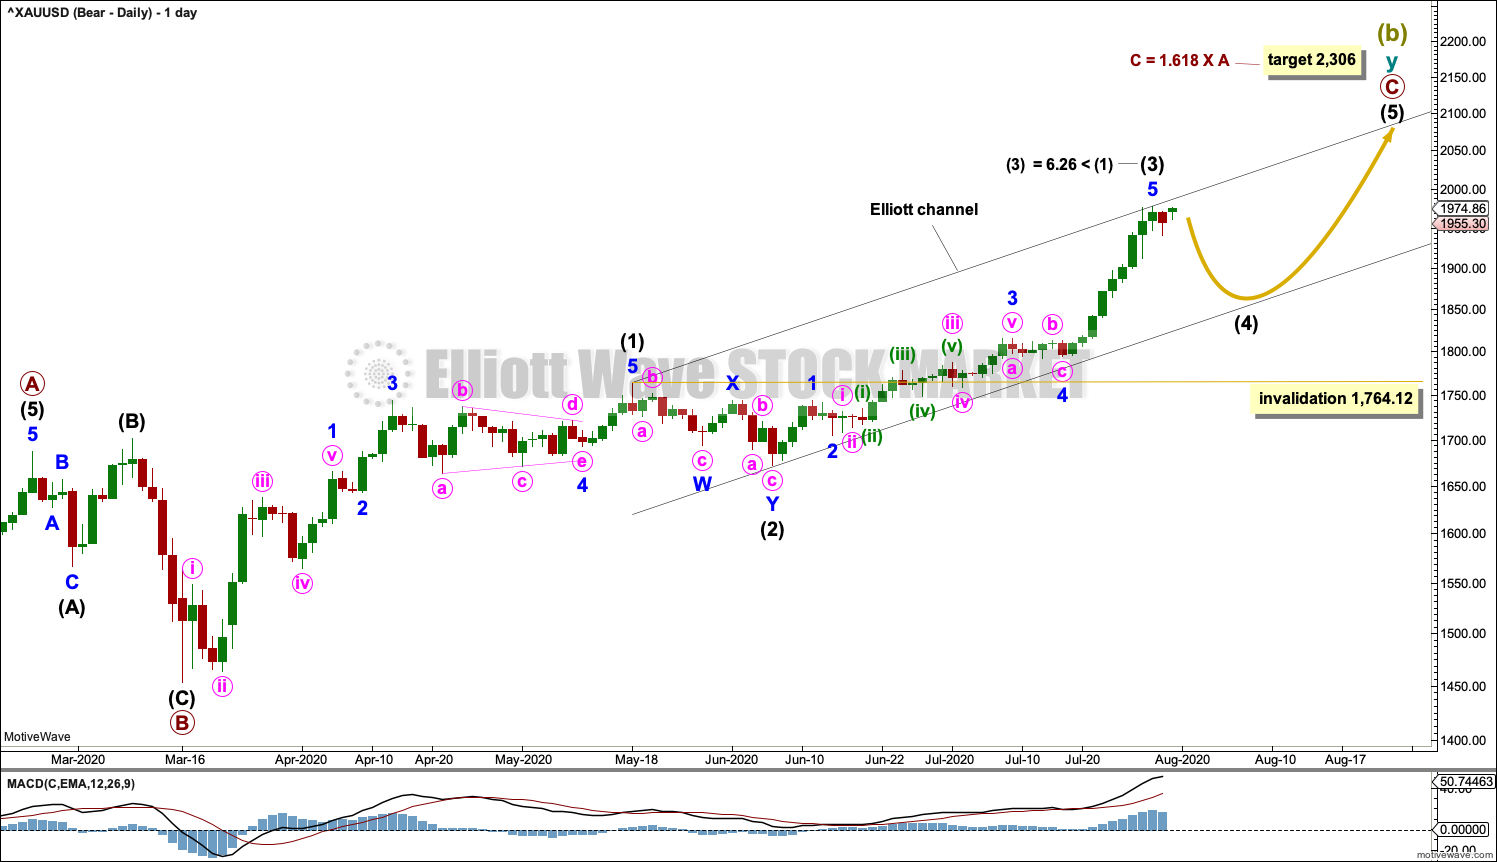
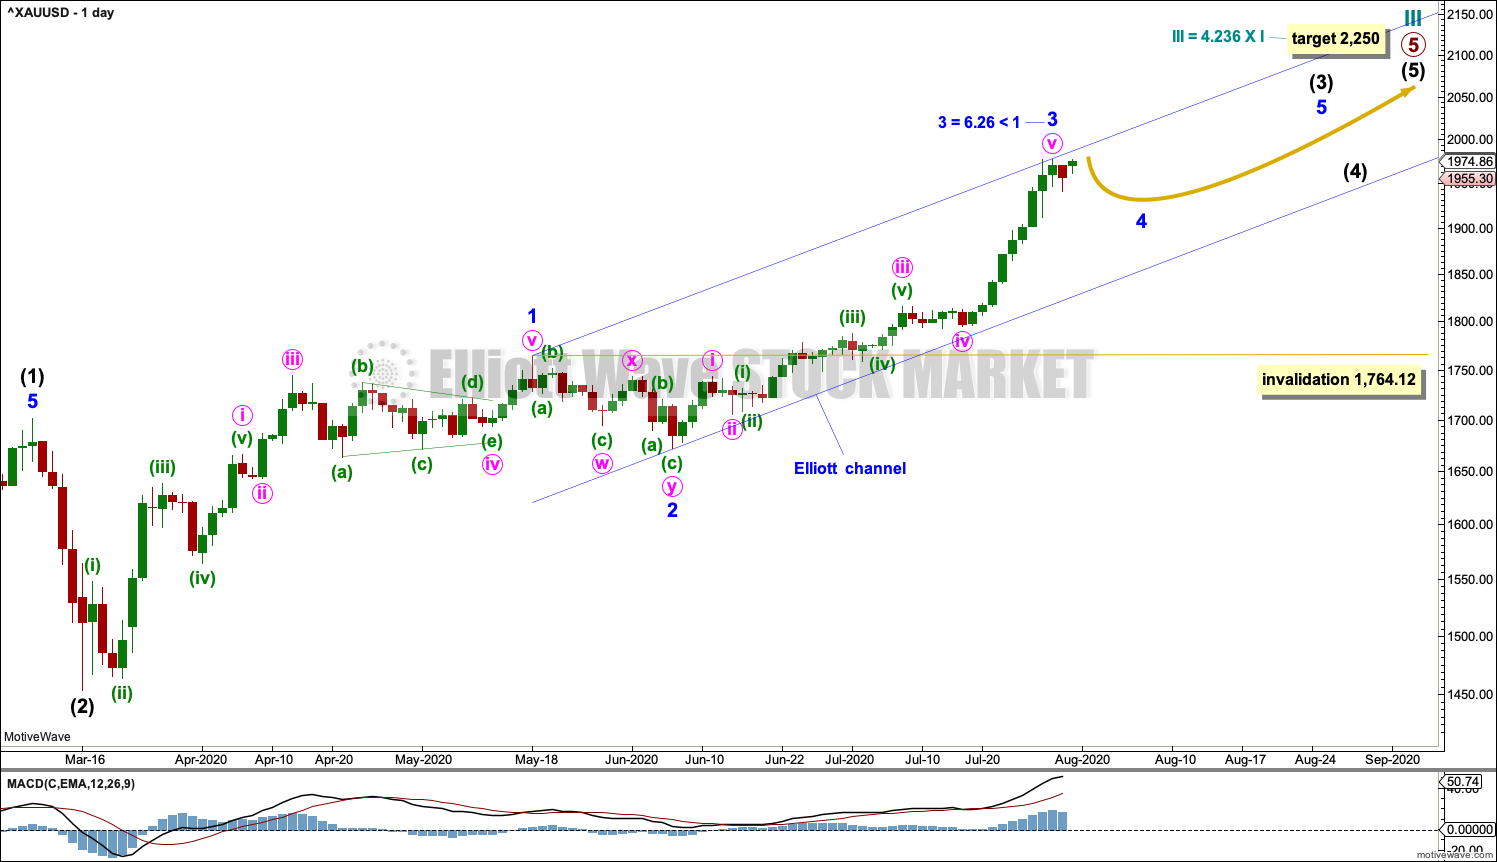
The daily chart shows detail of primary wave C as an incomplete impulse.
Intermediate waves (1) through to (3) within primary wave C may be complete.
Intermediate wave (4) may not move into intermediate wave (1) price territory below 1,764.12.
Draw the channel now using Elliott’s first technique: draw a first trend line from the ends of intermediate waves (1) to (3), then place a parallel copy on the end of intermediate wave (2). Intermediate wave (4) may find support about the lower edge.
If price keeps rising next week, then at 1,984 intermediate wave (3) would reach equality in length with intermediate wave (1).
If price reaches the first target and either the structure is incomplete or price keeps rising through it, then the second higher target at 2,175 would be used, which is where intermediate wave (3) would reach 1.618 the length of intermediate wave (1).
HOURLY CHART
Click chart to enlarge.
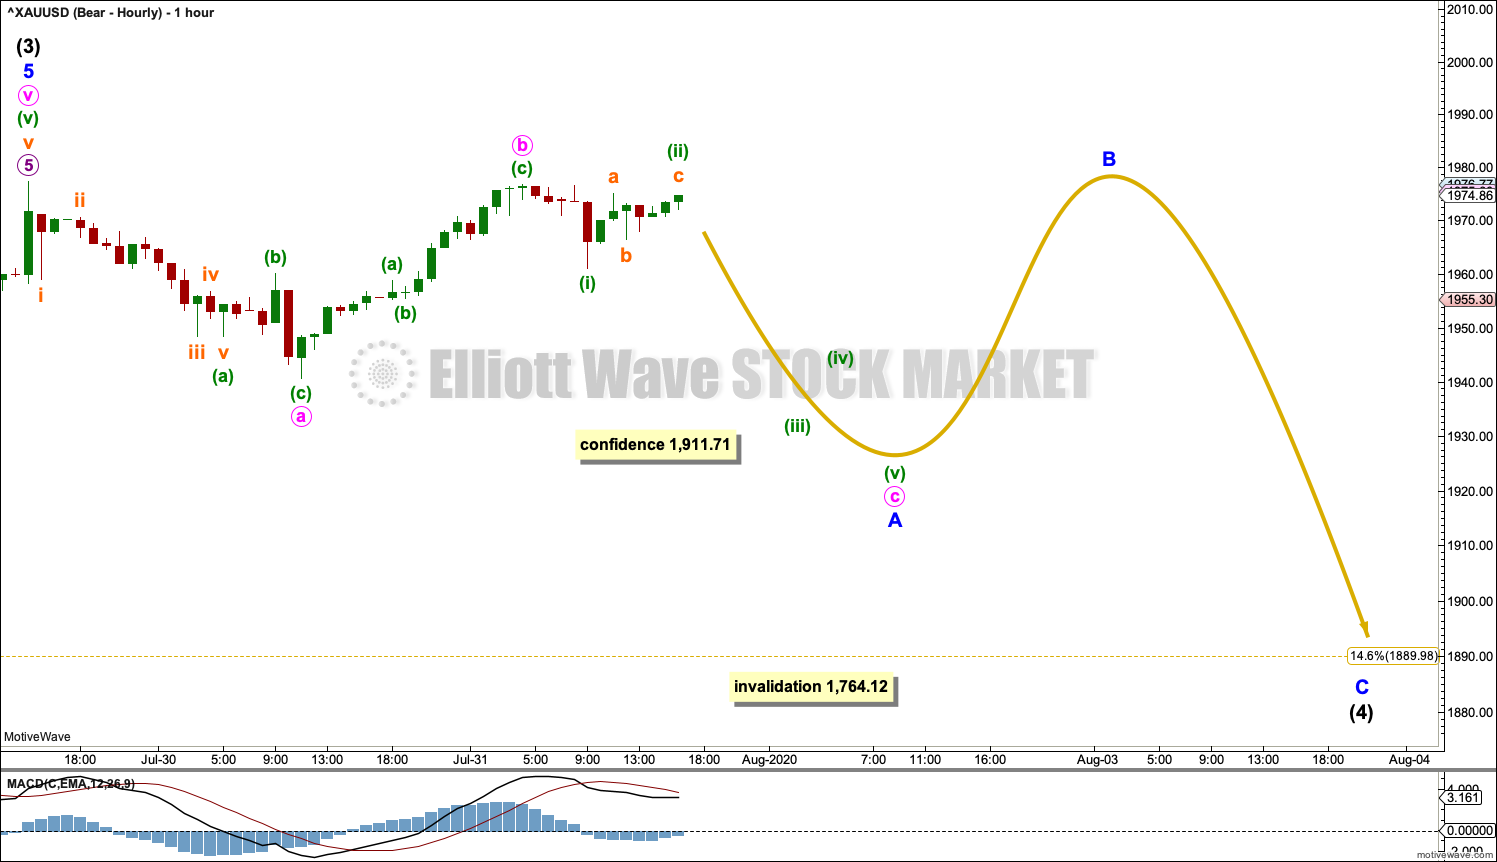
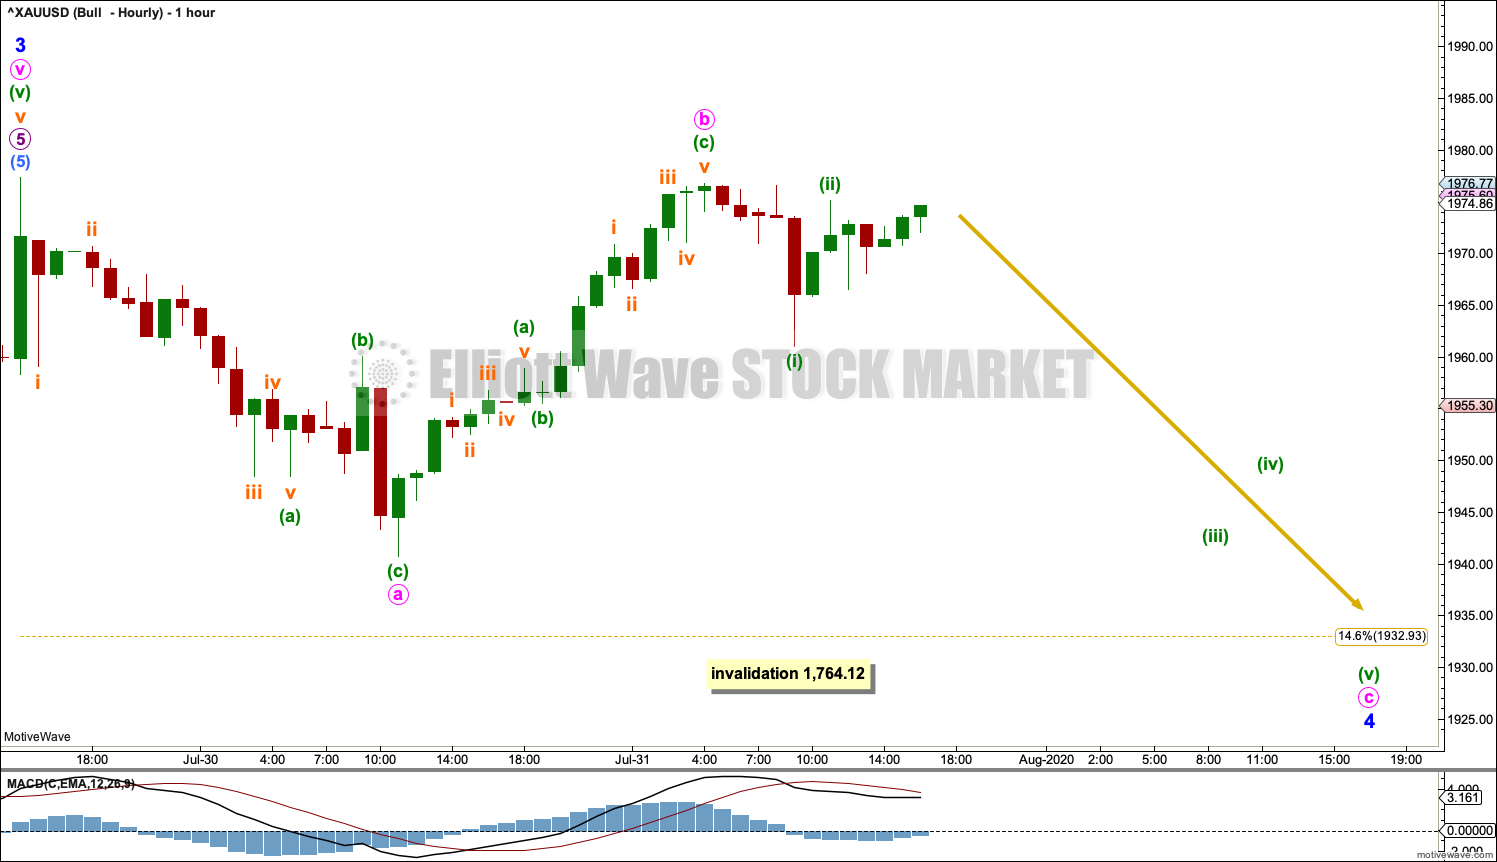
Intermediate wave (2) subdivided as a double zigzag, lasting 14 sessions. Intermediate wave (4) may exhibit alternation as any one of a combination, flat or triangle. It may be over more quickly than 14 sessions; it may be over within two weeks.
Intermediate wave (4) (within all of a combination, flat or triangle) may see minor wave B or X move beyond the start of minor wave A or W at 1,977.40. There is no short-term upper invalidation point for this reason. A new high above 1,977.40 may still be part of intermediate wave (4) and does not necessarily mean that intermediate wave (3) must be continuing higher.
Focus over the next two weeks should not be on identifying which structure intermediate wave (4) may be unfolding as, but on identifying when a corrective structure may be complete and an upwards breakout may then be expected. As intermediate wave (4) unfolds the labelling within it will very likely change and alternate short-term hourly wave counts may be required to consider different structures.
ALTERNATE BULLISH ELLIOTT WAVE COUNT
MONTHLY CHART

Click chart to enlarge.
This wave count sees the large downwards wave from September 2011 to December 2015 as having the same subdivisions as the prior chart above, a double zigzag, but it moves the degree of labelling within the double zigzag up one degree.
It is possible that the bear market for Gold was over at the low in December 2015 as a double zigzag. This would see Grand Super Cycle wave IV lasting only 4.25 years, where Grand Super Cycle waves may be normally expected to last at least a decade and possibly longer. The brevity of a Grand Super Cycle wave reduces the probability of this wave count.
If the bear market was over in December 2015, then a new bull market should have begun there. This is labelled Grand Super Cycle wave V.
Super Cycle wave (I) within Grand Super Cycle wave V would be incomplete and would be subdividing as a five wave impulse, the simplest Elliott wave structure. Cycle waves I and II within the impulse would now be complete. Cycle wave IV may not move into cycle wave I price territory below 1,303.51.
WEEKLY CHART
Click chart to enlarge.
This wave count sees the the bear market complete at the last major low for Gold on 3 December 2015.
If Gold is in a new bull market, then it should begin with a five wave structure upwards on the weekly chart.
Cycle wave I fits as a five wave impulse with reasonably proportionate corrections for primary waves 2 and 4.
Cycle wave II fits as a double flat. However, within the first flat correction labelled primary wave W, this wave count needs to ignore what looks like an obvious triangle from July to September 2016 (this can be seen labelled as a triangle on the bear wave count above). This movement must be labelled as a series of overlapping first and second waves. Ignoring this triangle reduces the probability of this wave count in Elliott wave terms.
Within the first flat correction labelled primary wave W of the double flat of cycle wave II, intermediate wave (B) is 1.69 the length of intermediate wave (A). This is longer than the common range of up to 1.38, but within an allowable guideline of up to 2. The length of intermediate wave (B) reduces the probability of this wave count.
Cycle wave III may be incomplete. Cycle wave IV may not move into cycle wave I price territory below 1,303.51.
DAILY CHART
Click chart to enlarge.
Cycle wave III may be continuing higher. The daily chart focusses on the end of primary wave 5 within cycle wave III.
Draw a channel about intermediate wave (3) using Elliott’s first technique: draw the first trend line from the ends of minor waves 1 to 3, then place a parallel copy on the end of minor wave 2. Minor wave 4 may find support about the lower edge of the channel.
Minor wave 4 may not move into minor wave 1 price territory below 1,764.12.
HOURLY CHART
Click chart to enlarge.
Minor wave 2 subdivided as a double zigzag lasting 14 sessions. The guideline of alternation expects minor wave 4 to most likely subdivide as a flat, combination or triangle. Minor wave 4 may not be as long lasting as minor wave 2, as for Gold fourth waves tend to be quicker than counterpart second waves.
Minute wave b or x (within an expanded flat, running triangle or combination) may make a new price extreme beyond the start of minute wave a or w at 1,976.81. There is no upper short-term invalidation point for this reason.
TECHNICAL ANALYSIS
MONTHLY CHART
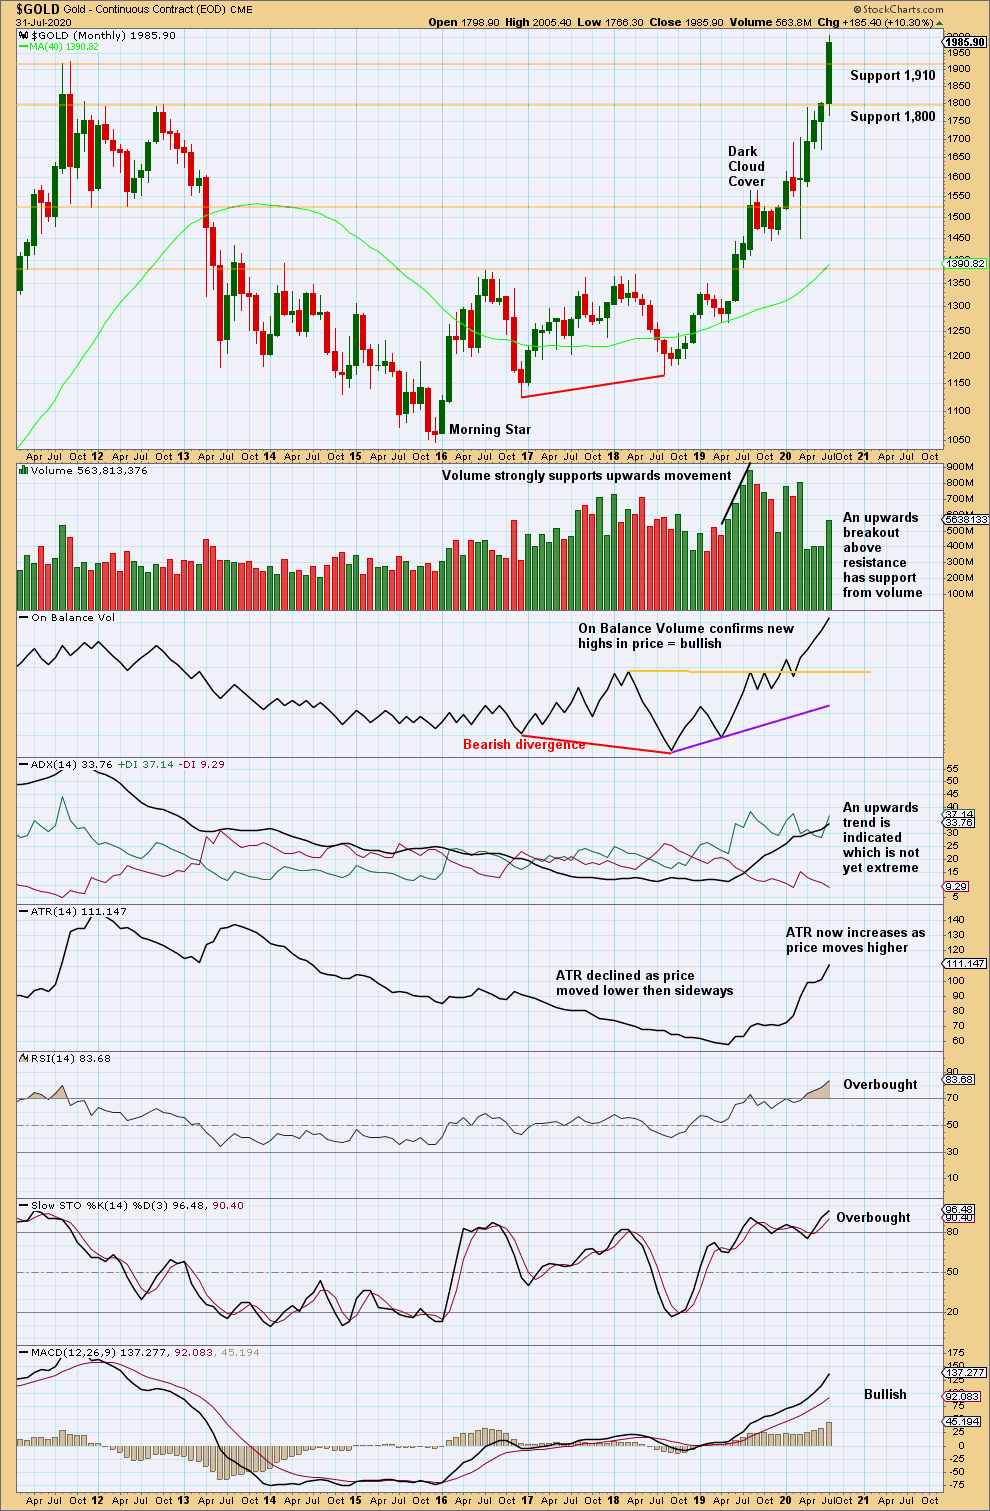
Click chart to enlarge. Chart courtesy of StockCharts.com.
This month effected an upwards breakout to new all time highs for Gold, with support from volume. ADX is now not extreme. RSI is overbought. Extreme conditions may persist when this market has a strong trend; this upwards trend may continue. Look for a bearish candlestick reversal pattern to signal a more time consuming consolidation or a trend change.
WEEKLY CHART
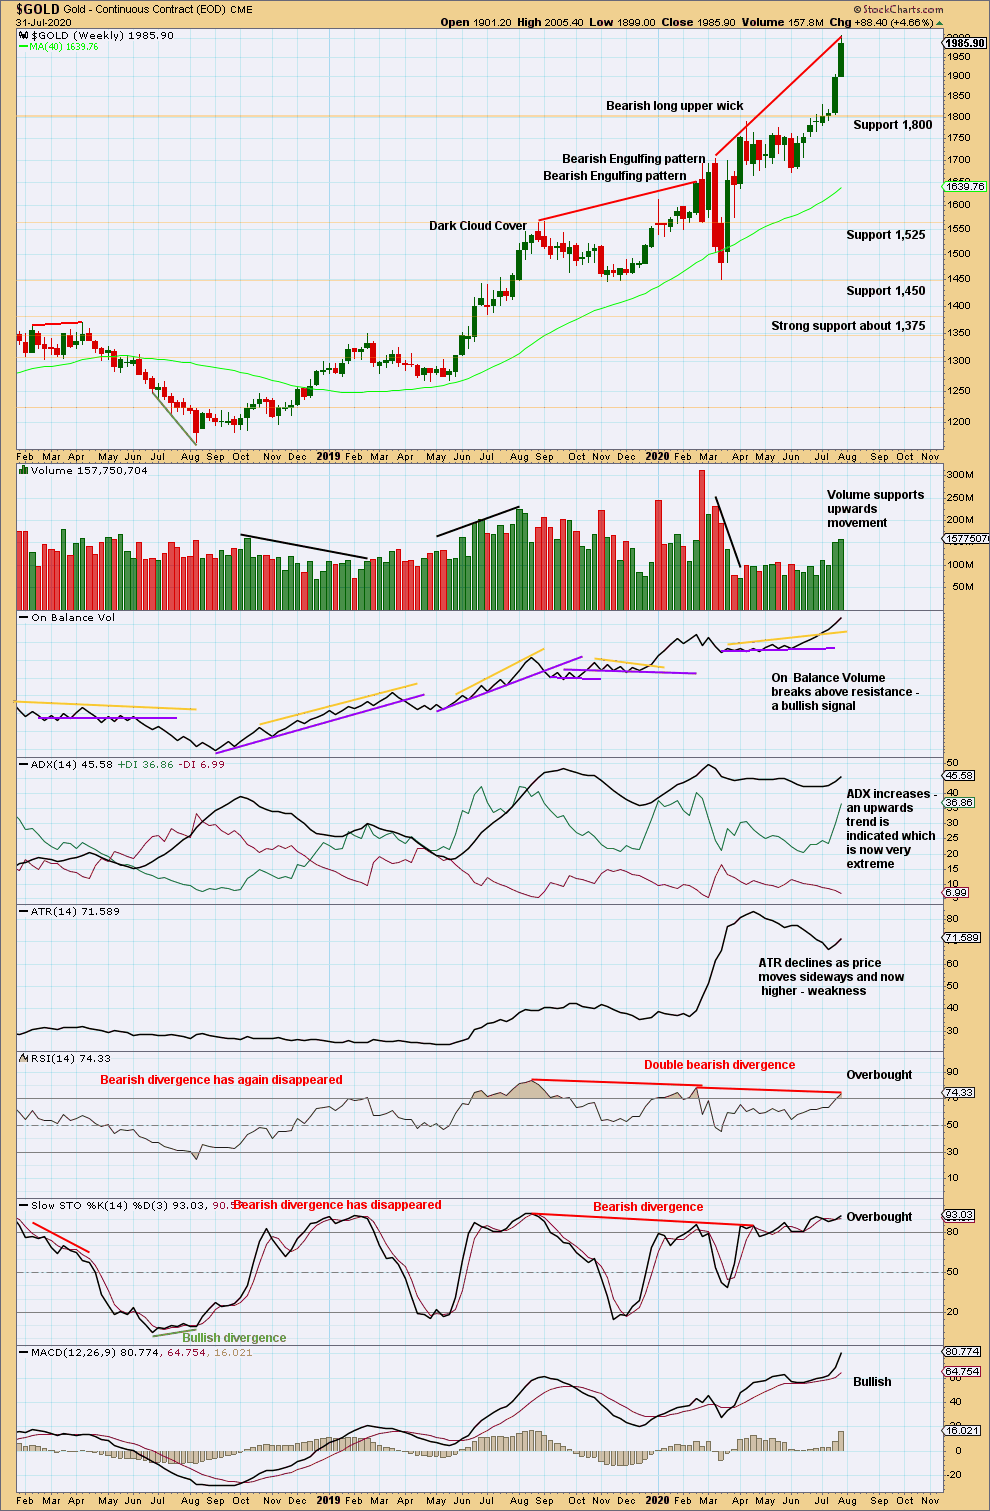
Click chart to enlarge. Chart courtesy of StockCharts.com.
The upwards trend at this time frame is now very extreme. RSI exhibits double bearish divergence with price (although this has weakened this week). The risk of a trend change or large consolidation here is increasing, but there is still no signal of a trend change.
DAILY CHART
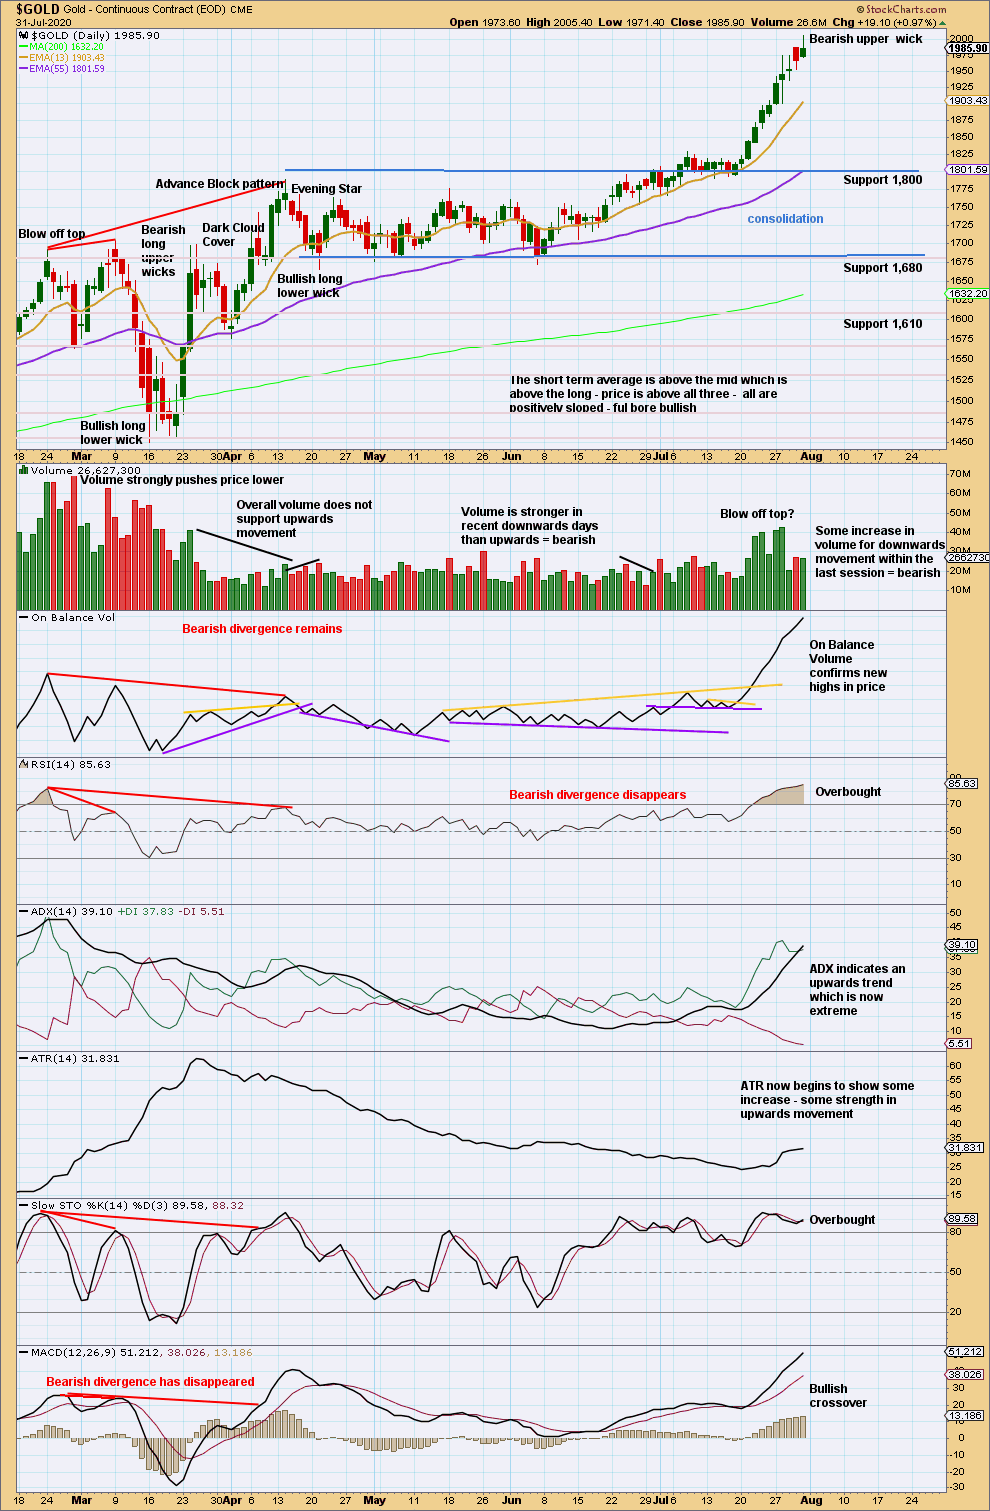
Click chart to enlarge. Chart courtesy of StockCharts.com.
The short-term picture indicates it is possible a high may be in place, at least for the short term. A consolidation may develop here to relieve extreme conditions. The red daily candlestick and now a long upper wick while RSI is deeply overbought and ADX is very extreme suggest the risk of a trend change is very high at this point.
GDX WEEKLY CHART
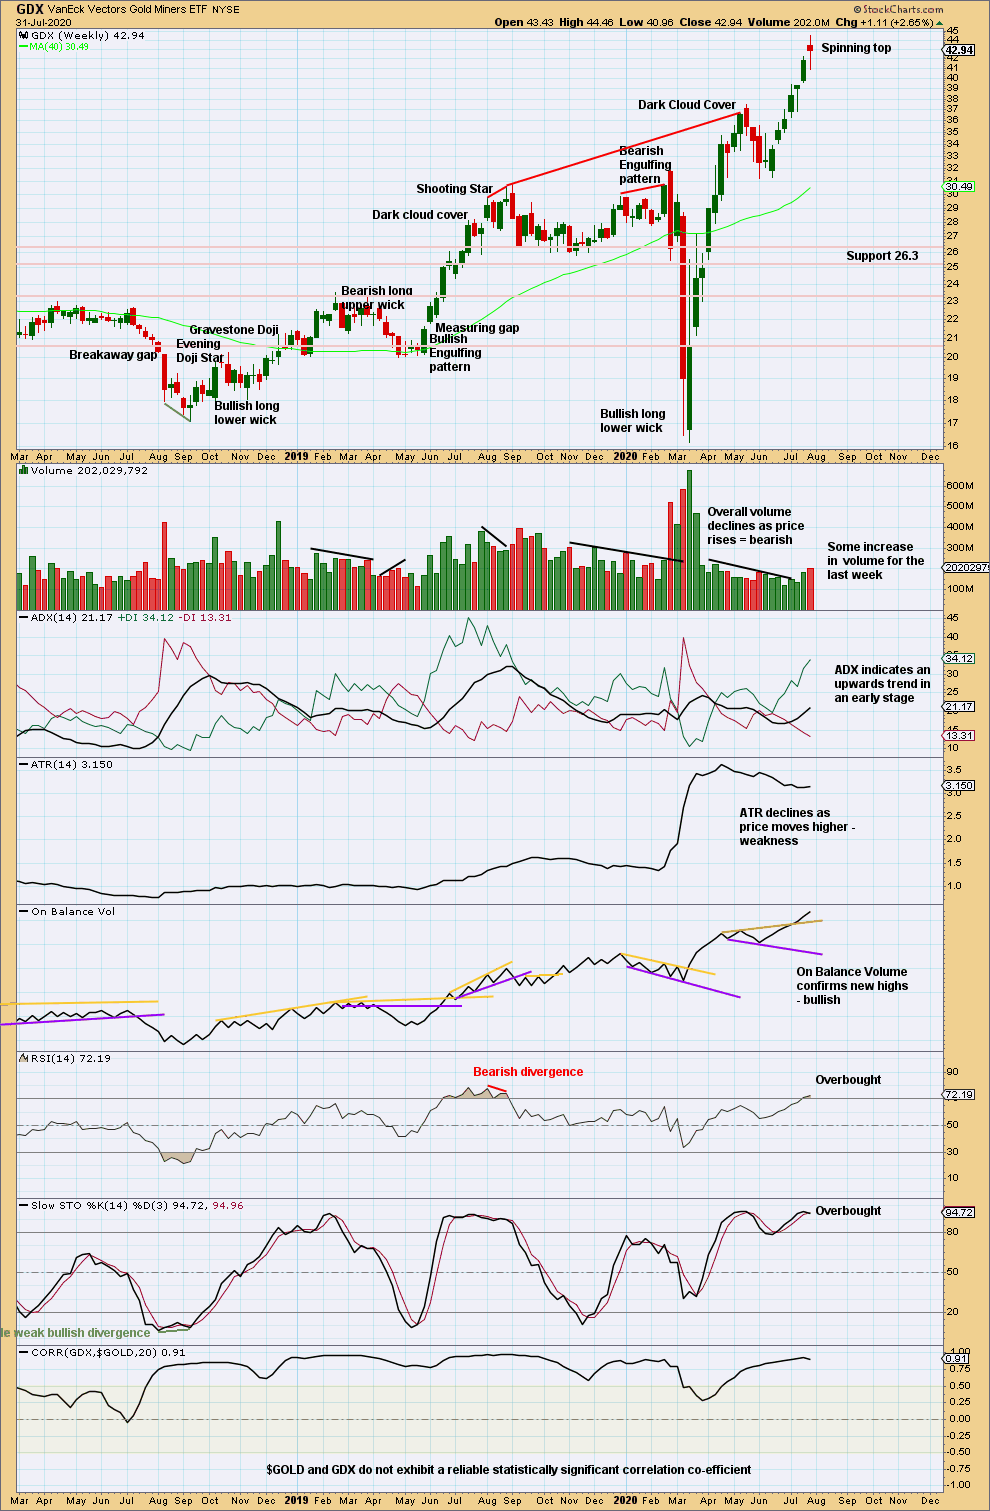
Click chart to enlarge. Chart courtesy of StockCharts.com.
A spinning top after a strong upwards trend indicates caution, but on its own it is not a reversal signal.
GDX DAILY CHART
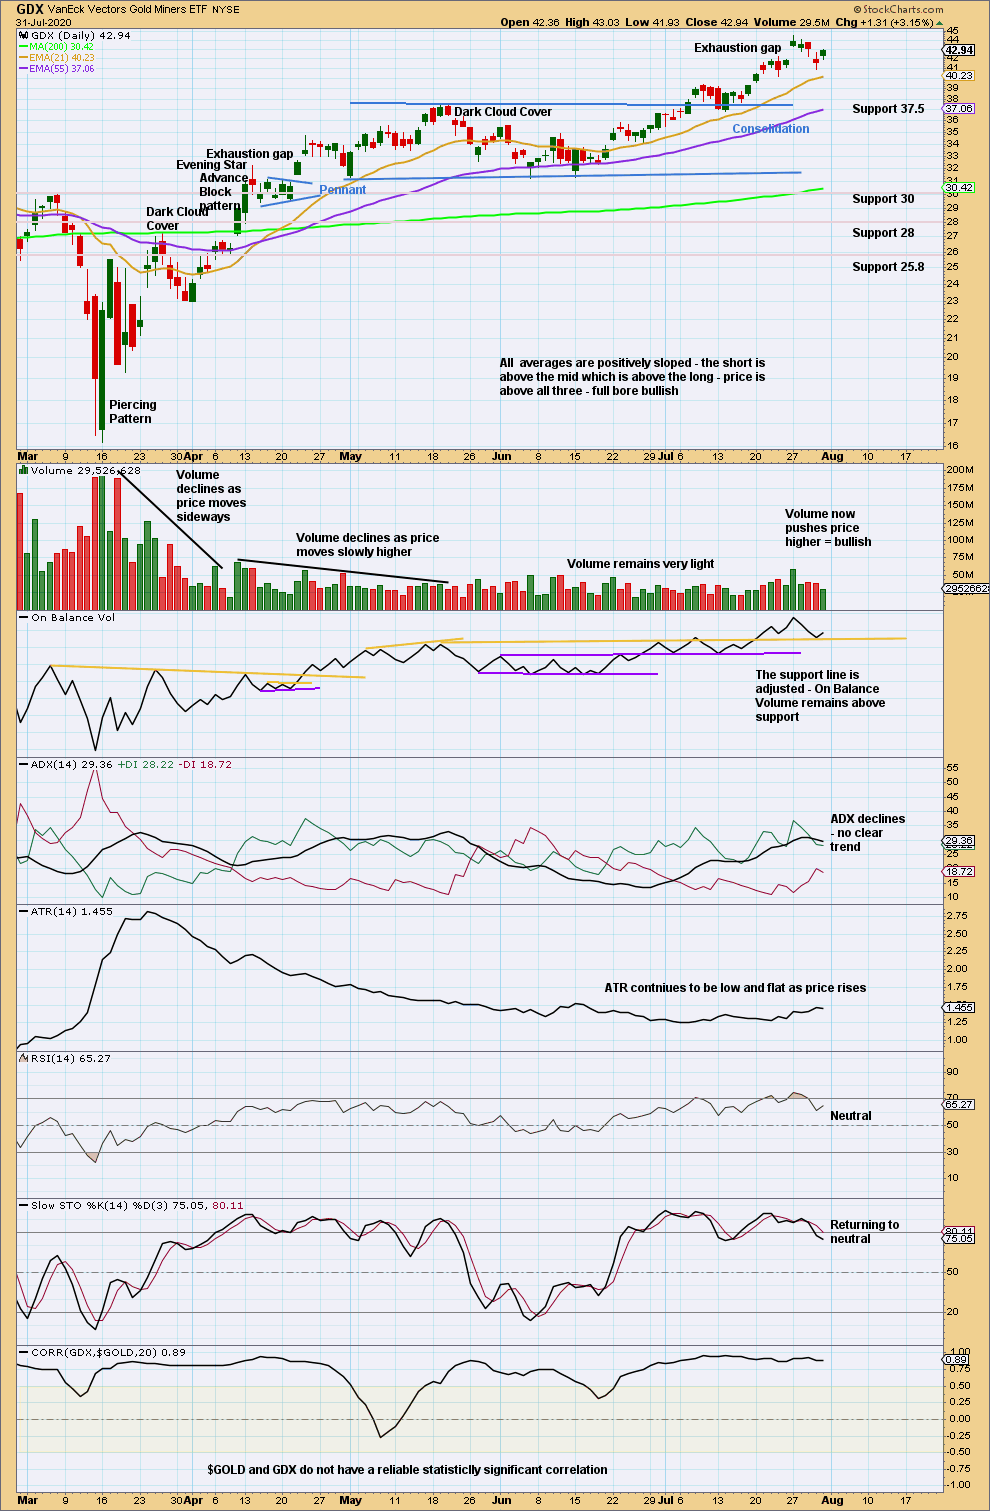
Click chart to enlarge. Chart courtesy of StockCharts.com.
A high may be in place. The last gap is now an exhaustion gap. Look for support about 37.5.
Published @ 08:34 p.m. ET.
—
Careful risk management protects your trading account(s).
Follow my two Golden Rules:
1. Always trade with stops.
2. Risk only 1-5% of equity on any one trade.
—
New updates to this analysis are in bold.