
SILVER: Elliott Wave and Technical Analysis | Charts – July 17, 2020
The Elliott wave target remains the same.
Summary: For the short to mid term, price may continue higher but should turn before 21.023. A possible target is 19.50. A classic analysis target is 20.90.
A new low now below 18.034 would indicate a trend change and a multi-week pullback. Prior to this a breach of the best fit channel on the daily chart would be an early warning.
The Elliott wave count is now very bullish and expects new highs substantially above 49.752 in coming years.
ELLIOTT WAVE COUNT
MONTHLY CHART
Click chart to enlarge.
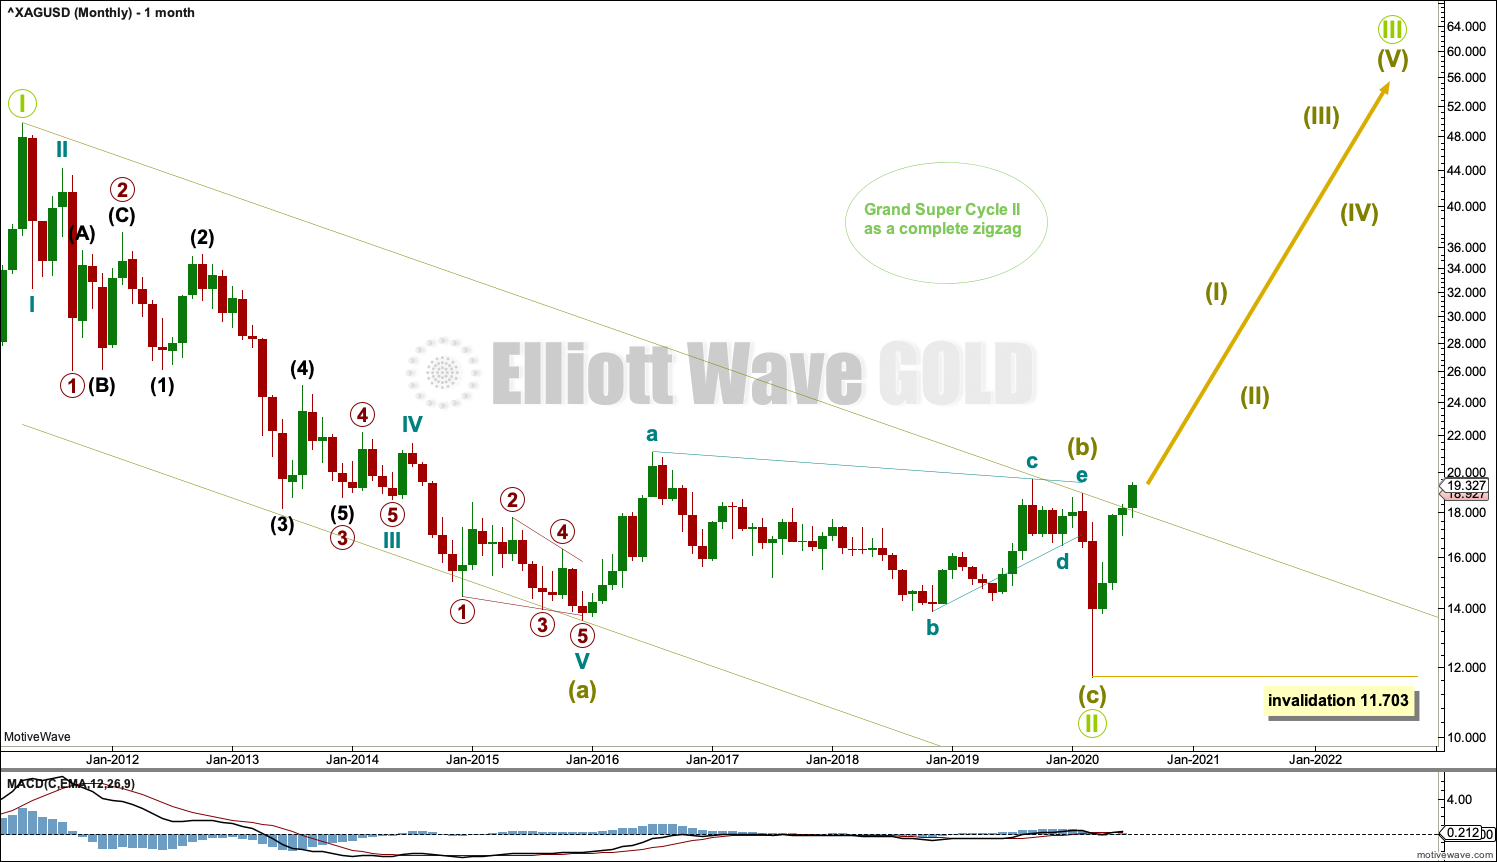
The bear market for Silver may be complete. A new high this week above 18.920 adds further confidence to this view.
This Elliott wave structure for this bear market is labelled as a single zigzag for Grand Super Cycle wave II. Single zigzags are the most common Elliott wave corrective structure.
Within the zigzag: Super Cycle wave (a) subdivides as a five wave impulse, Super Cycle wave (b) subdivides as a complete regular contracting triangle, and Super Cycle wave (c) subdivides as a complete five wave impulse that is relatively brief and shallow.
Draw a channel about the entire bear market of Grand Super Cycle wave II as shown. A breach of the upper edge of this channel would add confidence to this wave count. Price may have found resistance at the upper edge of this channel, which may have initiated a pullback.
When charts are drawn on a semi-log scale, price has now breached the upper edge of the trend channel. Copy this channel over to weekly and daily charts. The upper edge of this channel may now provide support.
Grand Super Cycle wave III must subdivide as a five wave impulse at Super Cycle degree.
WEEKLY CHART
Click chart to enlarge.
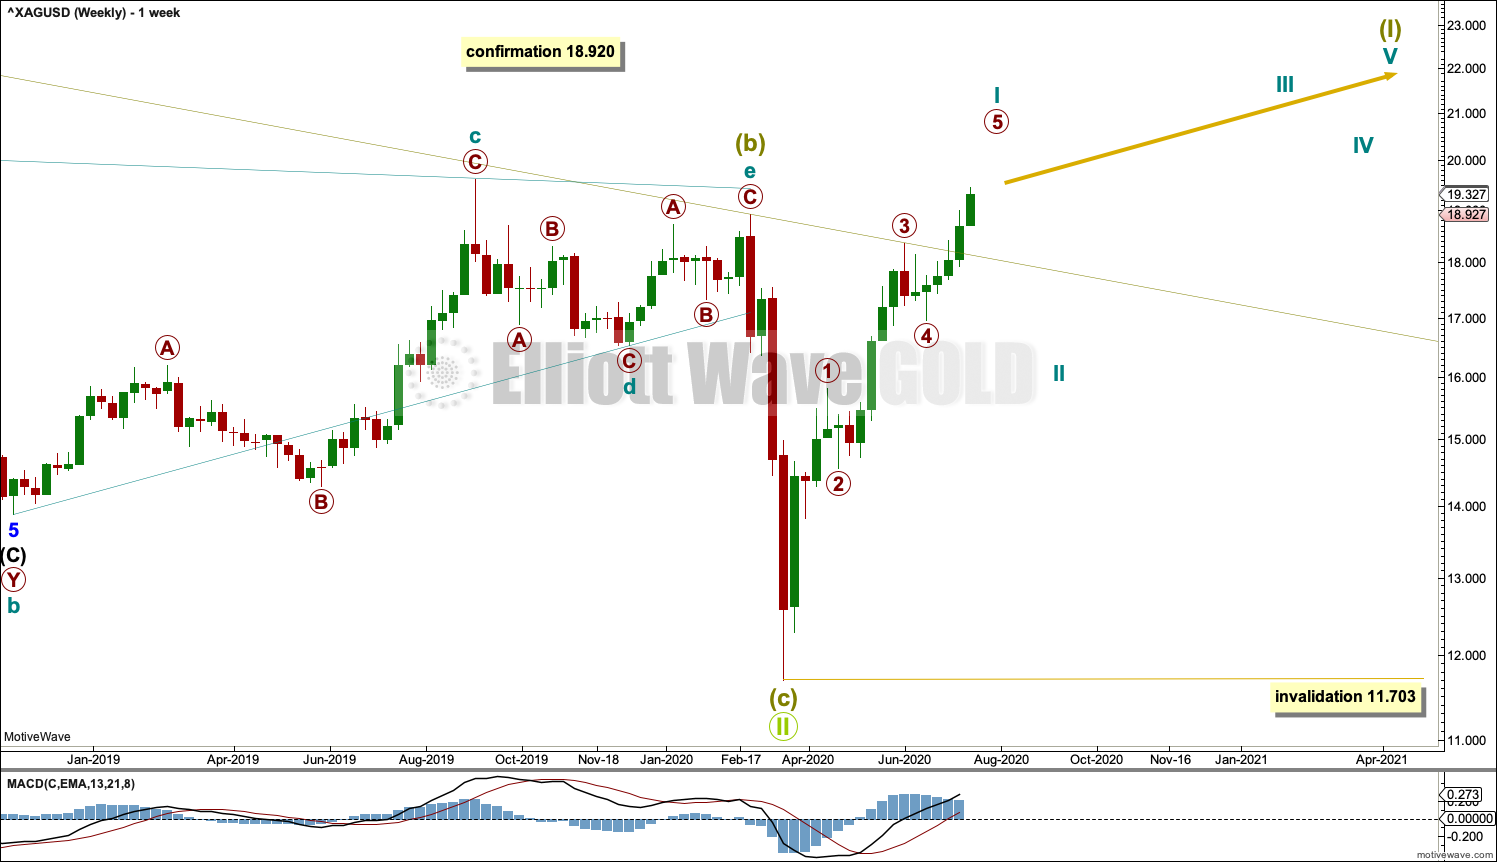
Grand Super Cycle wave II may be a complete zigzag. A new bull market may have begun for Silver.
18.920 is the end of Super Cycle wave (b) and the start of Super Cycle wave (c) within Grand Super Cycle wave (II). A new high above this point could not be a second wave correction within Super Cycle wave (c), and so Super Cycle wave (c) is confirmed as over.
The channel about Grand Super Cycle wave II is copied over from the monthly chart and extended outwards.
Super Cycle wave (I) must subdivide as a five wave motive structure, either an impulse or a leading diagonal. An impulse is much more common, so that is what shall be expected unless overlapping suggests a diagonal should be considered.
Cycle wave I may be incomplete.
Cycle wave II may not move beyond the start of cycle wave I below 11.703.
DAILY CHART
Click chart to enlarge.
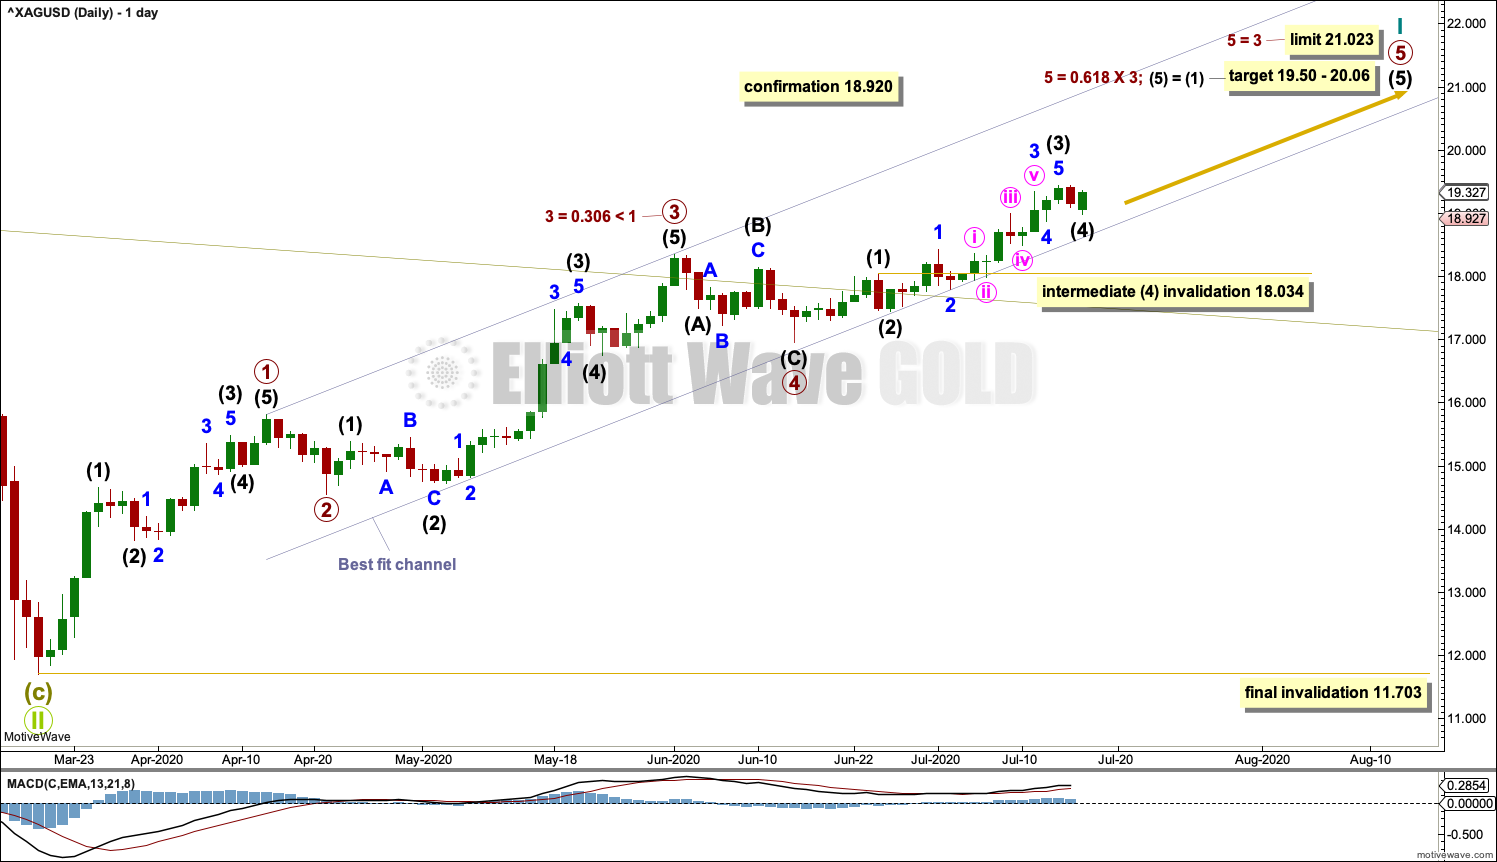
Cycle wave I may be an incomplete five wave impulse. Primary waves 1 through to 4 within the impulse may be complete.
Intermediate waves (1) through to (4) within primary wave 5 may now be complete. If it continues any lower, then intermediate wave (4) may not move into intermediate wave (1) price territory below 18.034.
Draw a channel as shown about cycle wave I. The lower edge continues to be where pullbacks are finding support. While price is within this channel, assume this wave count may be correct. A breach of this channel would indicate a possible trend change; at that stage, cycle wave I may be over.
Cycle wave II may not move beyond the start of cycle wave I below 11.703.
TECHNICAL ANALYSIS
WEEKLY CHART
Click chart to enlarge. Chart courtesy of StockCharts.com.
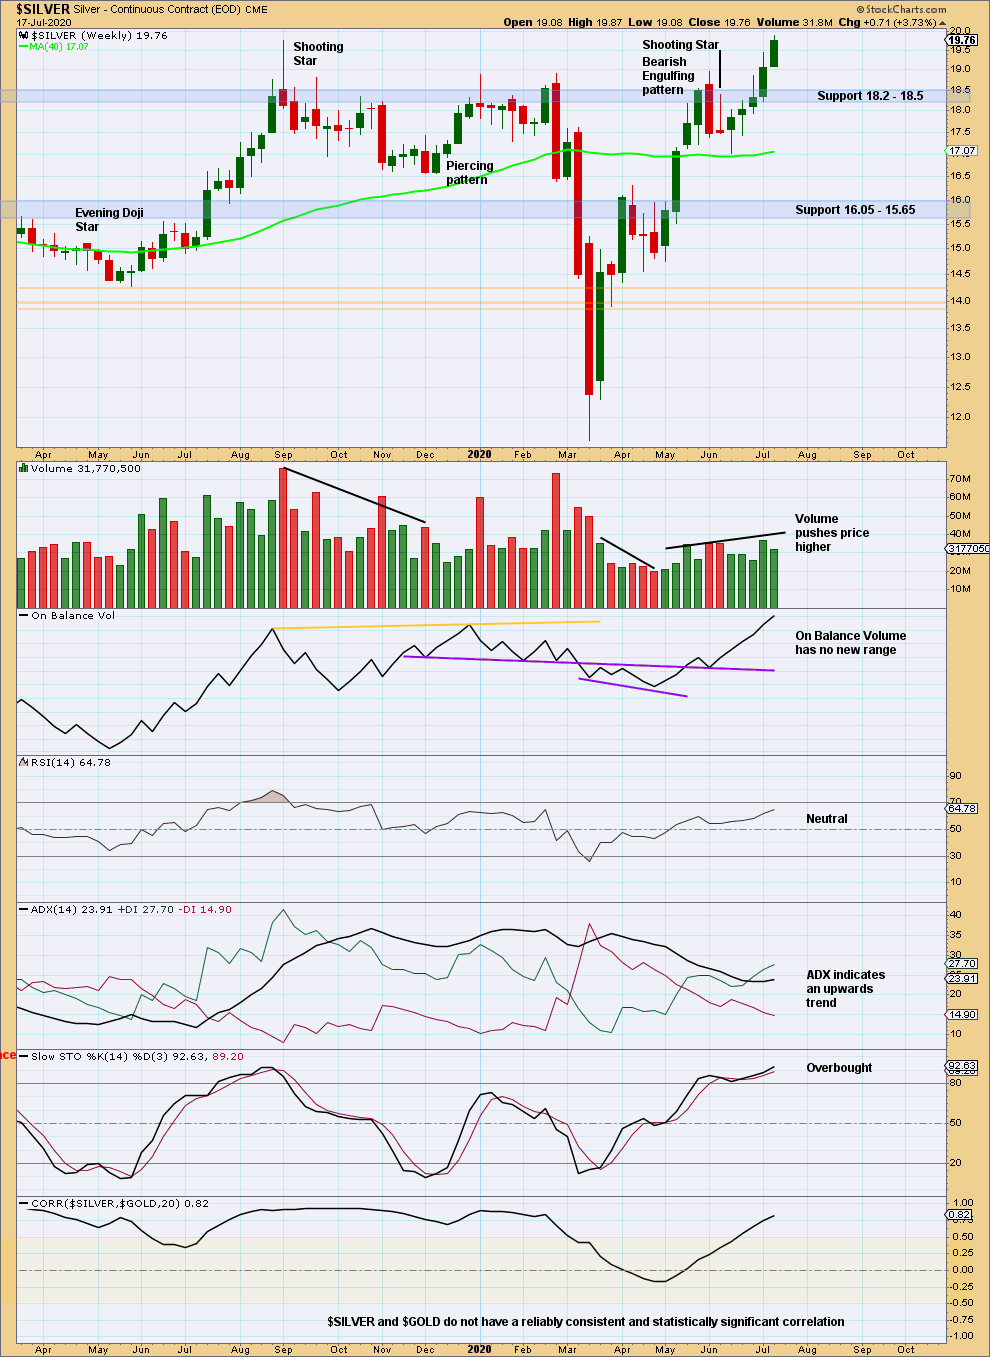
For the first time since at least April 2017 price has closed above strong resistance at 18.50. This is very bullish. The breakout has support from volume.
Neither RSI nor ADX are extreme. ADX indicates an upwards trend. There is room for this trend to continue. There is resistance above about 21.20 to 21.30.
DAILY CHART
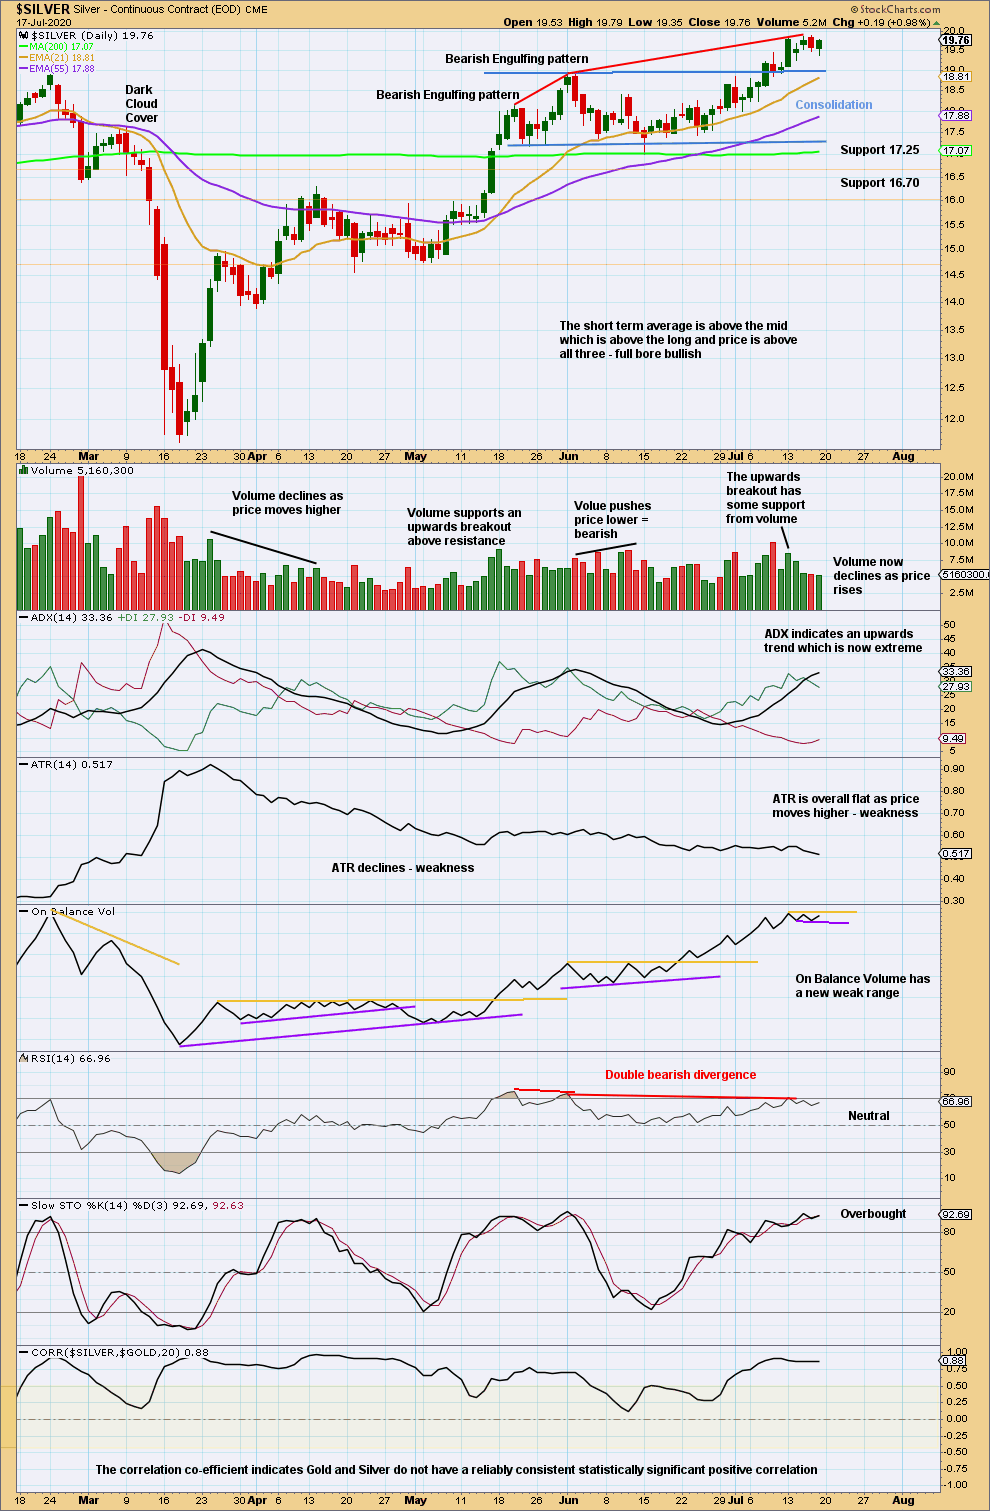
Click chart to enlarge. Chart courtesy of StockCharts.com.
An upwards breakout has been effected last week. It is possible there may be another larger back test of support at prior resistance.
A target is calculated at 20.90.
This week ADX has just reached extreme and volume exhibits some weakness. There is now higher risk of a pullback. Look for support about 18.90.
Published @ 10:10 a.m. ET on July 19, 2020.
—
Careful risk management protects your trading account(s).
Follow my two Golden Rules:
1. Always trade with stops.
2. Risk only 1-5% of equity on any one trade.
—
New updates to this analysis are in bold.