
SILVER: Elliott Wave and Technical Analysis | Charts – July 24, 2020
An intra week update gave members two new targets for upwards movement. The first target was quickly reached and exceeded. The second target is yet to be reached.
Summary: A blow off top may be forming. It is possible it could be over at Fridays high, or it may continue for another one to very few sessions. It should end by the middle of next week at the latest. Blow off tops are usually quickly and sharply reversed. Careful attention to risk management is essential in this type of high volatility market.
The next target is at 25.308.
The Elliott wave count is now very bullish and expects new highs substantially above 49.752 in coming years.
ELLIOTT WAVE COUNT
MONTHLY CHART
Click chart to enlarge.
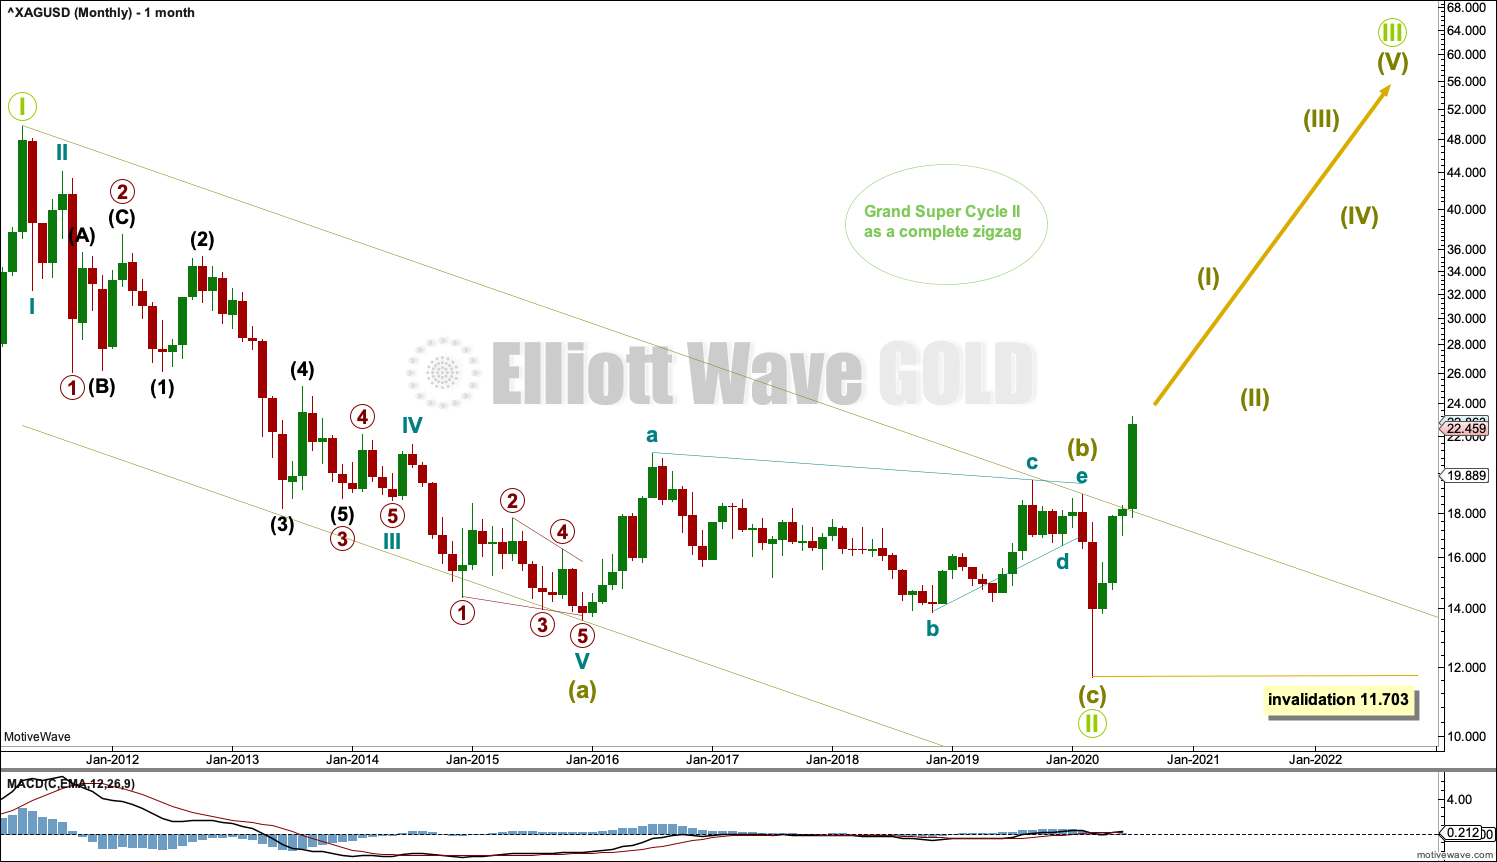
The bear market for Silver may be complete. A new high above 18.920 adds further confidence to this view.
This Elliott wave structure for this bear market is labelled as a single zigzag for Grand Super Cycle wave II. Single zigzags are the most common Elliott wave corrective structure.
Within the zigzag: Super Cycle wave (a) subdivides as a five wave impulse, Super Cycle wave (b) subdivides as a complete regular contracting triangle, and Super Cycle wave (c) subdivides as a complete five wave impulse that is relatively brief and shallow.
Draw a channel about the entire bear market of Grand Super Cycle wave II as shown. A breach of the upper edge of this channel would add confidence to this wave count. Price may have found resistance at the upper edge of this channel, which may have initiated a pullback.
When charts are drawn on a semi-log scale, price has now breached the upper edge of the trend channel. Copy this channel over to weekly and daily charts. The upper edge of this channel may now provide support.
Grand Super Cycle wave III must subdivide as a five wave impulse at Super Cycle degree.
WEEKLY CHART
Click chart to enlarge.
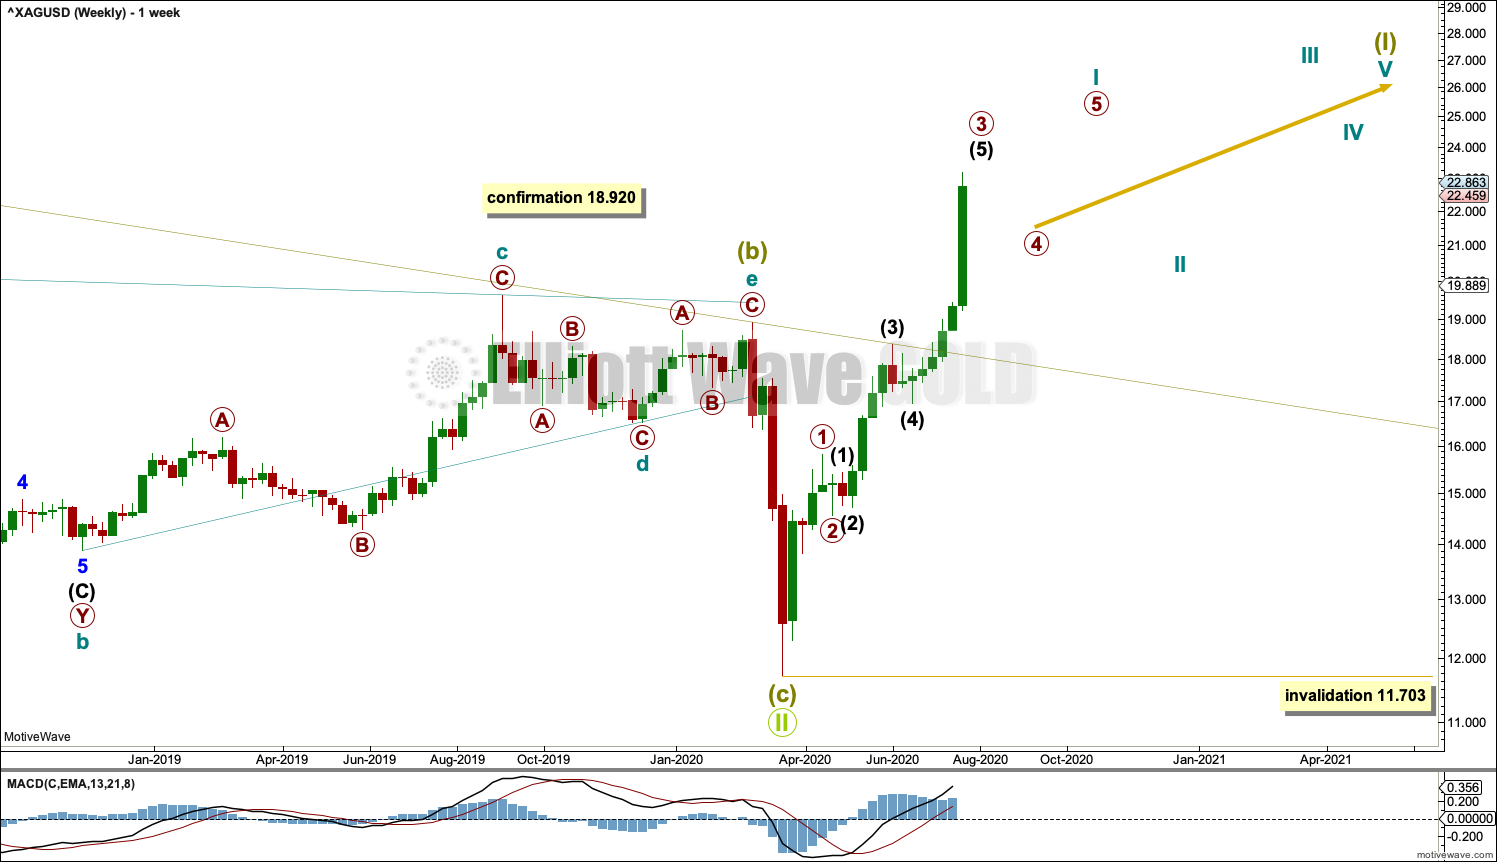
Grand Super Cycle wave II may be a complete zigzag. A new bull market may have begun for Silver.
The channel about Grand Super Cycle wave II is copied over from the monthly chart and extended outwards.
Super Cycle wave (I) may subdivide as an impulse or a leading diagonal. An impulse is much more common, so that is what shall be expected unless overlapping suggests a diagonal should be considered.
Cycle wave II may not move beyond the start of cycle wave I below 11.703.
DAILY CHART
Click chart to enlarge.
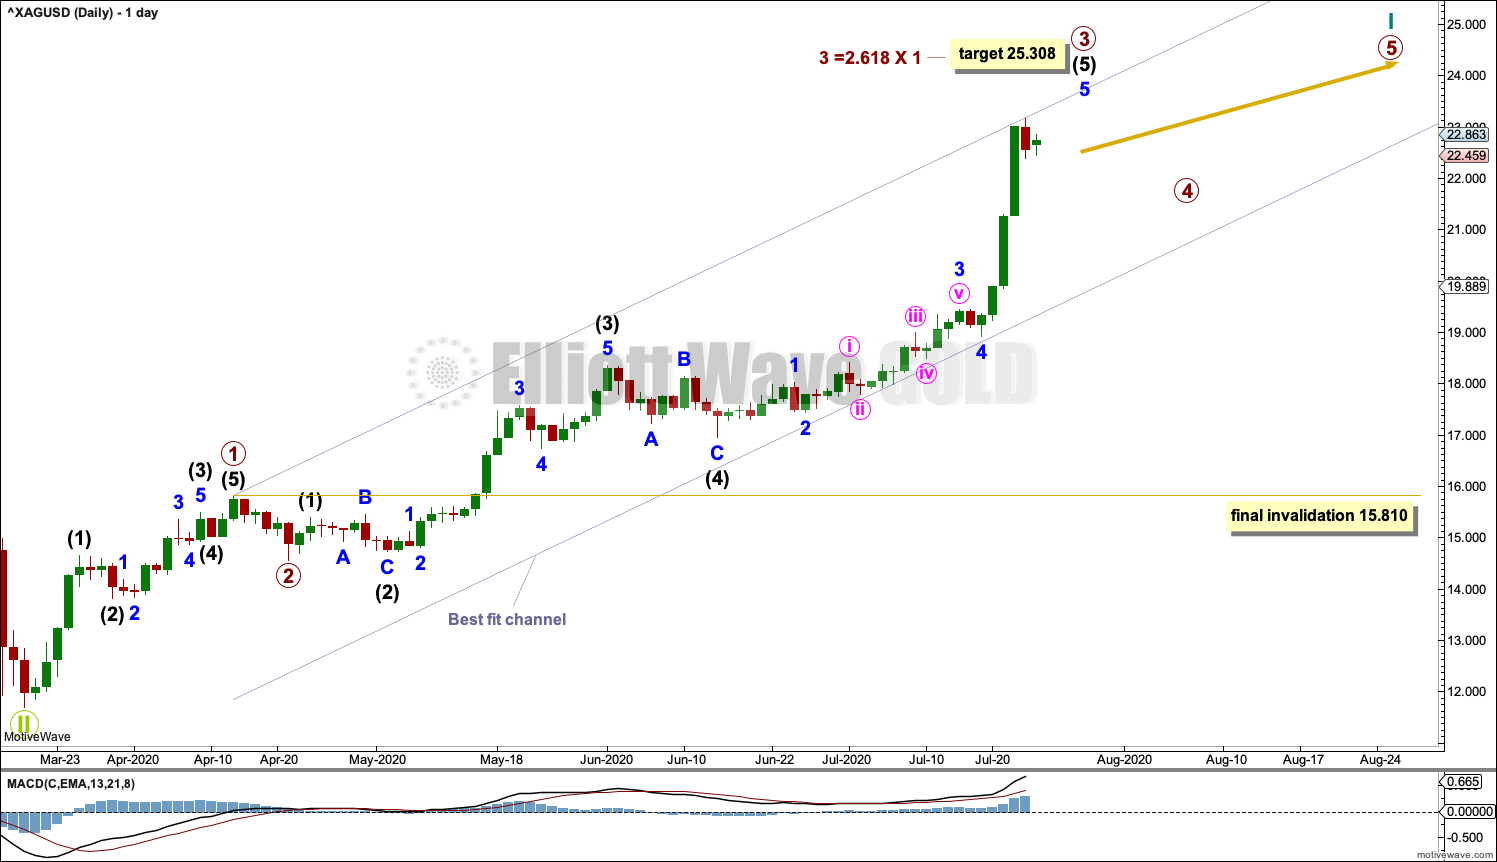
Cycle wave I may be an incomplete five wave impulse. Primary waves 1 and 2 may be complete.
Primary wave 3 may only subdivide as an impulse. Intermediate waves (1) through to (4) within the impulse may be complete. Intermediate wave (5) to end primary wave 3 may end with a blow off top. It is common within commodities for fifth waves to end third wave impulses one degree higher to be very swift and strong.
When primary wave 4 may be complete, then the best fit channel may show where primary wave 4 may find support at the lower edge.
Primary wave 4 may not move into primary wave 1 price territory below 15.810.
TECHNICAL ANALYSIS
WEEKLY CHART
Click chart to enlarge. Chart courtesy of StockCharts.com.
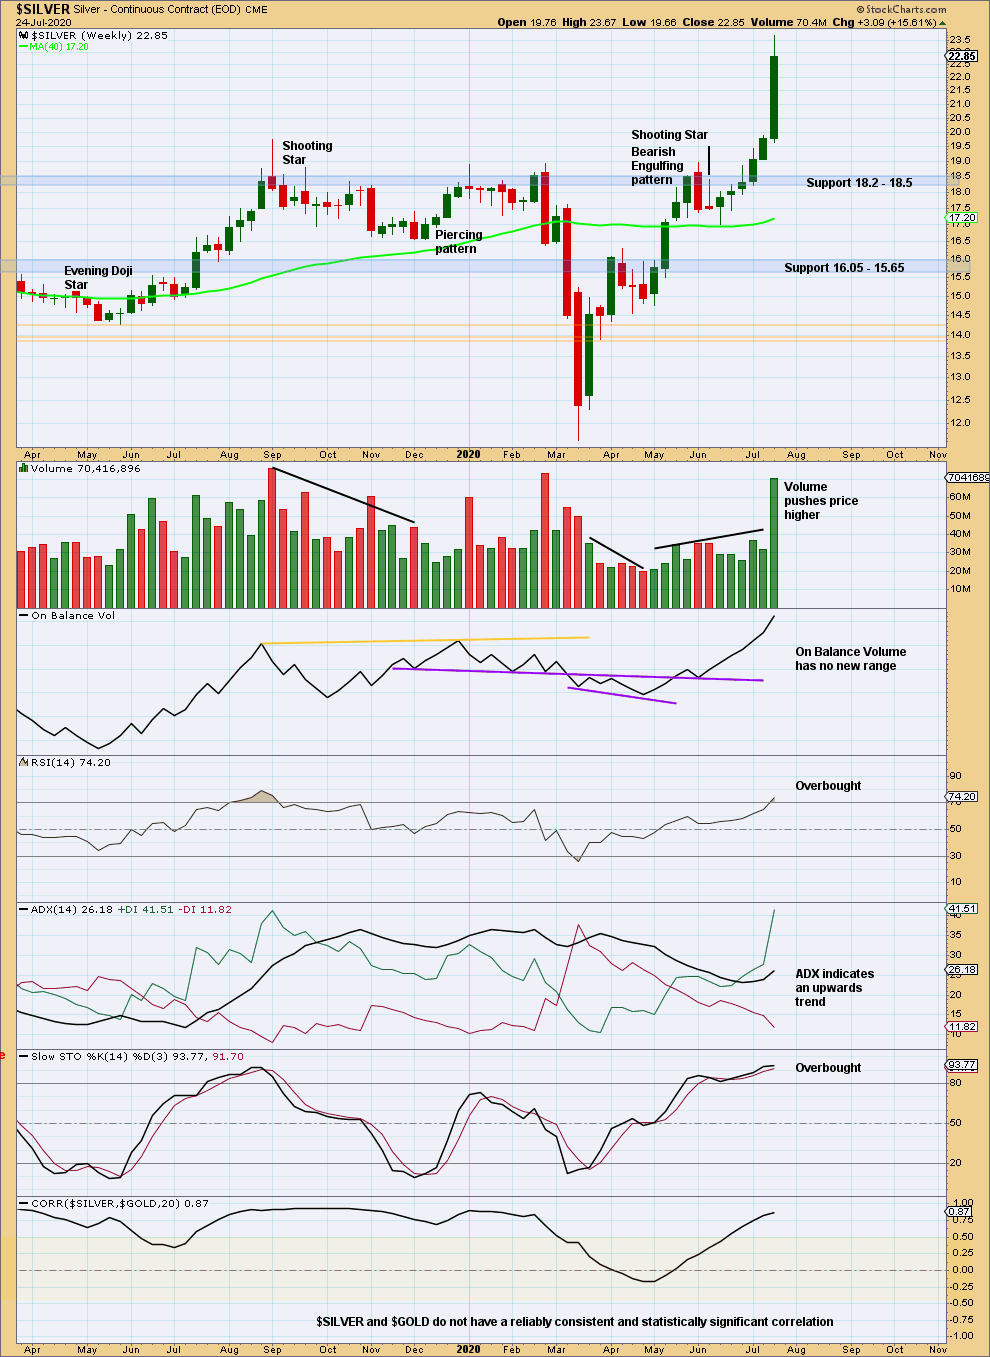
For the first time since at least April 2017 price has closed above strong resistance at 18.50. This is very bullish. The breakout has support from volume.
There is resistance above about 25.00 and 26.00.
ADX is still not extreme. RSI is now just entering overbought, and it can reach into overbought more deeply before the trend is over. There is still room for this trend to continue.
DAILY CHART
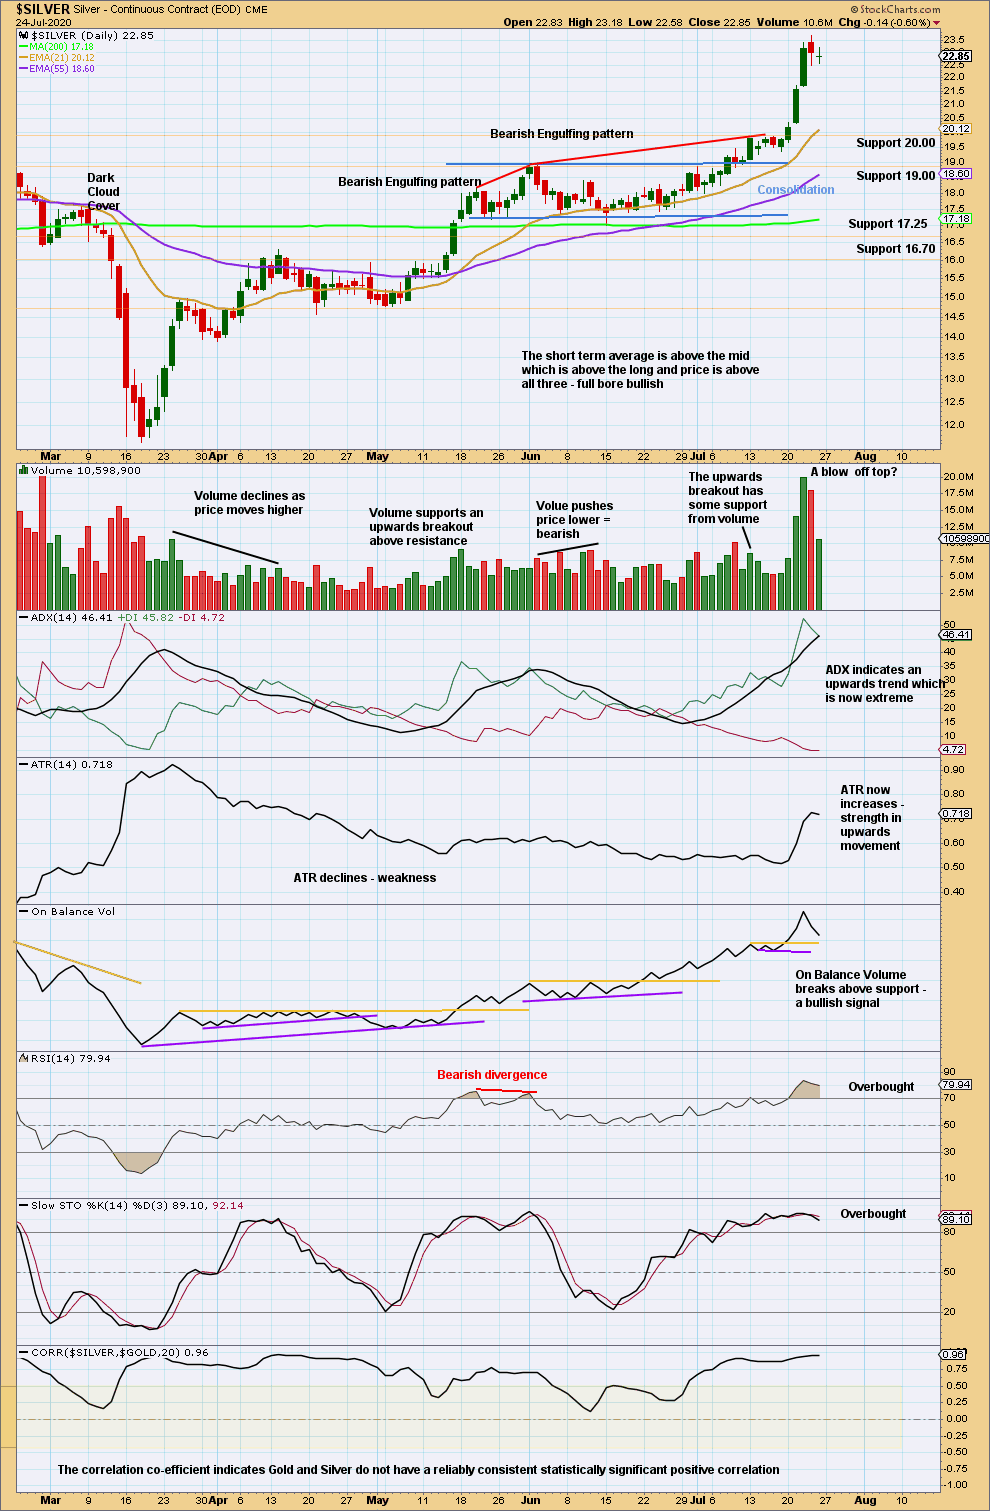
Click chart to enlarge. Chart courtesy of StockCharts.com.
A blow off top may be forming. At this stage, there is no reversal signal.
Look for a bearish candlestick pattern or one or more long upper wicks to signal the short to mid-term trend change after the blow off top.
Blow off tops can continue for a few sessions. They are usually quickly and sharply reversed.
Published @ 09:43 a.m. ET on July 25, 2020.
—
Careful risk management protects your trading account(s).
Follow my two Golden Rules:
1. Always trade with stops.
2. Risk only 1-5% of equity on any one trade.
—
New updates to this analysis are in bold.