
US OIL: Elliott Wave and Technical Analysis | Charts – July 17, 2020
Summary: Oil may have found a major sustainable low.
A slow rounded top looks to be forming. It may take a few more weeks to form before a pullback begins to gather strength.
For the mid term, a multi-week pullback may end about 31.16 or 22.23. It is possible the pullback may be deeper than this though; the first major correction within a new trend for Oil tends to be very deep.
When this pullback may be complete, then an upwards trend should resume with increased strength.
ELLIOTT WAVE COUNT
MONTHLY CHART
Click chart to enlarge.
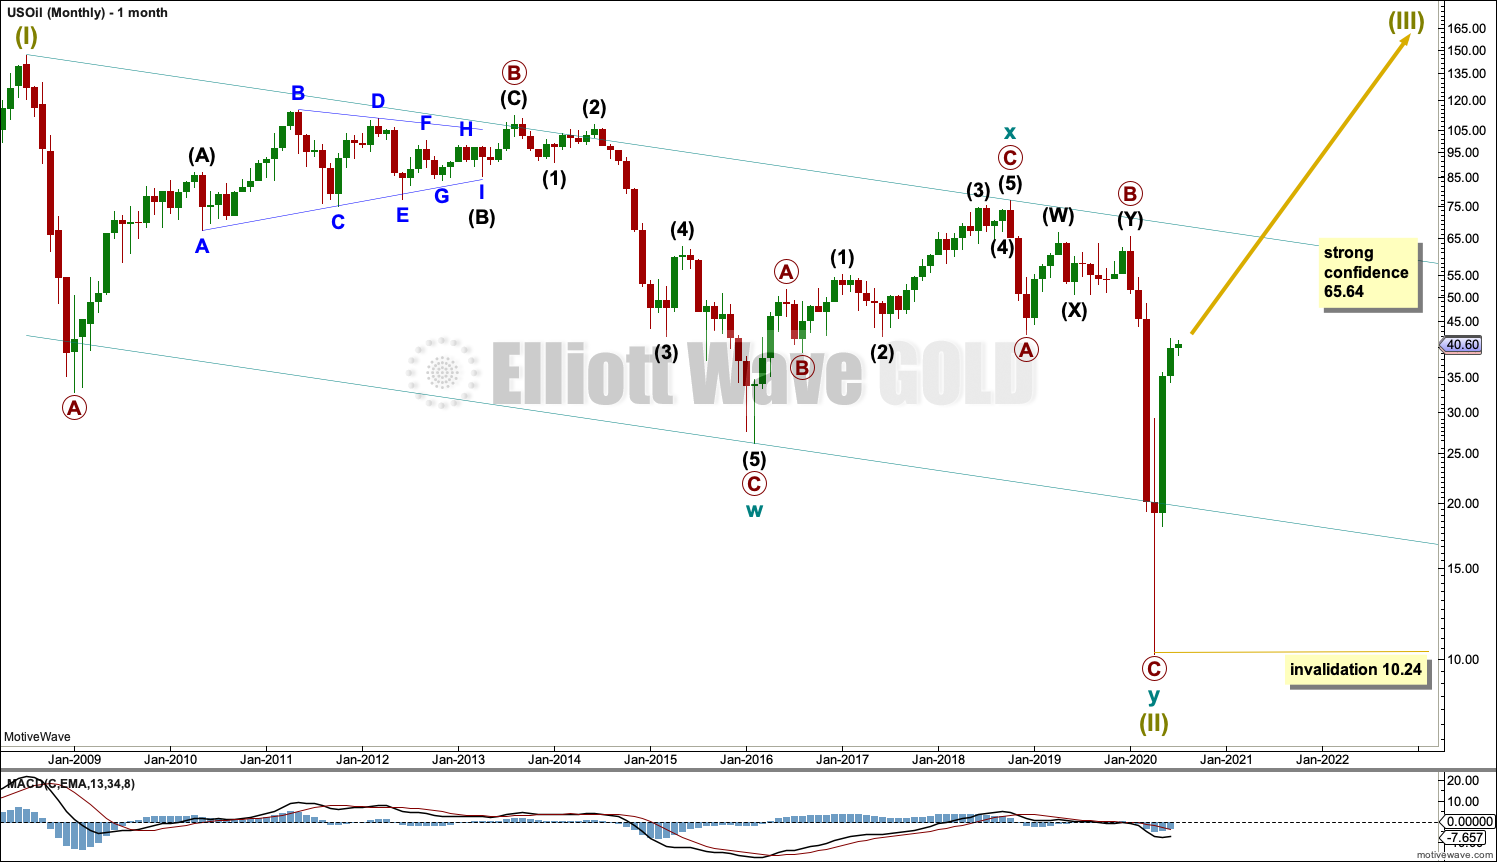
The basic Elliott wave structure is five steps forward and three steps back. This Elliott wave count expects that US Oil has completed a three steps back pattern, which began in July 2008. The Elliott wave count expects that the bear market for US Oil may now be over.
A channel is drawn about Super Cycle wave (II): draw the first trend line from the start of cycle wave w to the end of cycle wave x, then place a parallel copy on the end of cycle wave w. Price has bounced up off the channel. This trend line is breached, which is a typical look for the end of a movement for a commodity.
The upper edge of the channel may provide resistance.
Following five waves up and three steps back should be another five steps up; this is labelled Super Cycle wave (III), which may only have just begun. Super Cycle wave (III) may last a generation and must make a new high above the end of Super Cycle wave (I) at 146.73.
Super Cycle wave (III) may only subdivide as a five wave impulse. New trends for Oil usually start out very slowly with short first waves and deep time consuming second wave corrections. Basing action over a few years may now have begun.
WEEKLY CHART
Click chart to enlarge.
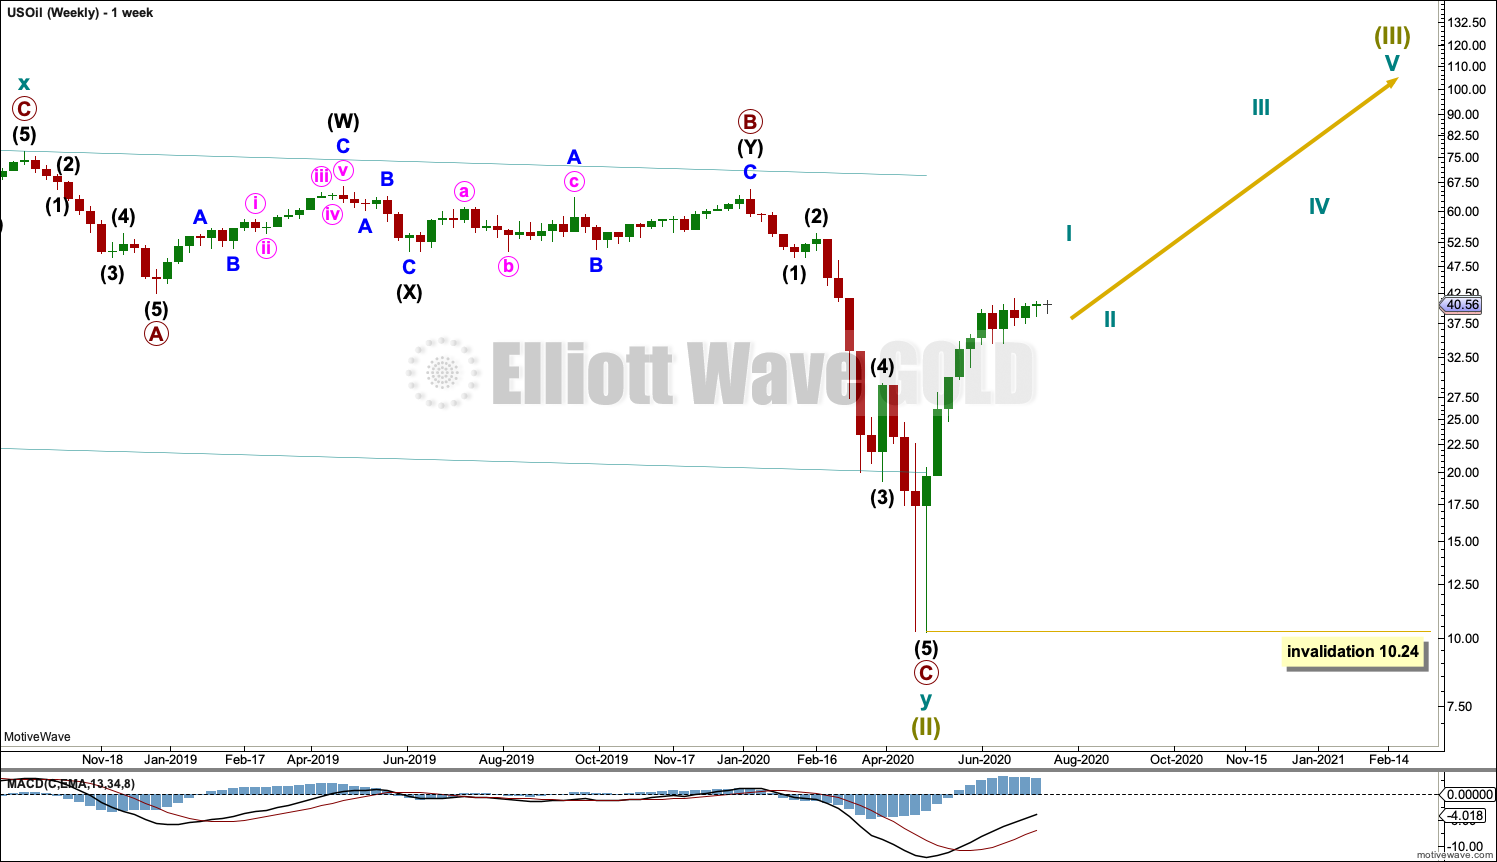
Super Cycle wave (III) must subdivide as an impulse. Cycle wave I within the impulse may now be unfolding higher. Cycle wave II may not move beyond the start of cycle wave I below 10.24.
DAILY CHART
Click chart to enlarge.
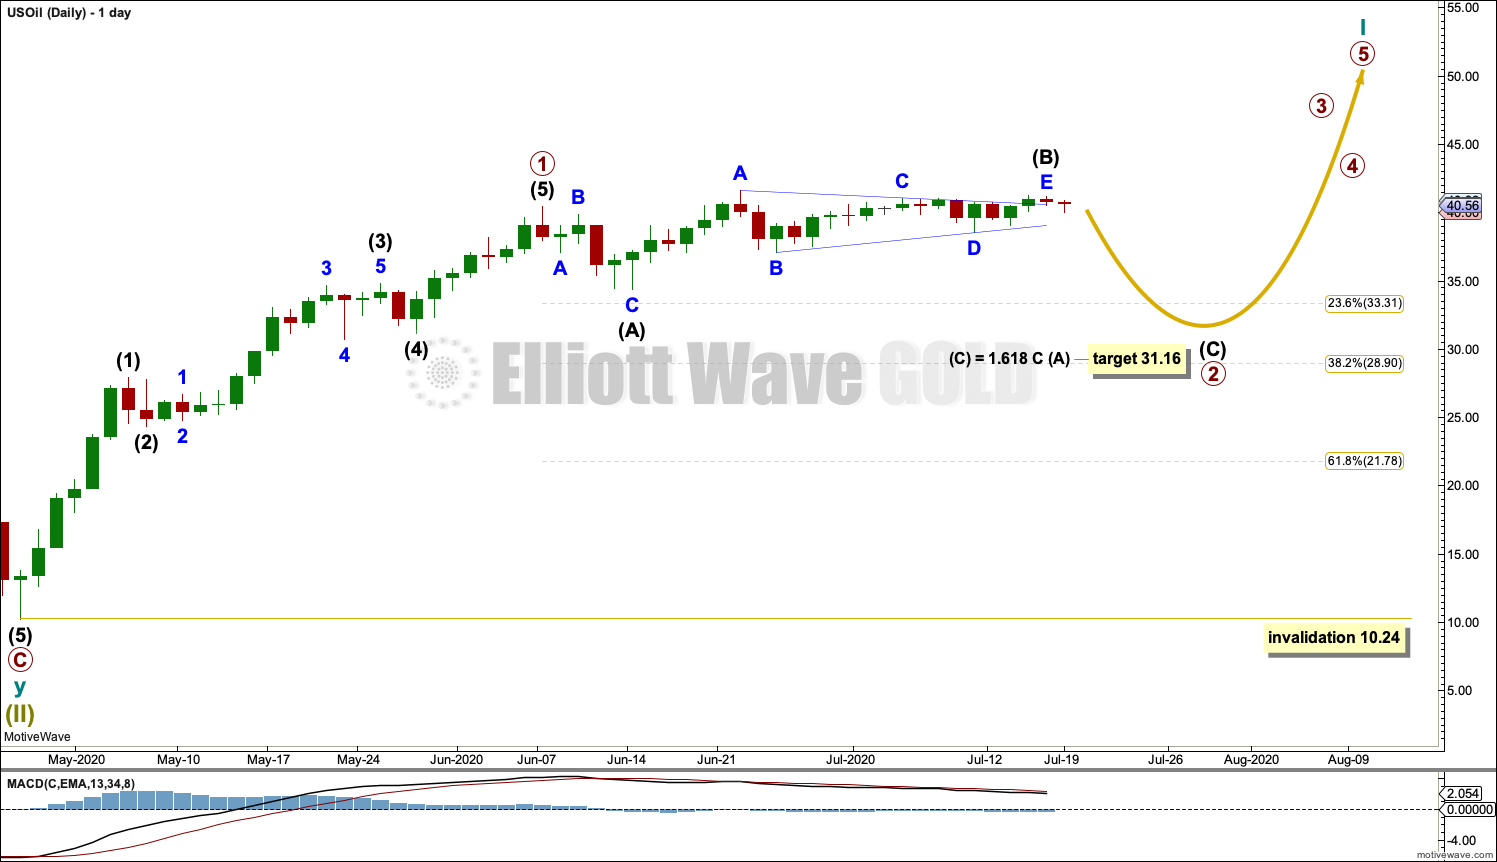
Labels are added for cycle wave I. Primary wave 1 within an impulse for cycle wave I may now be complete.
Primary wave 2 may be unfolding as an expanded flat correction. Intermediate wave (A) within the flat may be a complete zigzag. Intermediate wave (B) may be a complete contracting triangle, at 1.09 times the length of intermediate wave (A) at its terminus. This is within the common range for intermediate wave (B) within a flat from 1 to 1.38 times the length of intermediate wave (A), giving a range from 40.44 to 42.75.
A target is calculated for primary wave 2 that expects a common Fibonacci ratio between intermediate waves (A) and (C).
Primary wave 2 may not move beyond the start of primary wave 1 below 10.24.
ALTERNATE DAILY CHART
Click chart to enlarge.
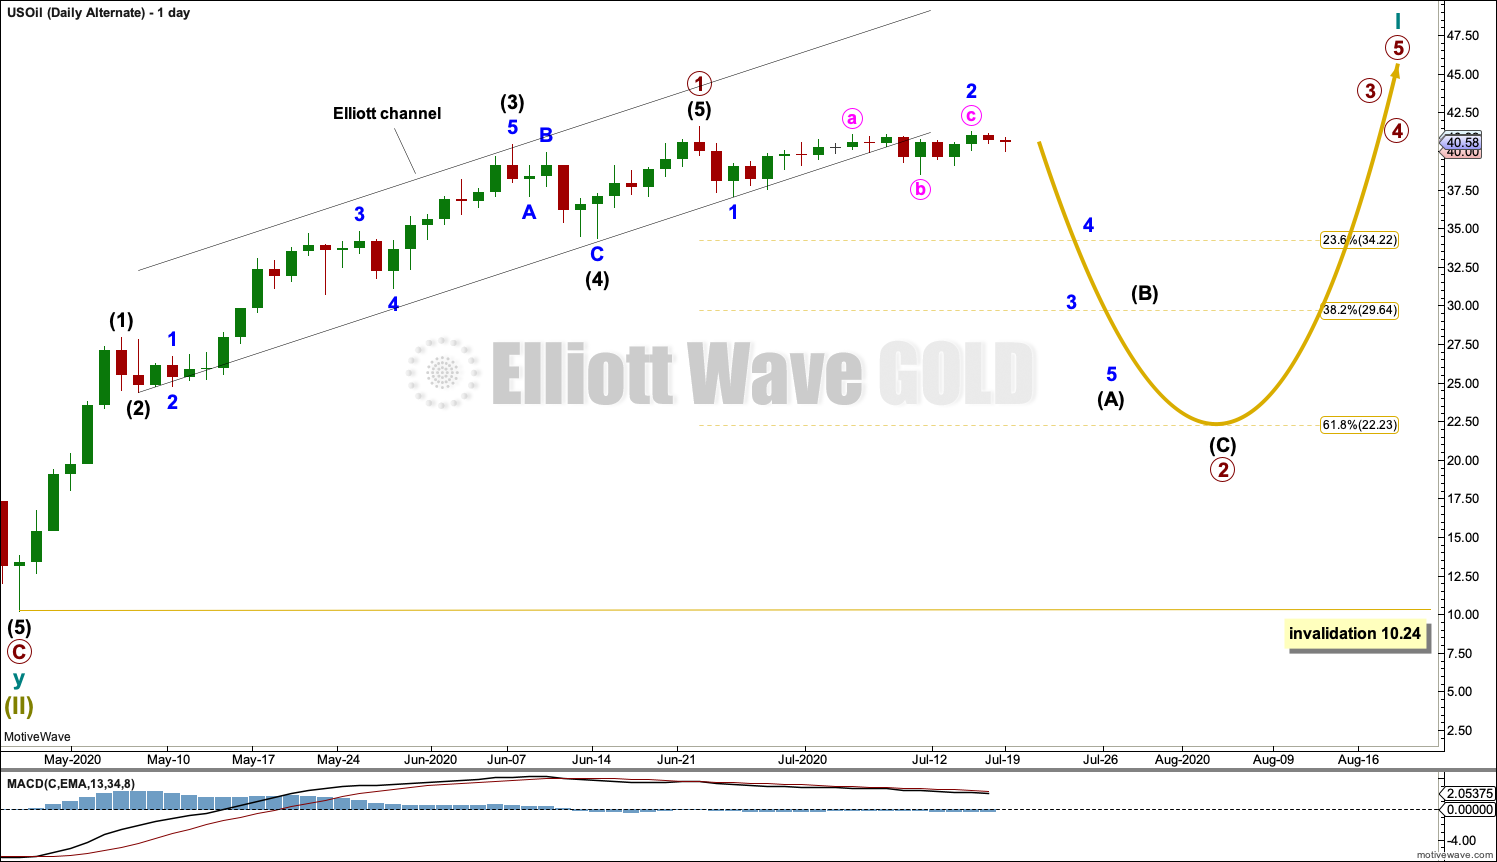
It is possible that primary wave 1 may have ended at the last high.
Primary wave 2 may have begun at the last high. The most common structure for a second wave is a zigzag. Primary wave 2 may end about the 0.618 Fibonacci ratio of primary wave 1, or it may be deeper than that target.
Primary wave 2 may not move beyond the start of primary wave 1 below 10.24.
SECOND ALTERNATE DAILY CHART
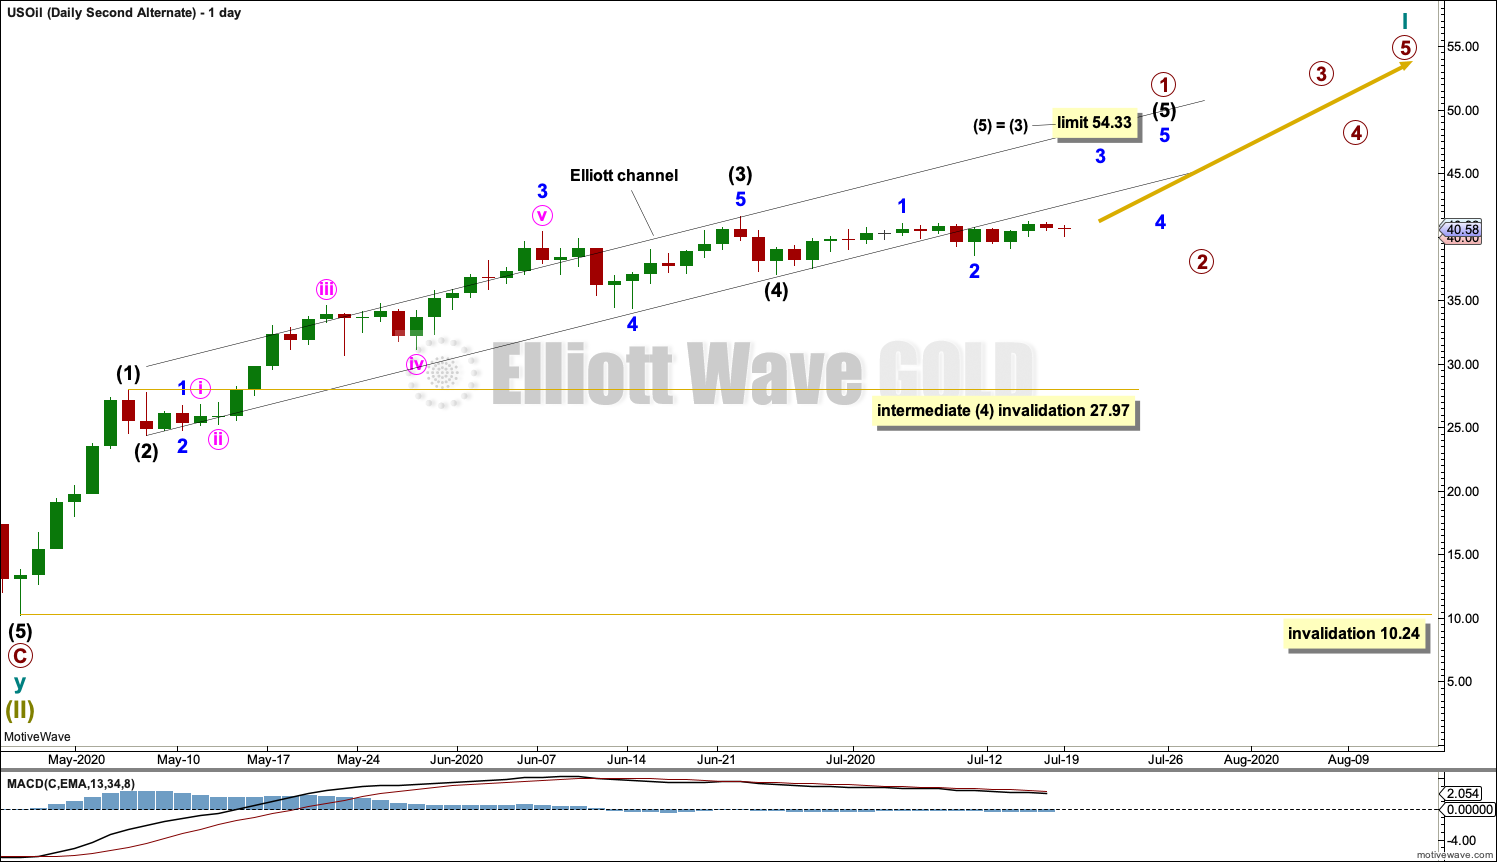
Click chart to enlarge.
It is also possible that primary wave 1 may be incomplete.
Intermediate wave (3) within primary wave 1 may be complete at the last high. Intermediate wave (3) at 17.25 in length is shorter than intermediate wave (1) at 17.73 in length. For this wave count, if intermediate wave (5) has begun at the low for June 25th, then it is limited to no longer than equality in length with intermediate wave (3) at 54.33.
Intermediate wave (4) may not move into intermediate wave (1) price territory below 27.97.
Primary wave 2 may not move beyond the start of primary wave 1 below 10.24.
Sideways movement of the last week has now breached the channel drawn about primary wave 1. If this wave count is correct, then price should remain within that channel while primary wave 1 completes. The breach of the channel reduces the probability of this wave count.
TECHNICAL ANALYSIS
WEEKLY CHART
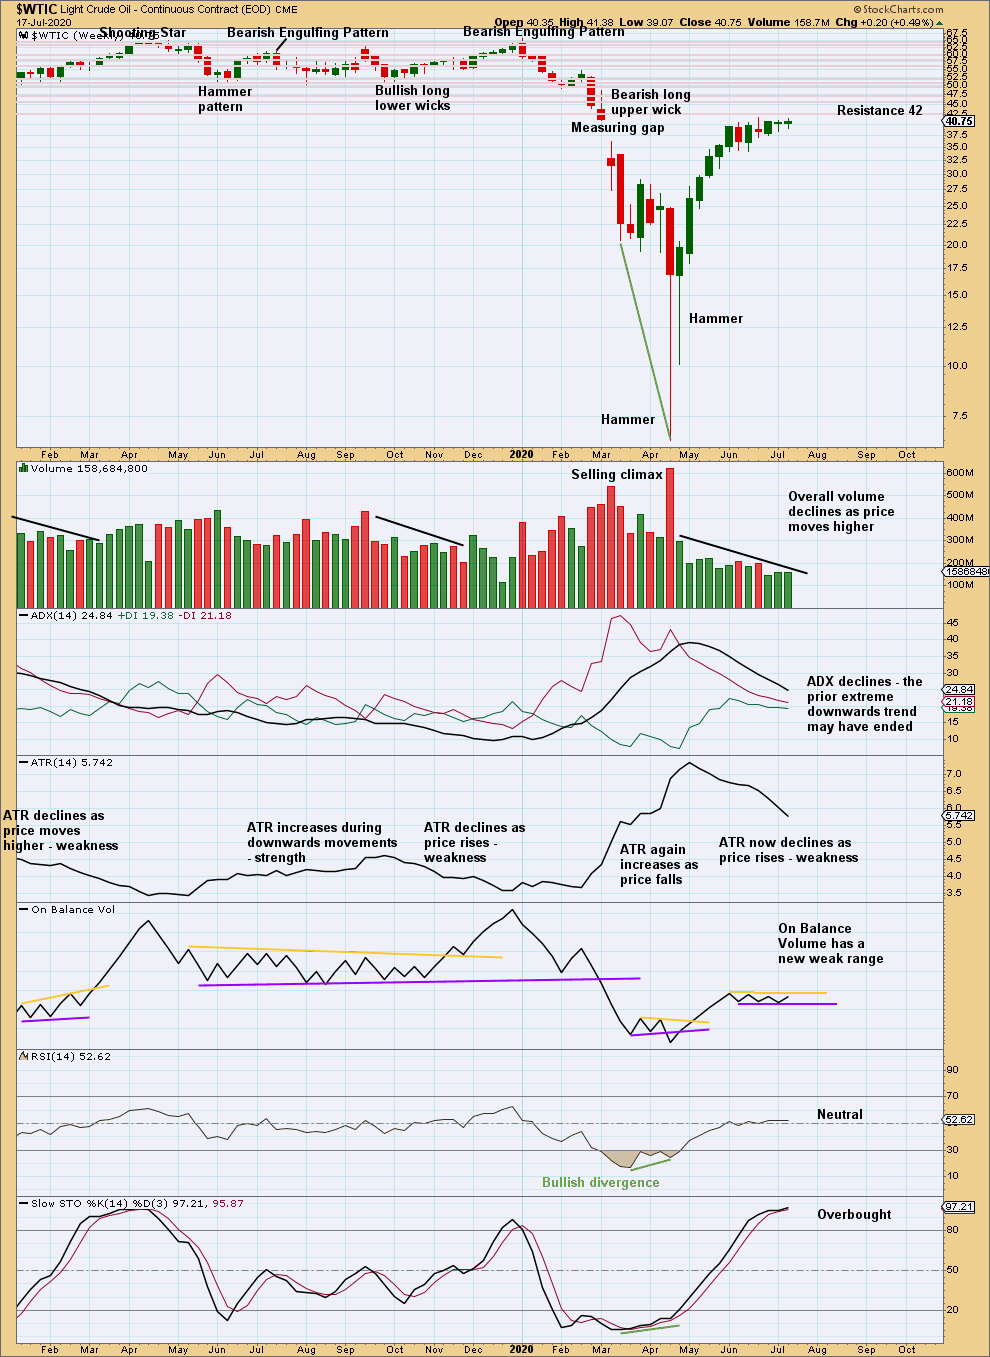
Click chart to enlarge. Chart courtesy of StockCharts.com.
The short-term volume profile remains slightly bearish and price remains just below a strong cluster of resistance. With Stochastics now overbought, the risk of a multi-week pullback remains high.
DAILY CHART
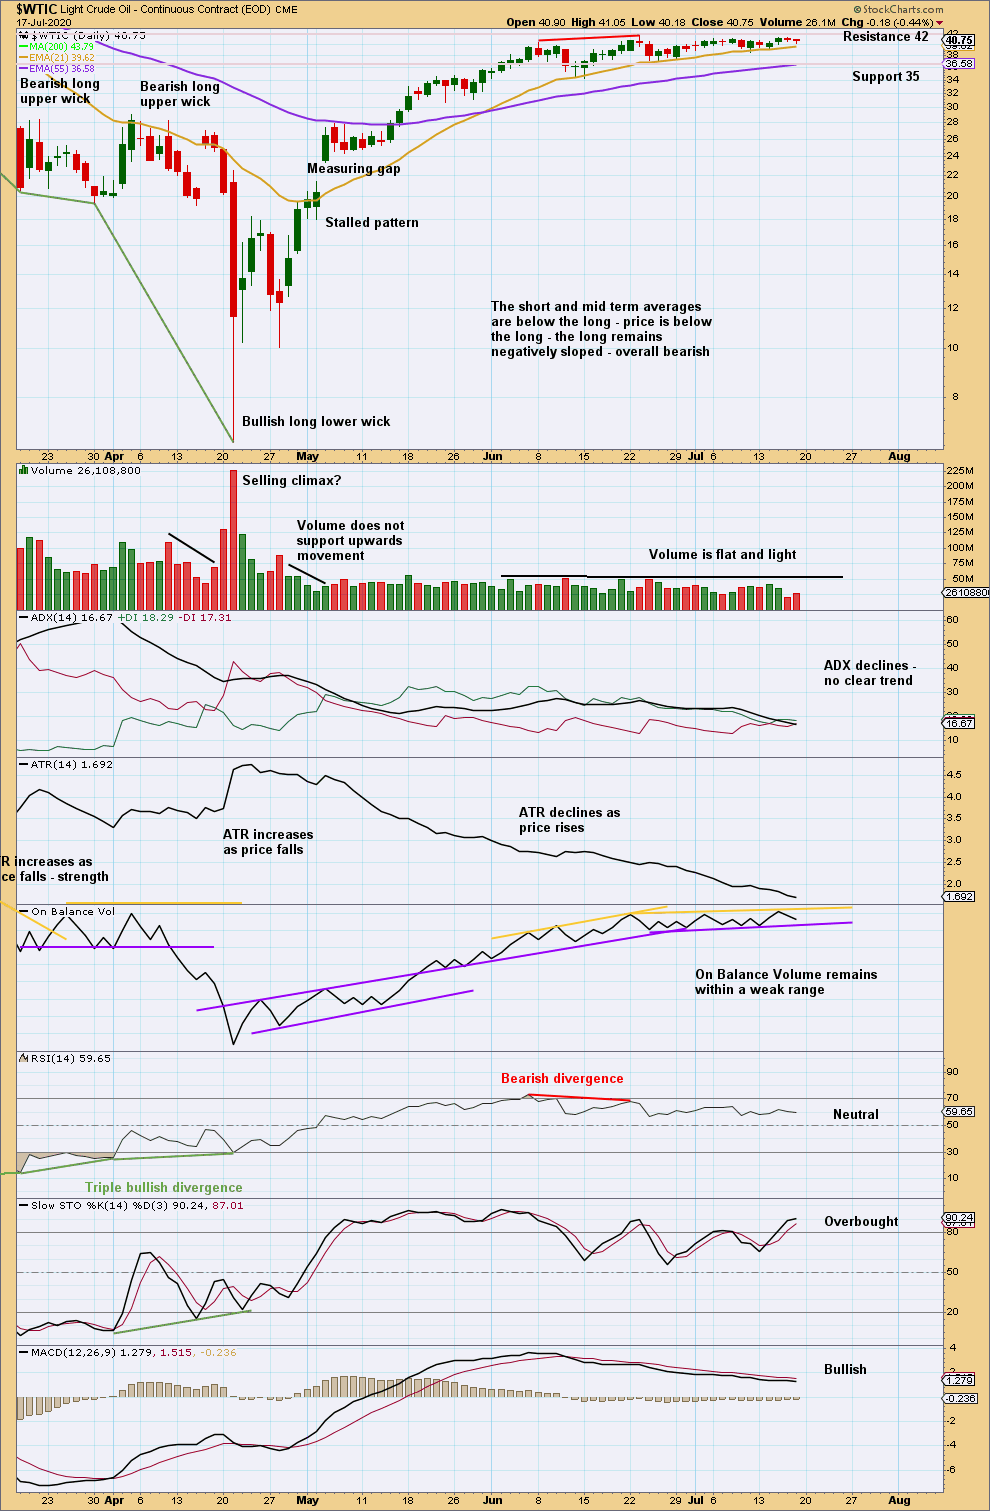
Click chart to enlarge. Chart courtesy of StockCharts.com.
Bearish divergence with price and RSI is clear. The probability of a multi-week pullback remains high.
Published @ 06:16 p.m. ET.
—
Careful risk management protects your trading account(s).
Follow my two Golden Rules:
1. Always trade with stops.
2. Risk only 1-5% of equity on any one trade.
—
New updates to this analysis are in bold.