
GOLD: Elliott Wave and Technical Analysis | Charts – August 7, 2020
Summary: A consolidation or pullback may have begun at Friday’s high, which may last about one to two weeks. It may find support about 1,977 or 1,919. Thereafter, the upwards trend may resume.
The next longer-term target is at 2,250 or 2,306.
Grand SuperCycle analysis is here.
Last analysis of monthly charts is here with video here.
BEARISH ELLIOTT WAVE COUNT
WEEKLY CHART

Click chart to enlarge.
The bigger picture for this main bearish Elliott wave count sees Gold as still within a bear market, in a three steps back pattern that is labelled Grand Super Cycle wave IV on monthly charts. The common range for Super Cycle wave (b) is from 1 to 1.38 times the length of Super cycle wave (a), giving a range from 1,920.18 to 2,252.27. The target would see Super Cycle wave (b) end within this most common range.
Super Cycle wave (b) within Grand Super Cycle wave IV may be an incomplete double zigzag. When Super Cycle wave (b) may be complete, then this wave count expects Super Cycle wave (c) to begin and to move price below the end of Super Cycle wave (a) at 1,046.27.
The first zigzag in the double is labelled cycle wave w. The double is joined by a three in the opposite direction, a combination labelled cycle wave x. The second zigzag in the double is labelled cycle wave y.
The purpose of the second zigzag in a double is to deepen the correction. Cycle wave y has achieved this purpose.
Primary wave C within cycle wave y may be subdividing as an impulse. Intermediate waves (1) and (2) within primary wave C may be complete. Intermediate wave (3) may be continuing higher. Intermediate wave (4) may not move into intermediate wave (1) price territory below 1,764.12.
We should always assume the trend remains the same until proven otherwise. At this stage, Gold is in a bull market.
DAILY CHART
Click chart to enlarge.
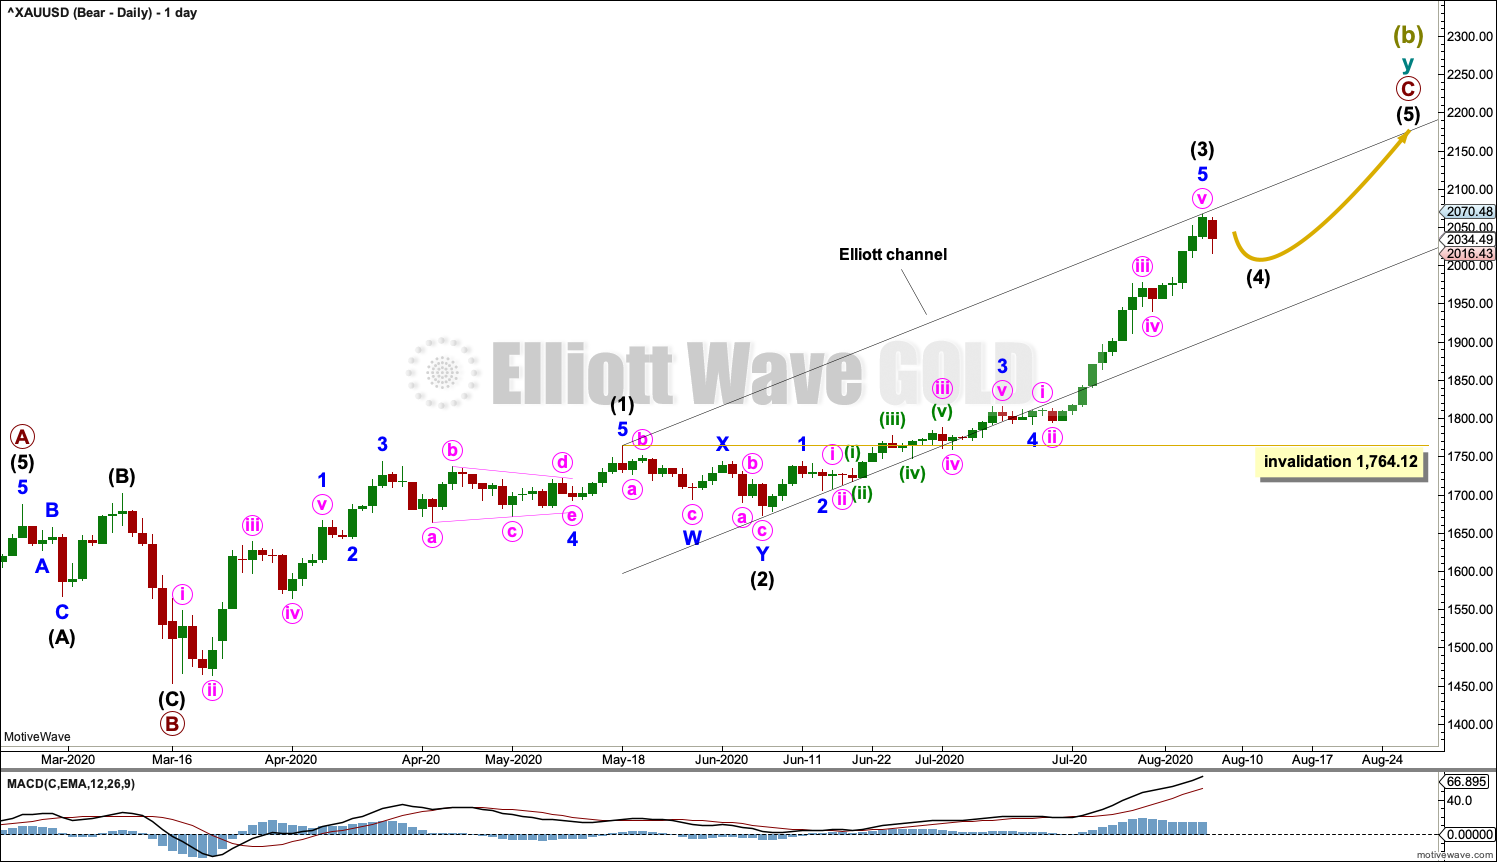
The daily chart shows detail of primary wave C as an incomplete impulse.
Intermediate waves (1) through to (3) within primary wave C may be complete.
Intermediate wave (4) may not move into intermediate wave (1) price territory below 1,764.12.
Draw an Elliott channel: draw a first trend line from the end of intermediate wave (1) to the end of intermediate wave (3), then place a parallel copy on the end of intermediate wave (2). Intermediate wave (4) may find support about the lower edge.
Intermediate wave (2) was a shallow double zigzag, lasting 15 sessions. Intermediate wave (4) may exhibit alternation as a flat, combination or triangle; it may last about one to two weeks.
Within all of a flat, combination or triangle, a new high above 2,070.48 may develop if intermediate wave (4) unfolds as an expanded flat, running triangle or combination. There is no short-term upper invalidation point for this reason; a new high above 2,070.48 does not necessarily indicate intermediate wave (4) as over.
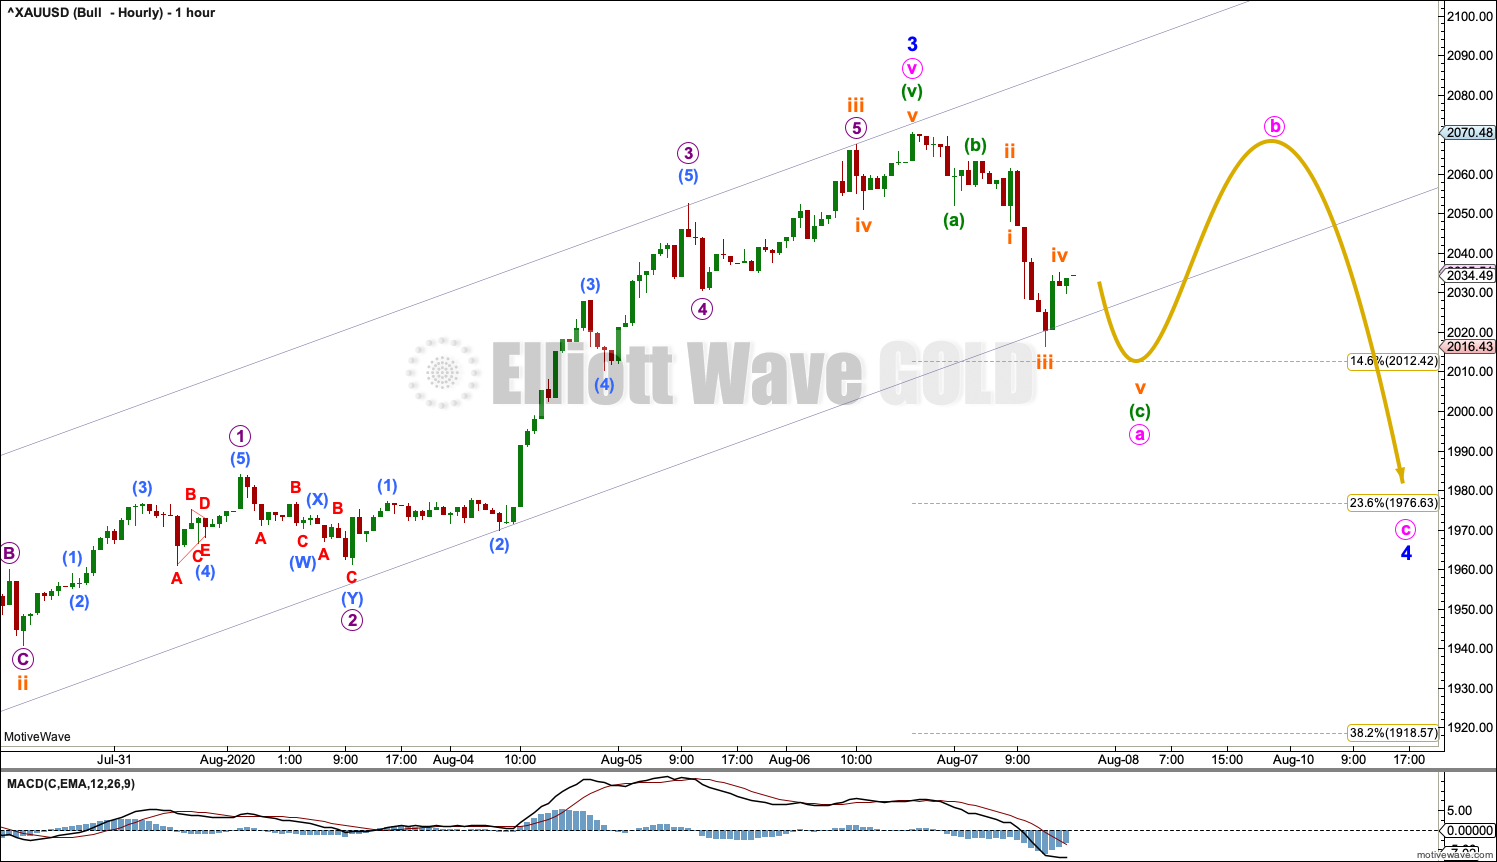
HOURLY CHART
Click chart to enlarge.
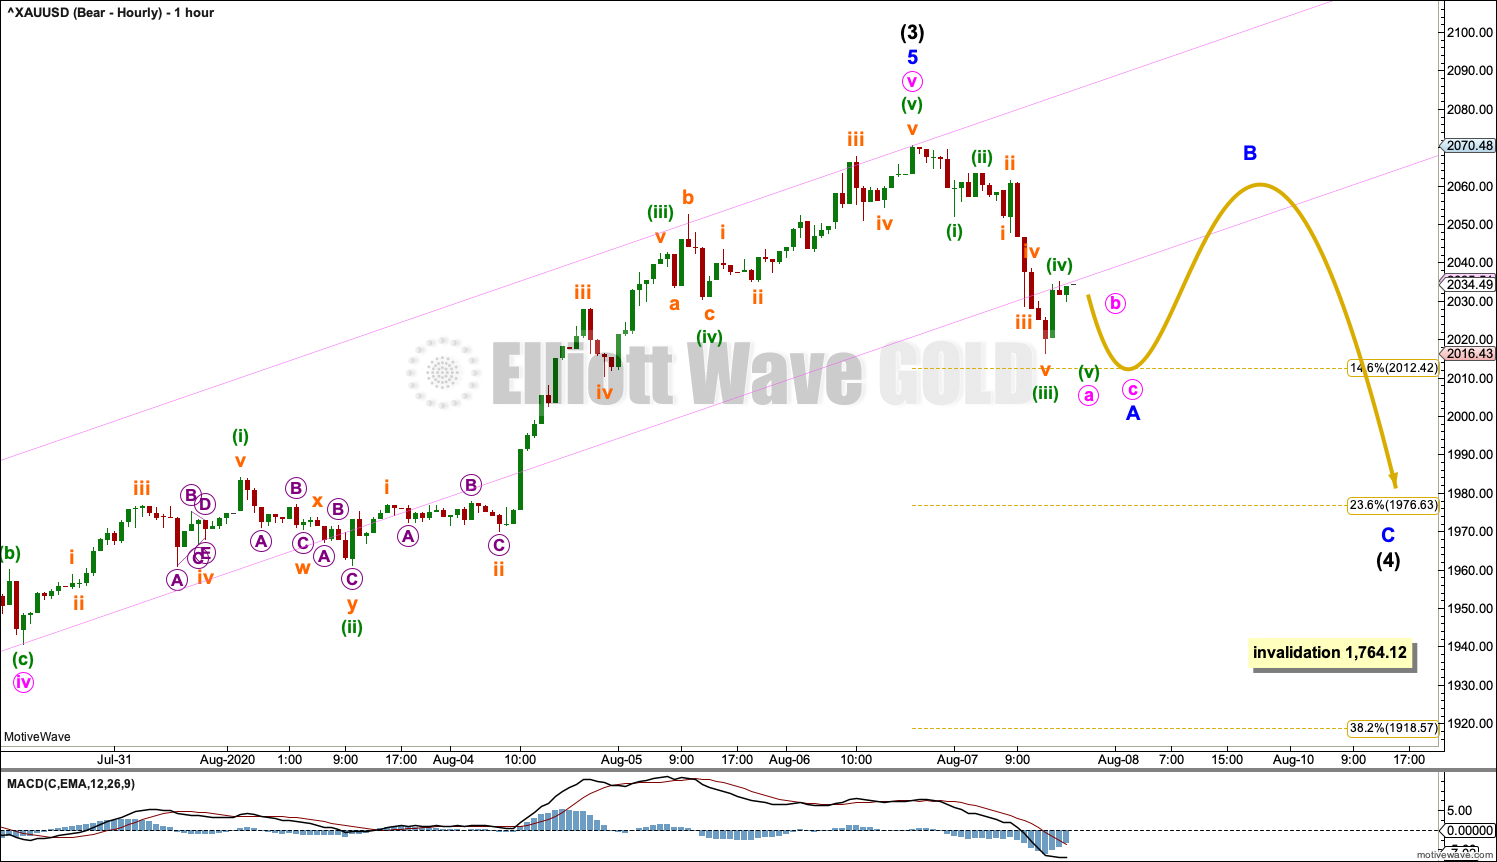
Intermediate wave (3) may now be complete. There is support for this view today from classic technical analysis.
Intermediate wave (4) would most likely unfold as one of either a flat, combination or triangle. Minor wave B of an expanded flat or running triangle within intermediate wave (4) may make a new high above the start of minor wave A at 2,070.48. Minor wave X of a combination within intermediate wave (4) may make a new high above the start of minor wave W at 2,070.48. There is no upper invalidation point for this wave count for this reason.
As intermediate wave (4) unfolds sideways over the next week or so, labelling within it may change. Focus should be on identifying when the correction may be complete and an upwards breakout may occur, rather than on identifying each small swing within the consolidation. Labelling on the hourly chart will very likely change and alternate wave counts may be required.
ALTERNATE BULLISH ELLIOTT WAVE COUNT
WEEKLY CHART
Click chart to enlarge.
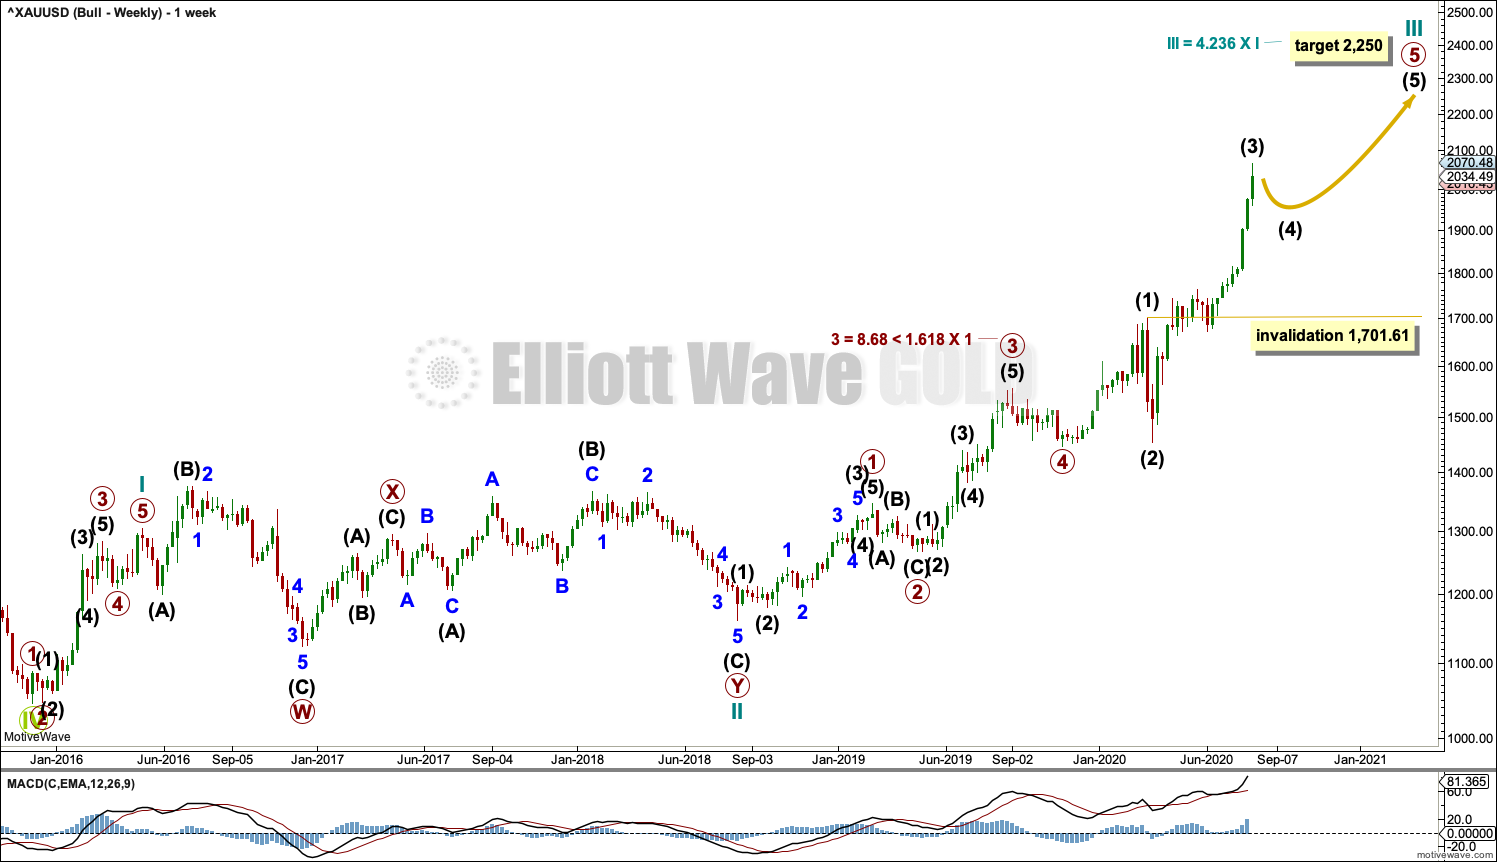
This wave count sees the the bear market complete at the last major low for Gold on 3 December 2015.
If Gold is in a new bull market, then it should begin with a five wave structure upwards on the weekly chart.
Cycle wave I fits as a five wave impulse with reasonably proportionate corrections for primary waves 2 and 4.
Cycle wave II fits as a double flat. However, within the first flat correction labelled primary wave W, this wave count needs to ignore what looks like an obvious triangle from July to September 2016 (this can be seen labelled as a triangle on the bear wave count above). This movement must be labelled as a series of overlapping first and second waves. Ignoring this triangle reduces the probability of this wave count in Elliott wave terms.
Within the first flat correction labelled primary wave W of the double flat of cycle wave II, intermediate wave (B) is 1.69 the length of intermediate wave (A). This is longer than the common range of up to 1.38, but within an allowable guideline of up to 2. The length of intermediate wave (B) reduces the probability of this wave count.
Cycle wave III may be incomplete. Cycle wave IV may not move into cycle wave I price territory below 1,303.51.
DAILY CHART
Click chart to enlarge.
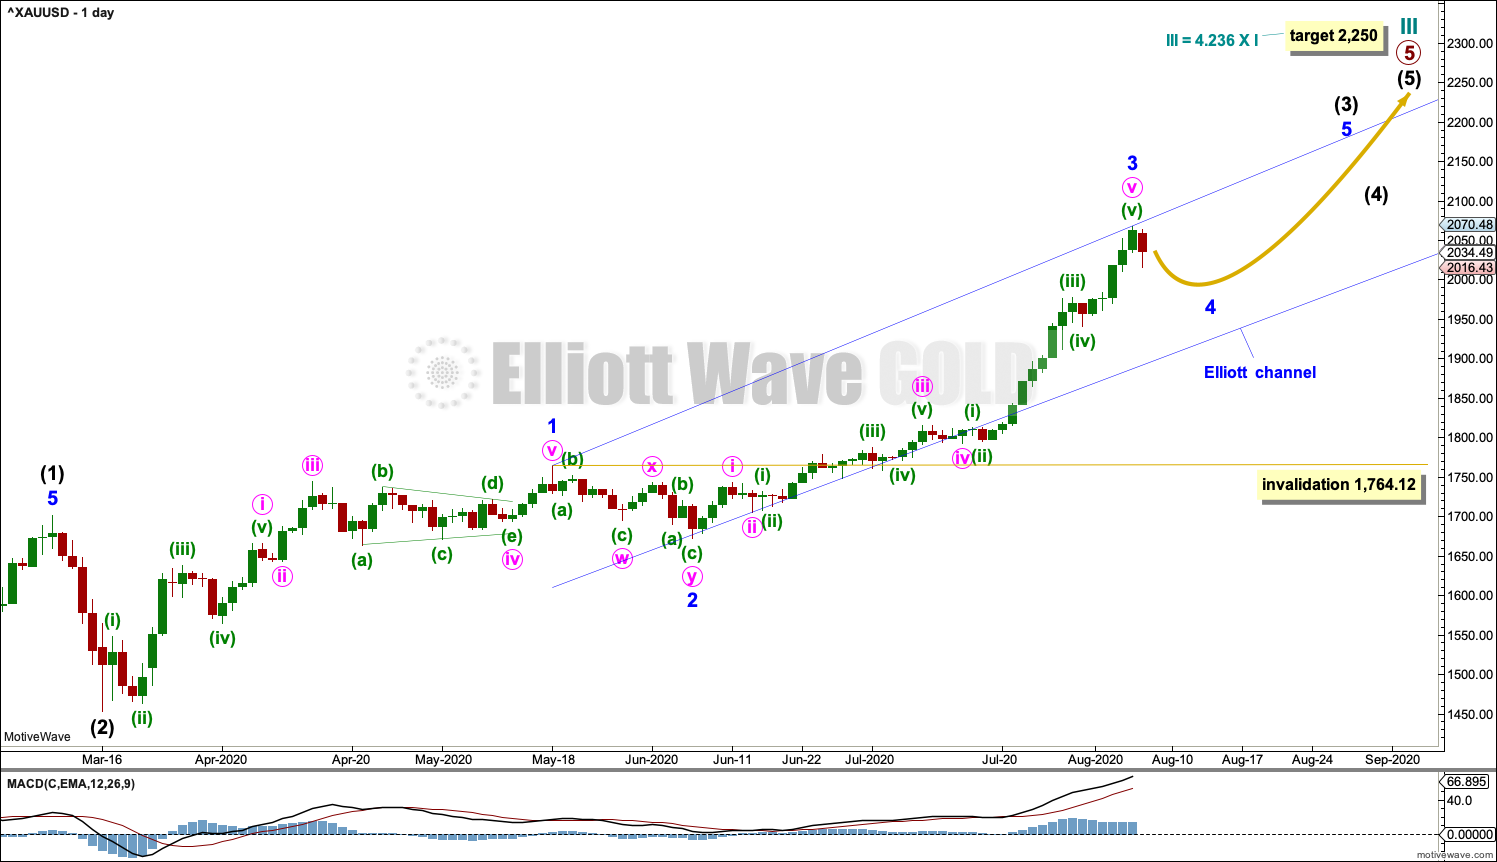
Cycle wave III may be continuing higher. The daily chart focusses on the end of primary wave 5 within cycle wave III.
Draw an Elliott channel about intermediate wave (3): draw the first trend line from the end of minor wave 1 to the end of minor wave 3, then place a parallel copy on the end of minor wave 2. Minor wave 4 may find support about the lower edge of the channel.
Minor wave 4 may not move into minor wave 1 price territory below 1,764.12.
HOURLY CHART
Click chart to enlarge.
Both hourly wave counts expect a fourth wave may have begun on Friday.
TECHNICAL ANALYSIS
WEEKLY CHART
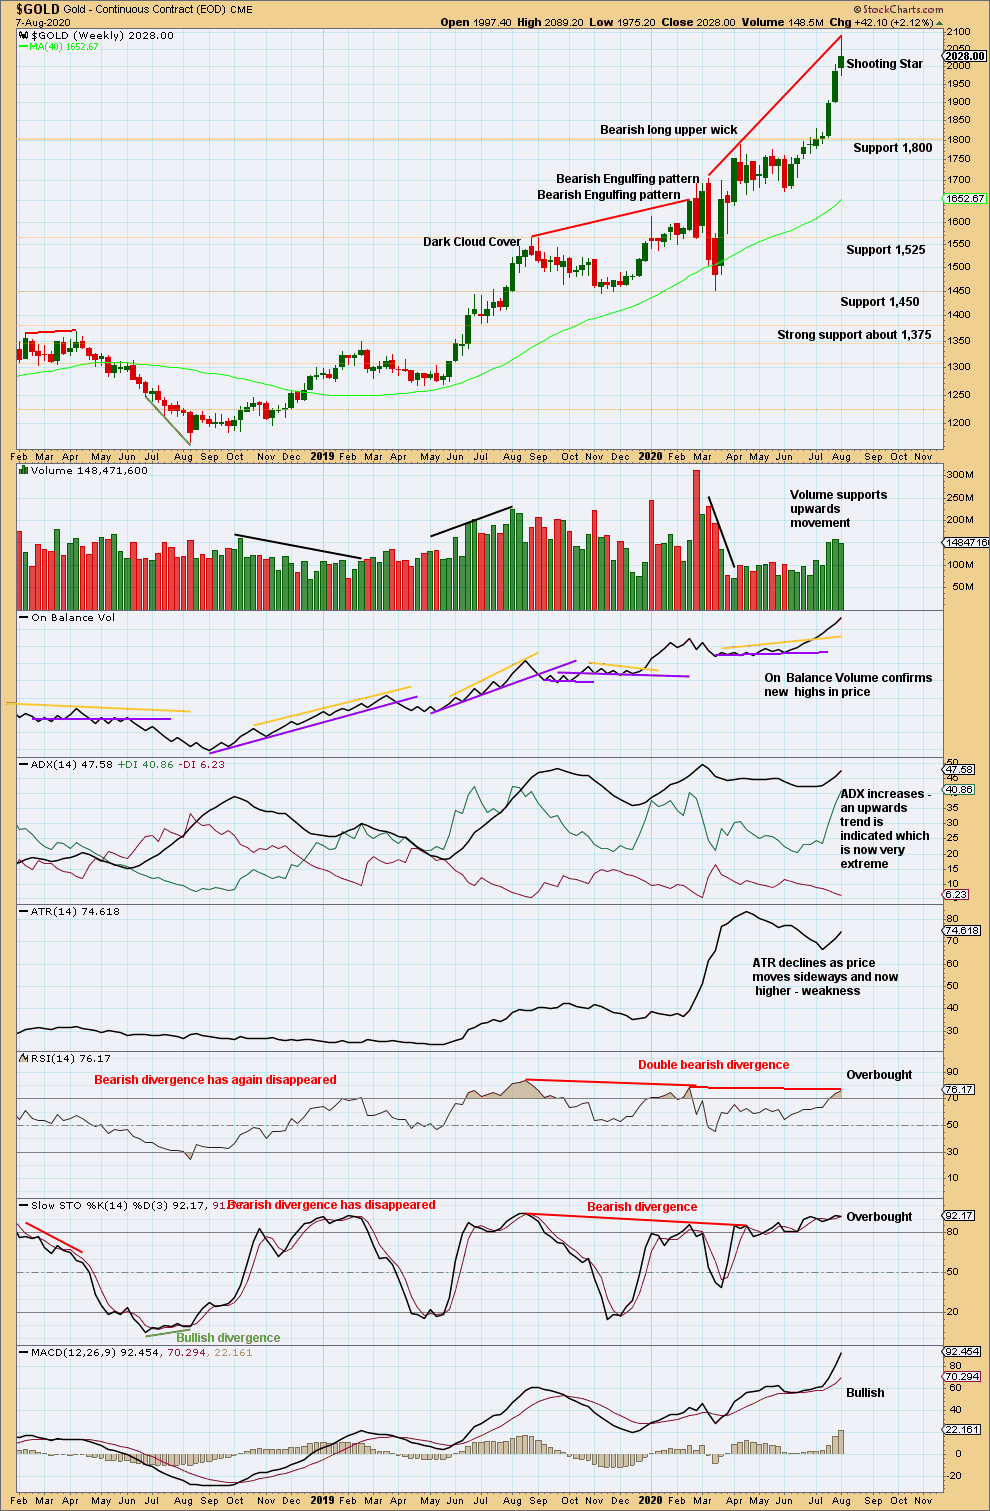
Click chart to enlarge. Chart courtesy of StockCharts.com.
The trend is very extreme and RSI is deeply overbought. The Shooting Star candlestick this week is a bearish reversal pattern that should be given weight in these conditions.
DAILY CHART
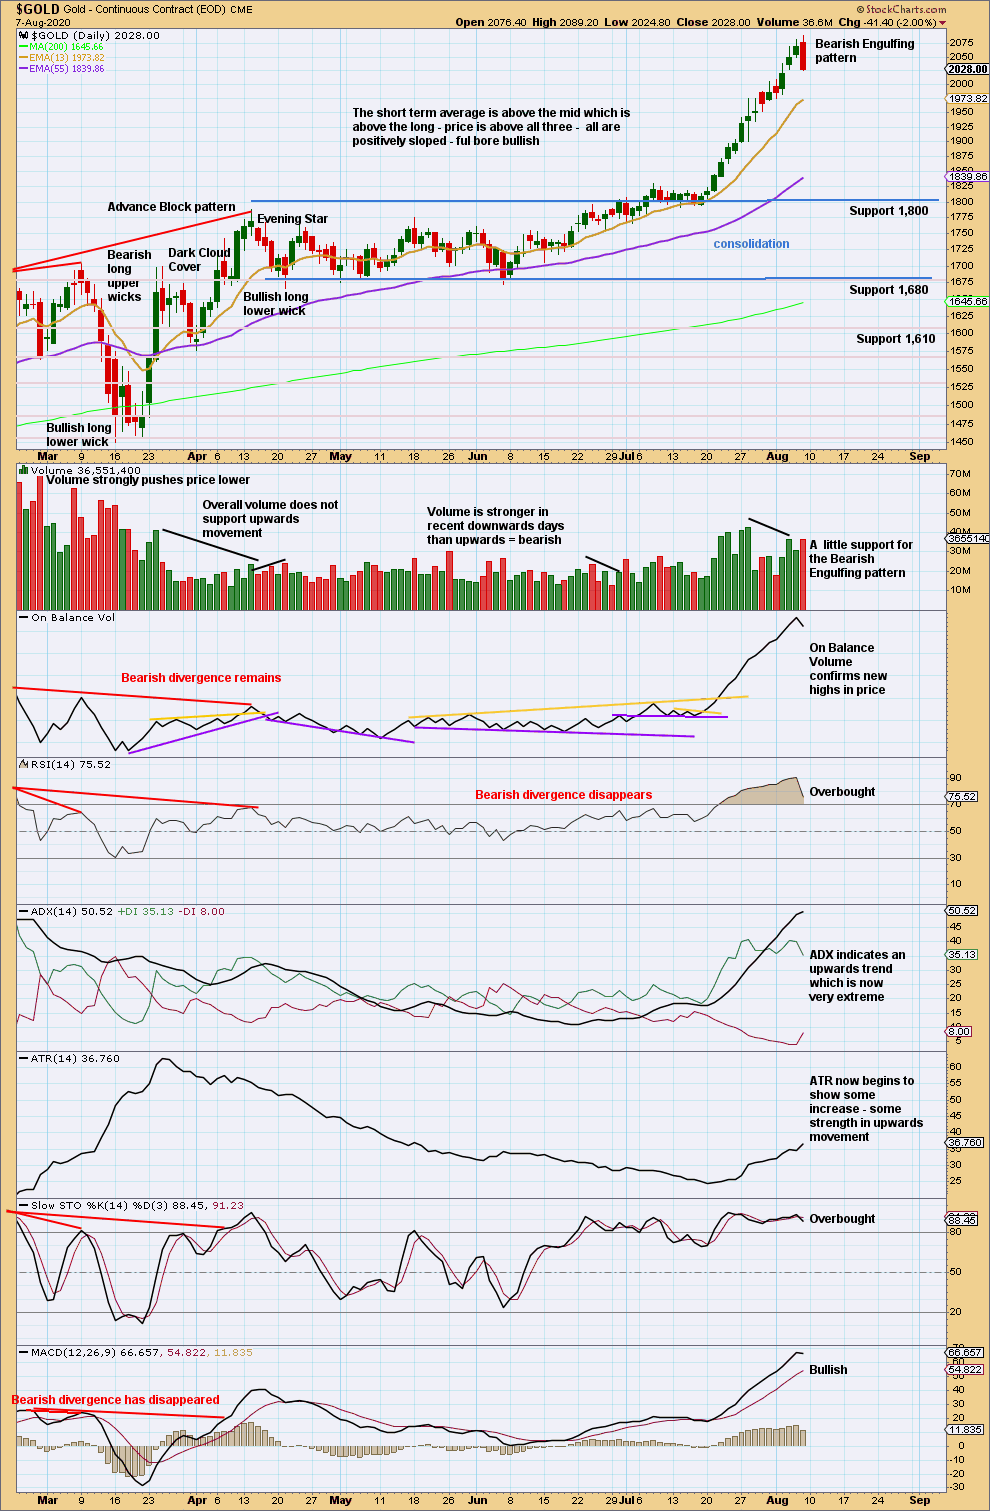
Click chart to enlarge. Chart courtesy of StockCharts.com.
ADX is very extreme and RSI has reached deeply overbought. The Bearish Engulfing candlestick pattern is strong and should be given weight in these circumstances.
GDX WEEKLY CHART
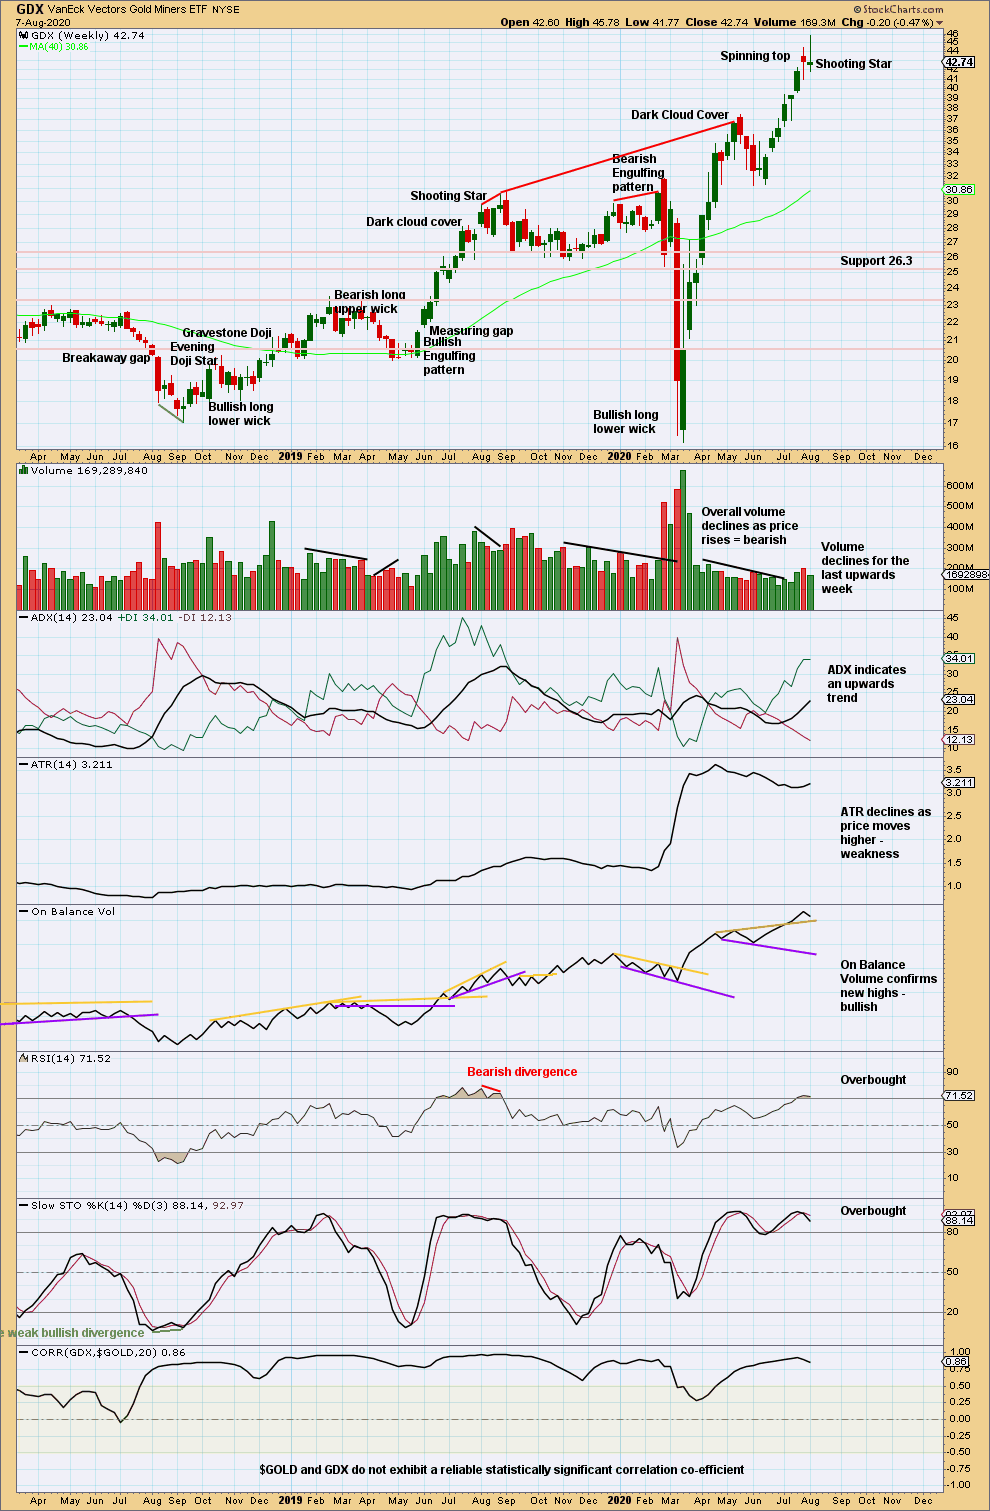
Click chart to enlarge. Chart courtesy of StockCharts.com.
A Shooting Star is a bearish reversal pattern. With RSI reaching overbought, this may indicate a trend change. A trend change may be either a 180° change or a change to a sideways consolidation.
GDX DAILY CHART
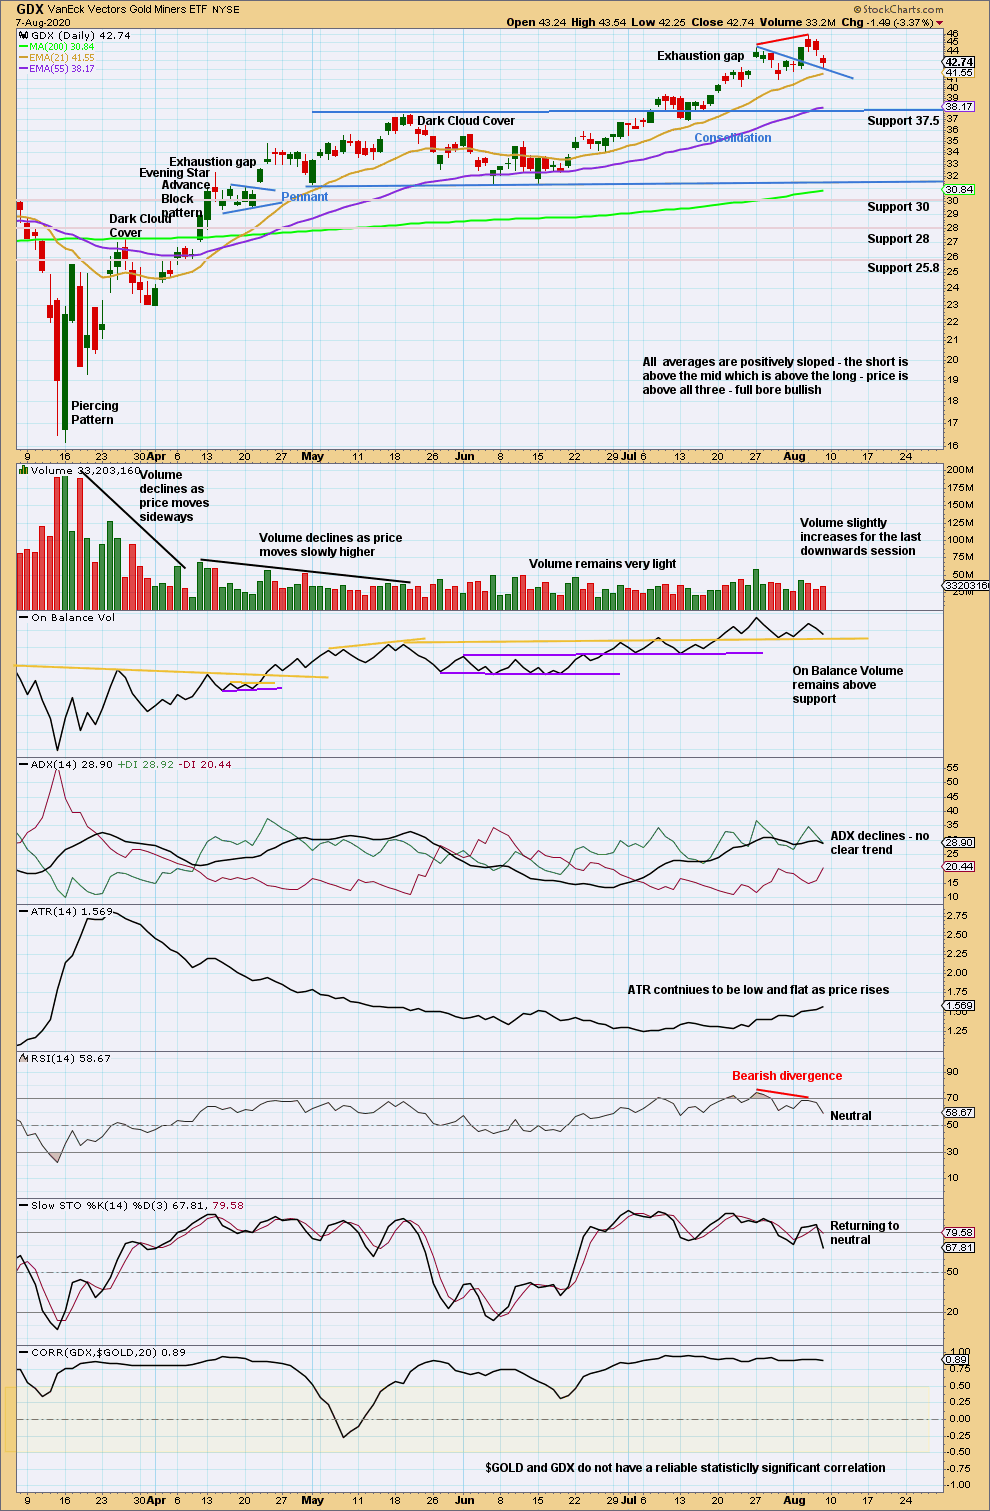
Click chart to enlarge. Chart courtesy of StockCharts.com.
Price is at support. A breach of support here would be bearish.
Published @ 08:36 p.m. ET.
—
Careful risk management protects your trading account(s).
Follow my two Golden Rules:
1. Always trade with stops.
2. Risk only 1-5% of equity on any one trade.
—
New updates to this analysis are in bold.