
GOLD: Elliott Wave and Technical Analysis | Charts – August 20, 2020
Upwards movement was expected. After a very slight new low, this is how the session continued.
The Elliott wave counts remain the same.
Summary: The pullback may be over. The upwards trend may resume.
Alternatively, it is possible that the pullback may continue lower to find support about 1,825.
The next longer-term target is now at 2,180.
A new low below 1,764.12 at any time frame would invalidate the first daily chart and add confidence in an alternate bearish wave count. At that stage, a sustainable high would be in place and either a cycle degree fourth wave or a Super Cycle degree C wave down may be underway.
Grand SuperCycle analysis is here.
Last analysis of monthly charts is here with video here.
FIRST ELLIOTT WAVE COUNT
WEEKLY CHART
Click chart to enlarge.
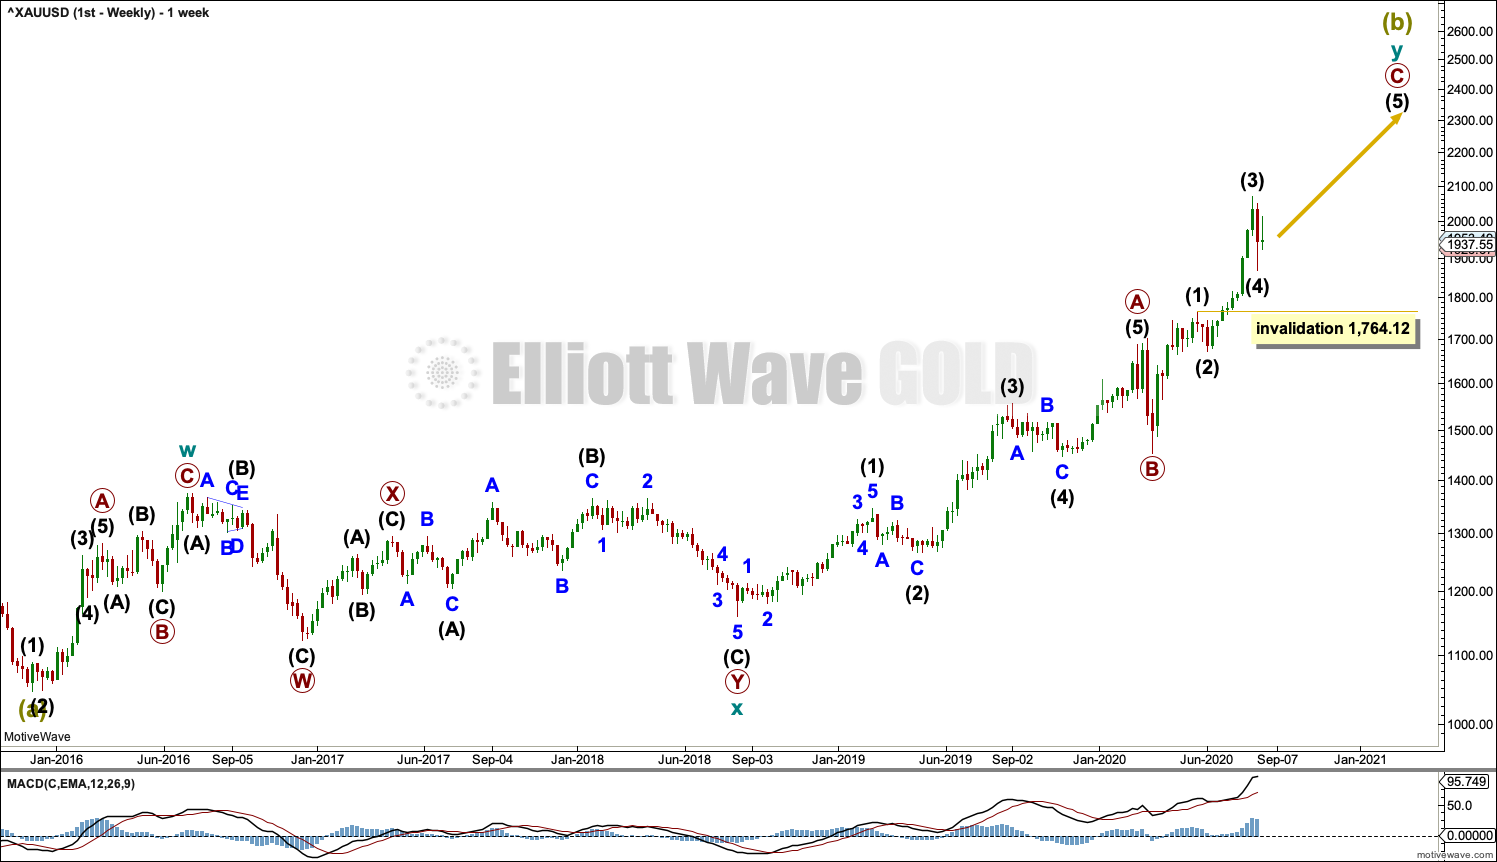
The bigger picture for this first Elliott wave count sees Gold as still within a bear market, in a three steps back pattern that is labelled Grand Super Cycle wave IV on monthly charts. The common range for Super Cycle wave (b) is from 1 to 1.38 times the length of Super cycle wave (a), giving a range from 1,920.18 to 2,252.27. The target would see Super Cycle wave (b) end within this most common range.
Super Cycle wave (b) within Grand Super Cycle wave IV may be an incomplete double zigzag. When Super Cycle wave (b) may be complete, then this wave count expects Super Cycle wave (c) to begin and to move price below the end of Super Cycle wave (a) at 1,046.27.
The first zigzag in the double is labelled cycle wave w. The double is joined by a three in the opposite direction, a combination labelled cycle wave x. The second zigzag in the double is labelled cycle wave y.
The purpose of the second zigzag in a double is to deepen the correction. Cycle wave y has achieved this purpose.
Primary wave C within cycle wave y may be subdividing as an impulse. Intermediate waves (1) through to (4) within primary wave C may be complete. If it continues any lower, then intermediate wave (4) may not move into intermediate wave (1) price territory below 1,764.12.
We should always assume the trend remains the same until proven otherwise. At this stage, Gold is in a bull market.
DAILY CHART
Click chart to enlarge.
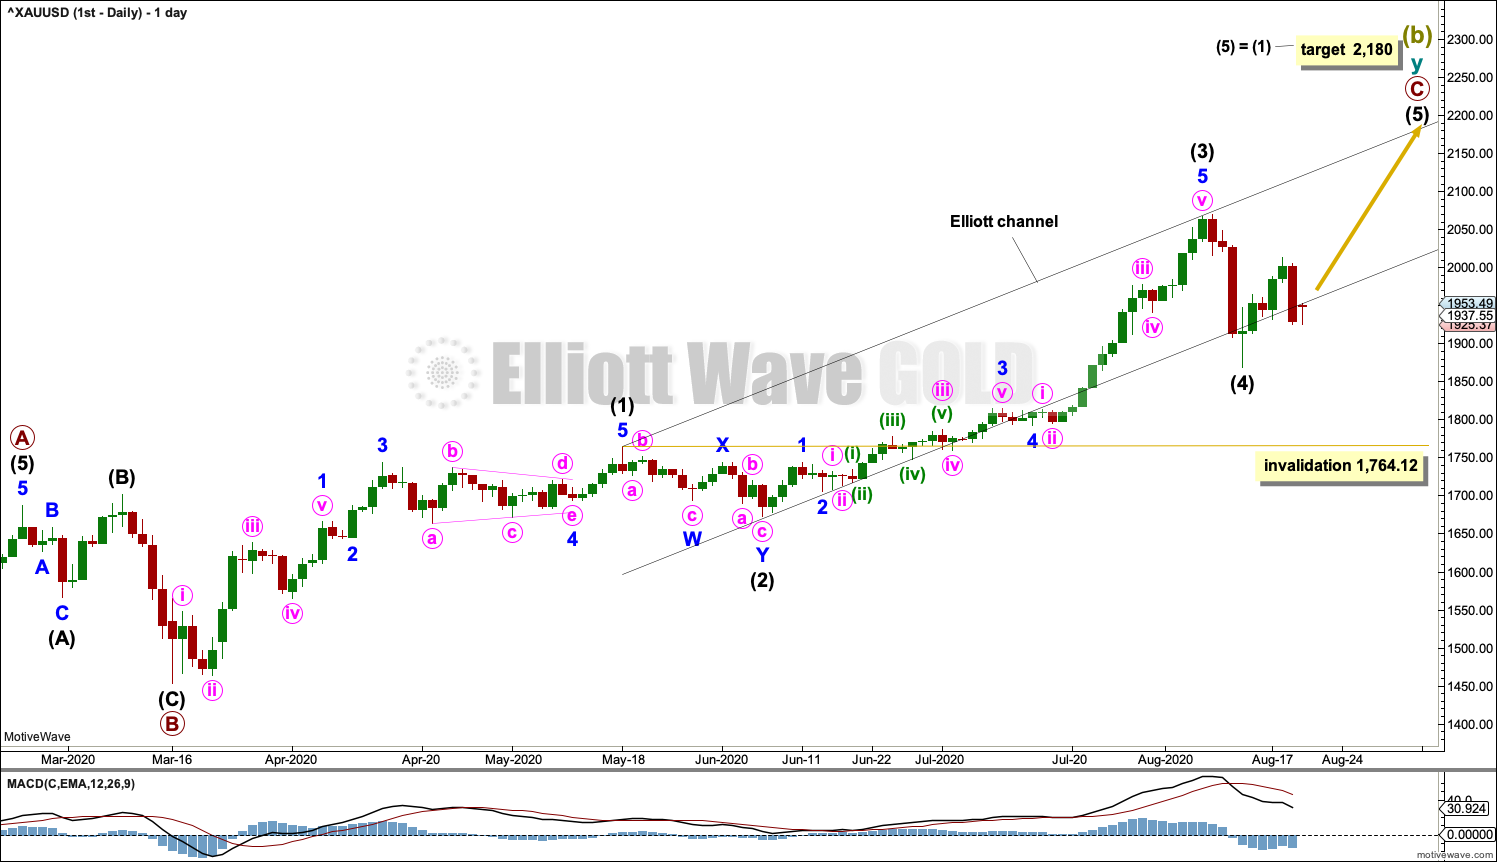
The daily chart shows detail of primary wave C as an incomplete impulse.
Intermediate waves (1) through to (4) within primary wave C may be complete.
If it continues lower, then intermediate wave (4) may not move into intermediate wave (1) price territory below 1,764.12.
Draw an Elliott channel: draw a first trend line from the end of intermediate wave (1) to the end of intermediate wave (3), then place a parallel copy on the end of intermediate wave (2). Intermediate wave (4) may have overshot the lower edge.
Intermediate wave (2) was a shallow double zigzag, lasting 15 sessions. Intermediate wave (4) may be complete as a deeper and quicker single zigzag. Fourth waves are most often more brief than their counterpart second wave corrections for this market, so it would look normal for intermediate wave (4) to be over here.
HOURLY CHART
Click chart to enlarge.
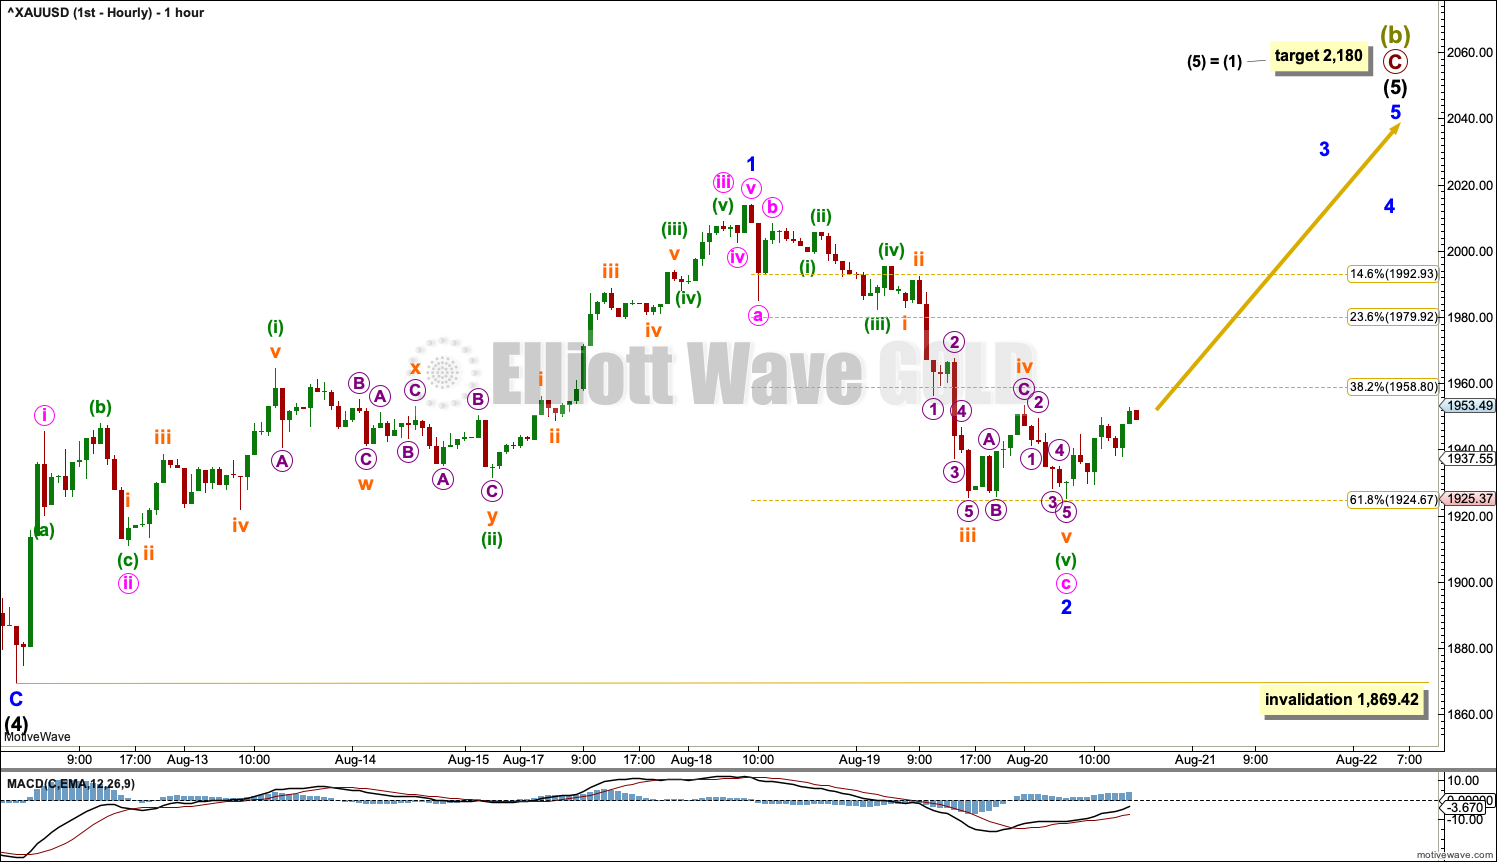
Intermediate wave (4) may be complete as a relatively quick zigzag.
Intermediate wave (5) may have begun. Intermediate wave (5) may continue for a few more weeks, and it may exhibit a slowing of momentum from intermediate wave (3).
Minor wave 1 within intermediate wave (5) may be complete.
If it continues further as a double zigzag, then minor wave 2 within intermediate wave (5) may not move beyond the start of minor wave 1 below 1,869.42. Minor wave 2 may be a complete zigzag that ended close to the 0.618 Fibonacci ratio of minor wave 1.
ALTERNATE HOURLY CHART
Click chart to enlarge.
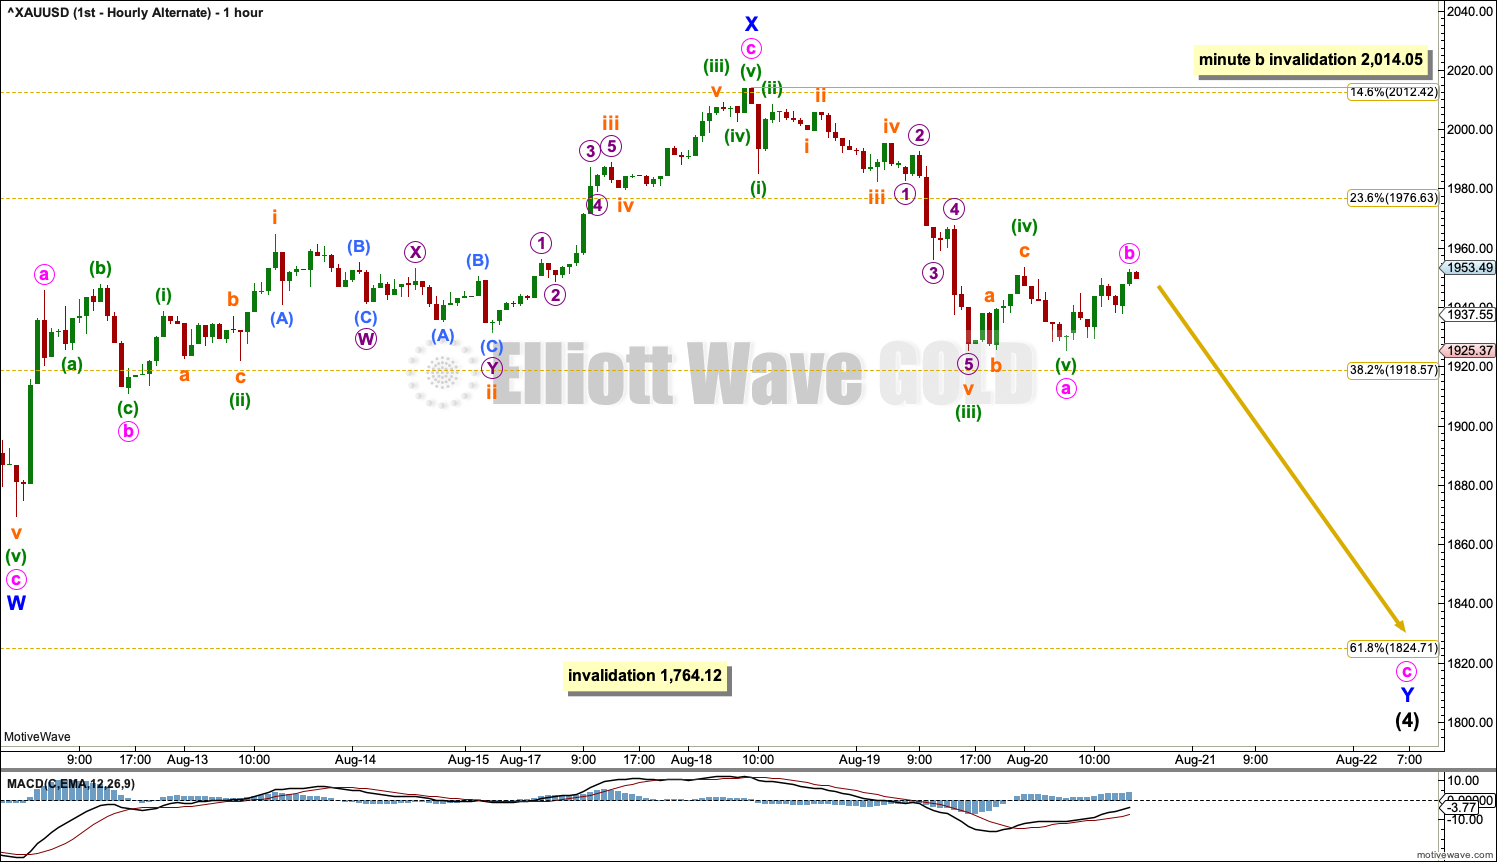
By simply moving the degree of labelling within intermediate wave (4) down one degree, it is still possible that only minor wave W may be complete.
Intermediate wave (4) may continue further as a double zigzag. Minor wave W may be a complete zigzag. Minor wave X may be a complete zigzag in the opposite direction. Minor wave Y may have begun and may continue lower to bring intermediate wave (4) down to the 0.618 Fibonacci ratio of intermediate wave (3) at 1,825. Minute wave b within minor wave Y may not move beyond the start of minute wave a above 2,014.05.
ALTERNATE DAILY CHART
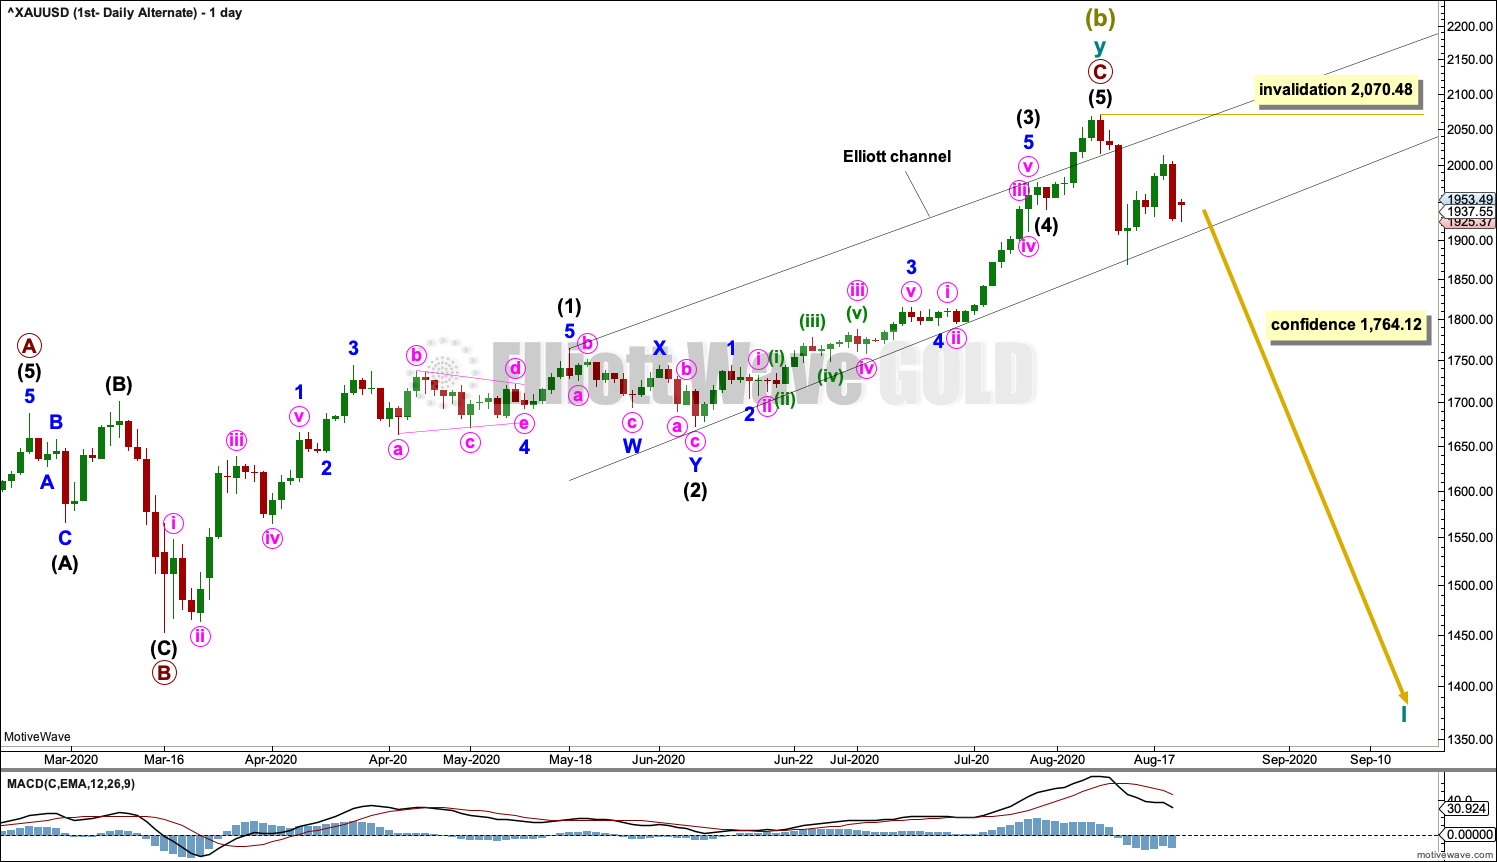
Click chart to enlarge.
It is also possible that a Super Cycle degree trend change has occurred at the last high. However, we should always assume the trend remains the same until proven otherwise. Assume the upwards trend remains in place and the main wave count is correct until the upwards trend is invalidated with a new low below 1,764.12. At that stage, this would become the main wave count.
Super Cycle wave (c) would be likely to make at least a slight new low below the end of Super Cycle wave (a) at 1,046.27 to avoid a truncation. If price provides confidence in this wave count with a new low below 1,764.12, then a target would be calculated for Super Cycle wave (c) to end.
SECOND ELLIOTT WAVE COUNT
WEEKLY CHART
Click chart to enlarge.
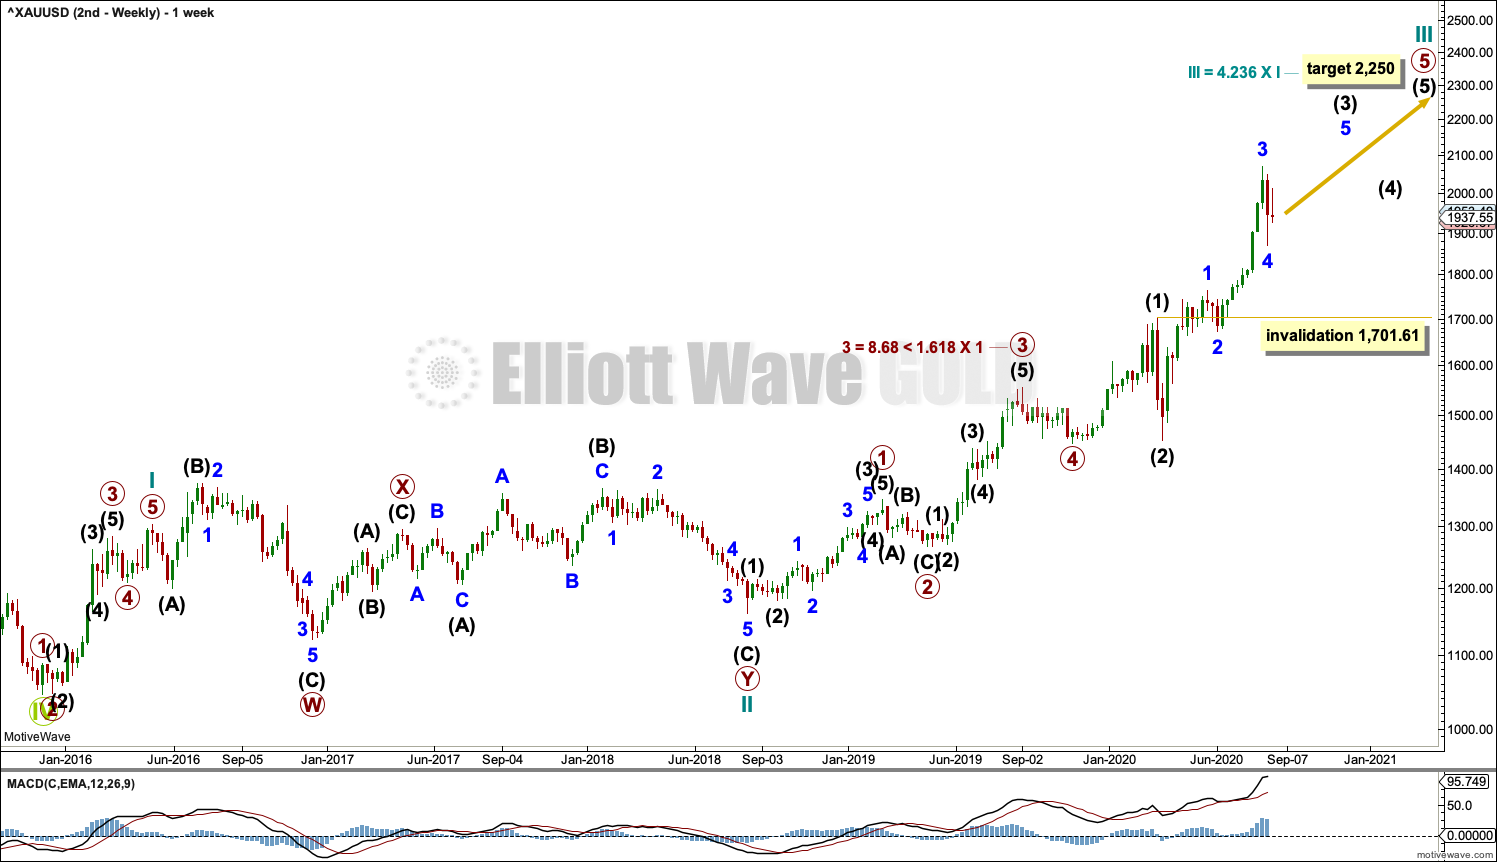
This wave count sees the the bear market complete at the last major low for Gold on 3 December 2015.
If Gold is in a new bull market, then it should begin with a five wave structure upwards on the weekly chart.
Cycle wave I fits as a five wave impulse with reasonably proportionate corrections for primary waves 2 and 4.
Cycle wave II fits as a double flat. However, within the first flat correction labelled primary wave W, this wave count needs to ignore what looks like an obvious triangle from July to September 2016 (this can be seen labelled as a triangle on the bear wave count above). This movement must be labelled as a series of overlapping first and second waves. Ignoring this triangle reduces the probability of this wave count in Elliott wave terms.
Within the first flat correction labelled primary wave W of the double flat of cycle wave II, intermediate wave (B) is 1.69 the length of intermediate wave (A). This is longer than the common range of up to 1.38, but within an allowable guideline of up to 2. The length of intermediate wave (B) reduces the probability of this wave count.
Cycle wave III may be incomplete. Cycle wave IV may not move into cycle wave I price territory below 1,303.51.
DAILY CHART
Click chart to enlarge.
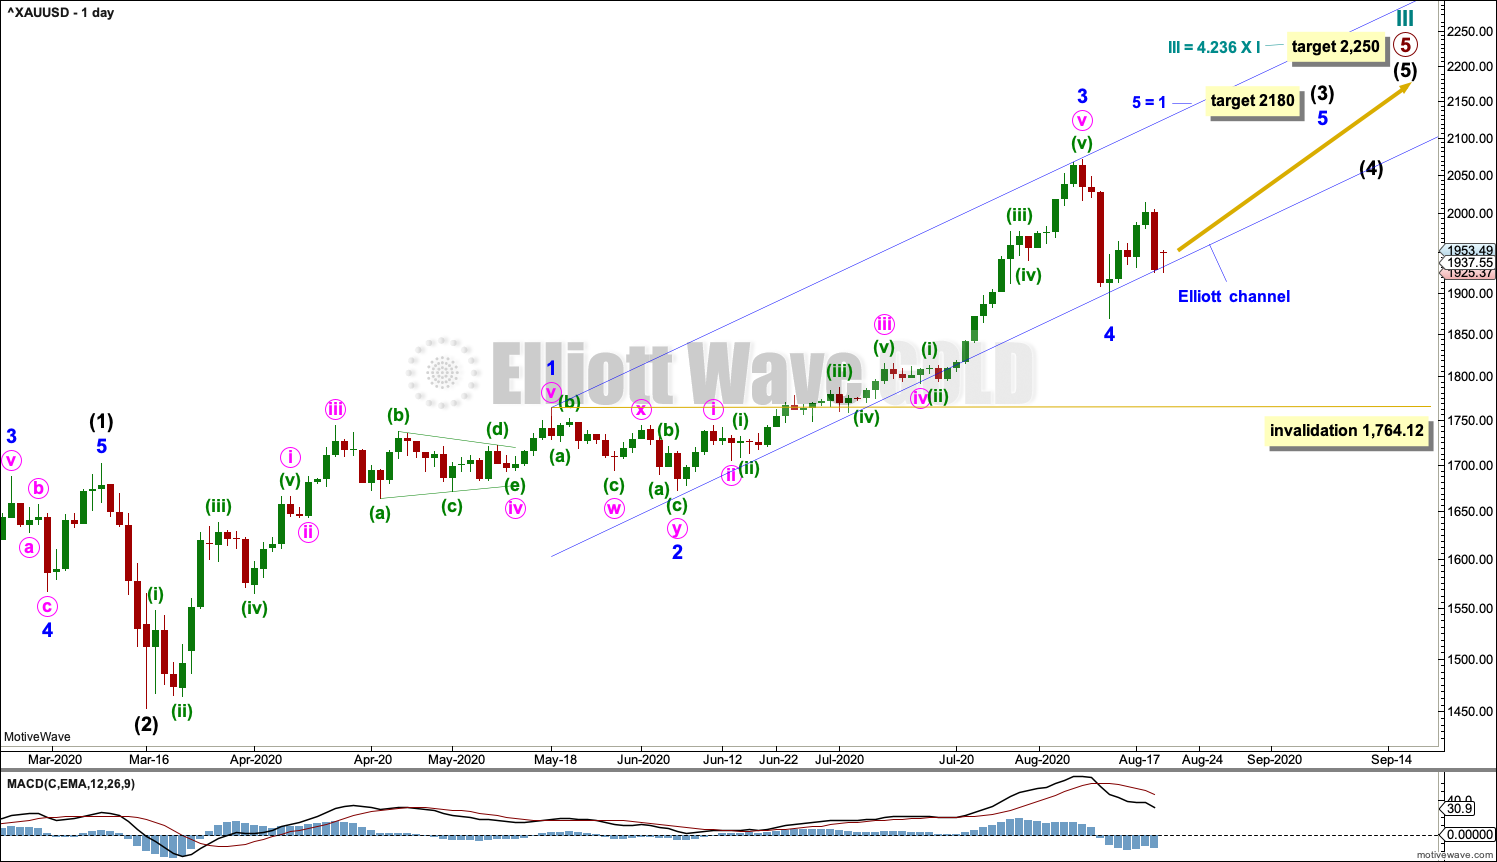
Cycle wave III may be continuing higher. The daily chart focusses on primary wave 5 within cycle wave III.
Draw an Elliott channel about intermediate wave (3): draw the first trend line from the end of minor wave 1 to the end of minor wave 3, then place a parallel copy on the end of minor wave 2. Minor wave 4 may have overshot the lower edge of the channel.
If minor wave 4 continues lower, then it may not move into minor wave 1 price territory below 1,764.12.
HOURLY CHART
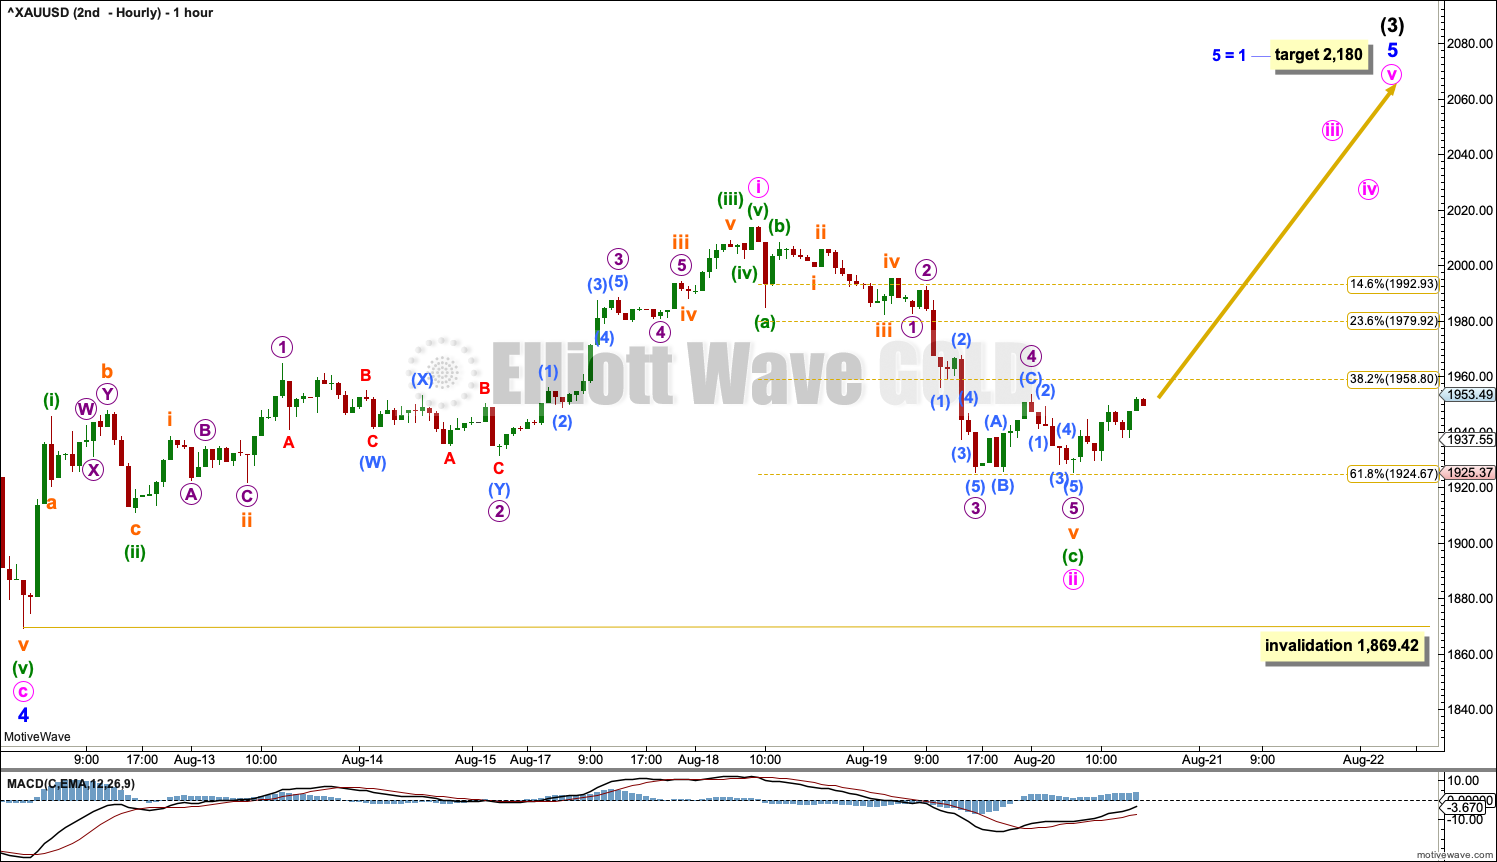
Click chart to enlarge.
Minor wave 4 may be complete. It may also continue lower as a double zigzag in the same manner as outlined in the alternate hourly chart for the first wave count.
Minor wave 5 must subdivide as a five wave structure. Minute wave i within minor wave 5 may be complete. Minute wave ii may not move beyond the start of minute wave i below 1,869.42.
TECHNICAL ANALYSIS
WEEKLY CHART
Click chart to enlarge. Chart courtesy of StockCharts.com.
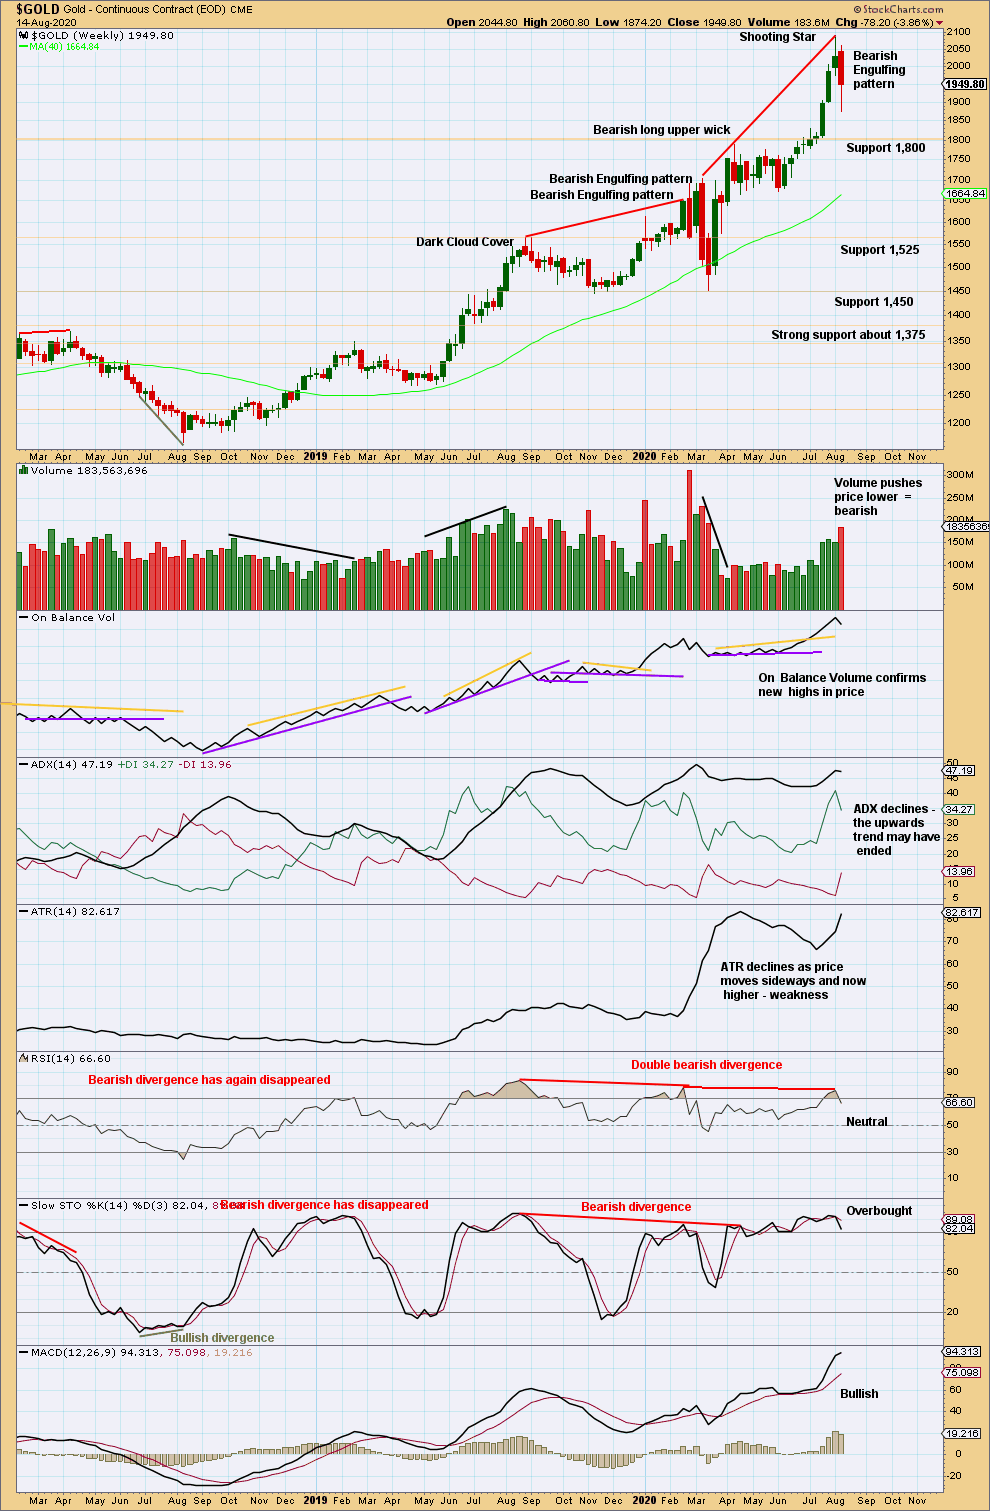
The trend is very extreme and RSI is deeply overbought. The Shooting Star candlestick last week is a bearish reversal pattern that should be given weight in these conditions.
Now a strong Bearish Engulfing candlestick pattern, which has support from volume, further supports the view that a high is in place for the mid or long term.
DAILY CHART
Click chart to enlarge. Chart courtesy of StockCharts.com.
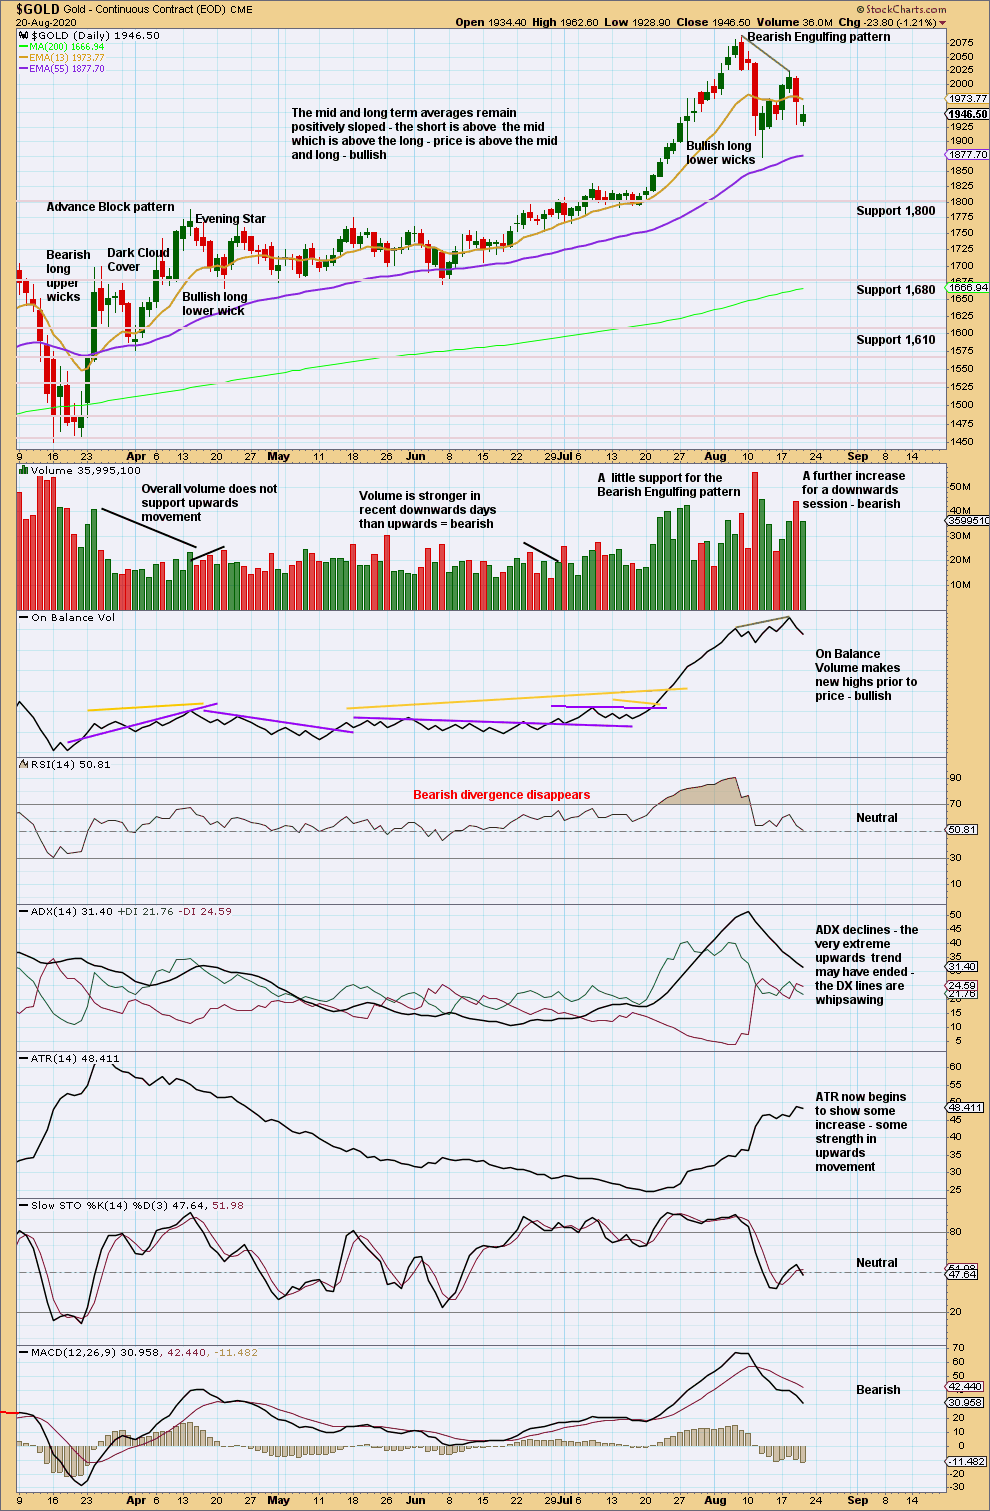
RSI is back in neutral territory, but ADX is still elevated. Look for support about 1,800 if price gets that low.
It is also possible that there has been a major trend change, which the alternate daily chart outlines.
The volume profile for the short term is bearish, which supports the alternate daily chart.
GDX WEEKLY CHART
Click chart to enlarge. Chart courtesy of StockCharts.com.
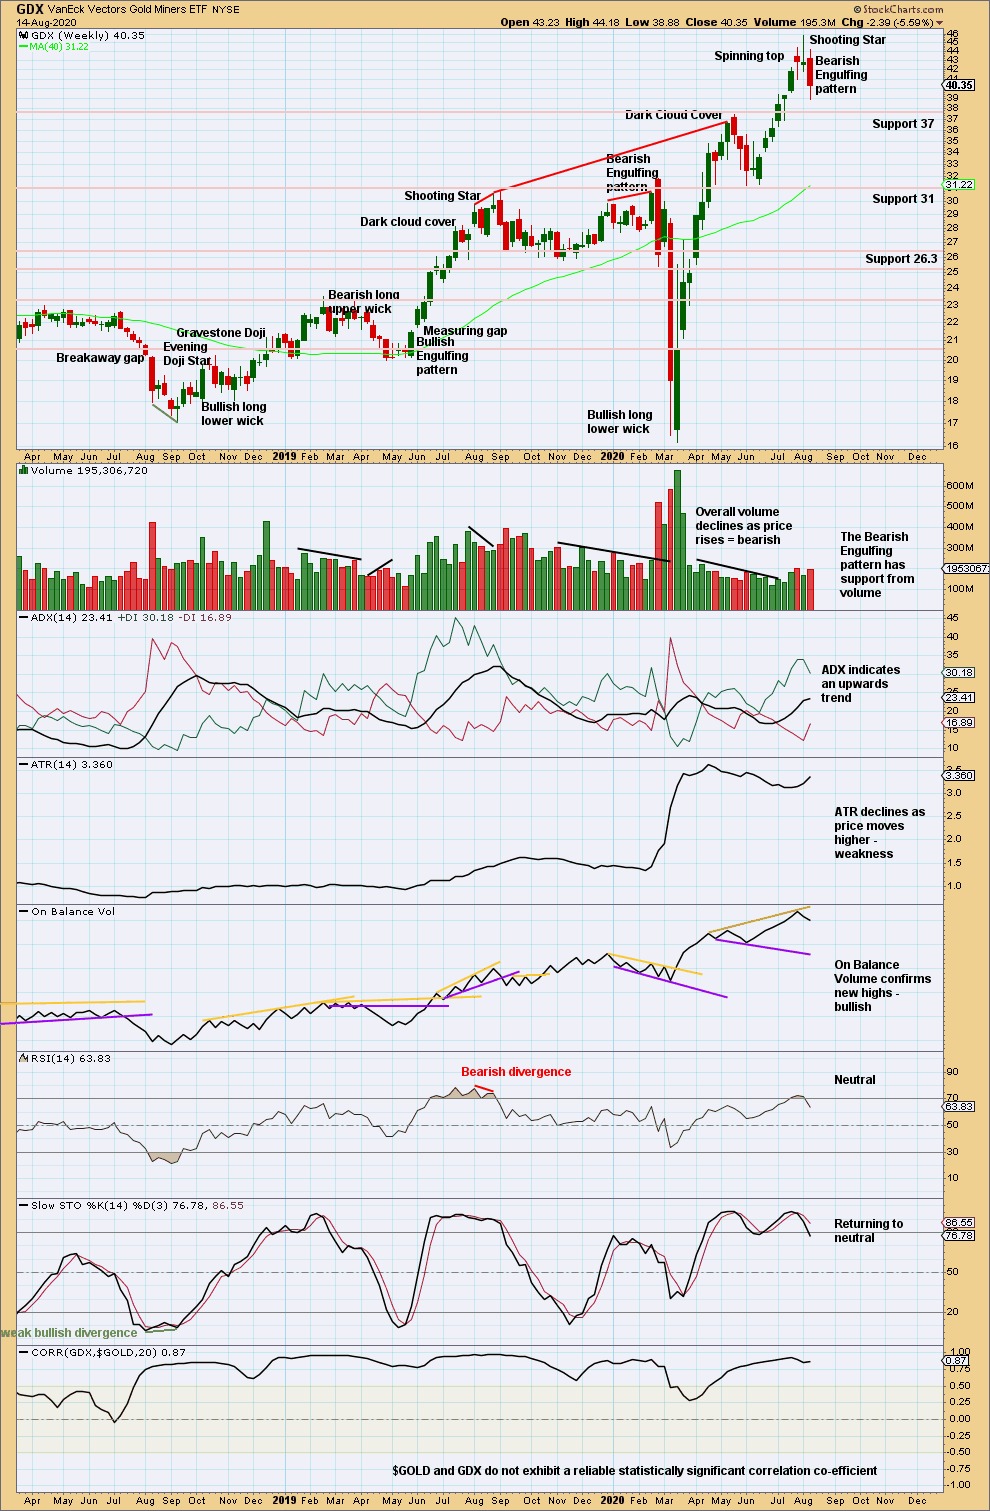
Now two bearish candlestick reversal patterns in a Shooting Star and a Bearish Engulfing pattern indicate a trend change. With RSI reaching overbought at the high, these signals should be given weight. A trend change may be either a 180° change or a change to a sideways consolidation.
GDX DAILY CHART
Click chart to enlarge. Chart courtesy of StockCharts.com.
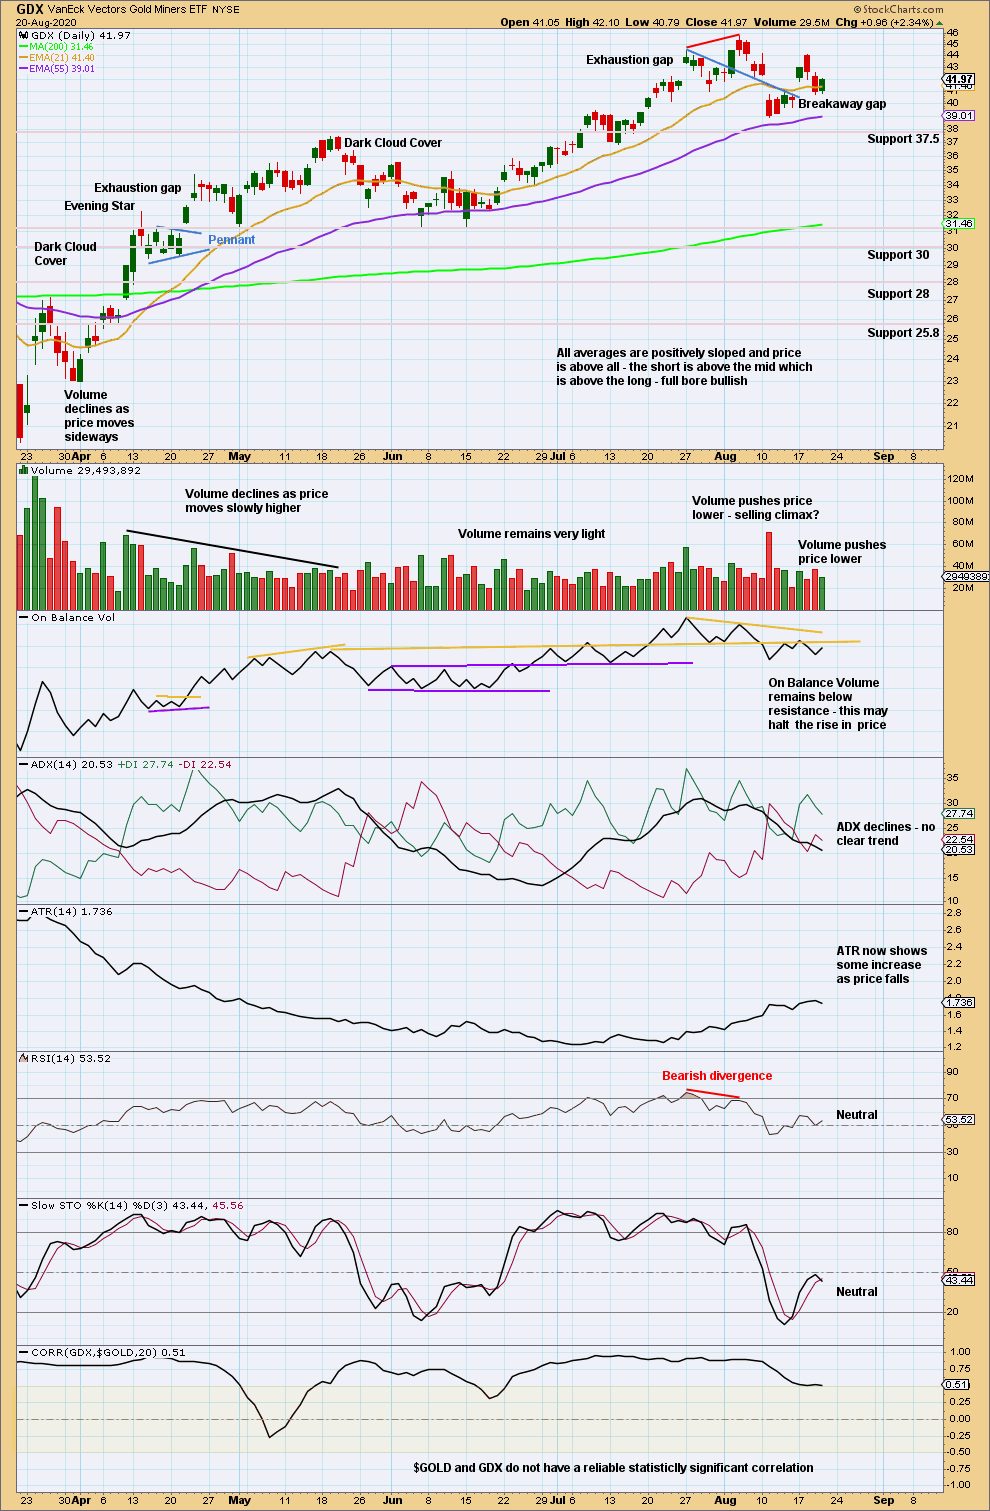
Price may have curved down to back test support about 37.50 after the upwards breakout. This would be typical behaviour.
Price has broken above resistance with a little support from volume and a breakaway gap. The gap may offer support at 40.72. This gap remains open, but only just. If this gap is closed, then it would be renamed a pattern gap. Support next below is at 37.5.
Published @ 06:25 p.m. ET.
—
Careful risk management protects your trading account(s).
Follow my two Golden Rules:
1. Always trade with stops.
2. Risk only 1-5% of equity on any one trade.
—
New updates to this analysis are in bold.