
SILVER: Elliott Wave and Technical Analysis | Charts – July 31, 2020
A blow off top was expected to be forming. The target for it to end was 25.308. The high for the week on very strong volume was at 26.080.
Summary: A blow off top has formed. A consolidation may now continue for another few sessions before price continues higher. When this consolidation is complete, then the next target may be calculated, which cannot be done yet.
The Elliott wave count is now very bullish and expects new highs substantially above 49.752 in coming years.
ELLIOTT WAVE COUNT
MONTHLY CHART
Click chart to enlarge.
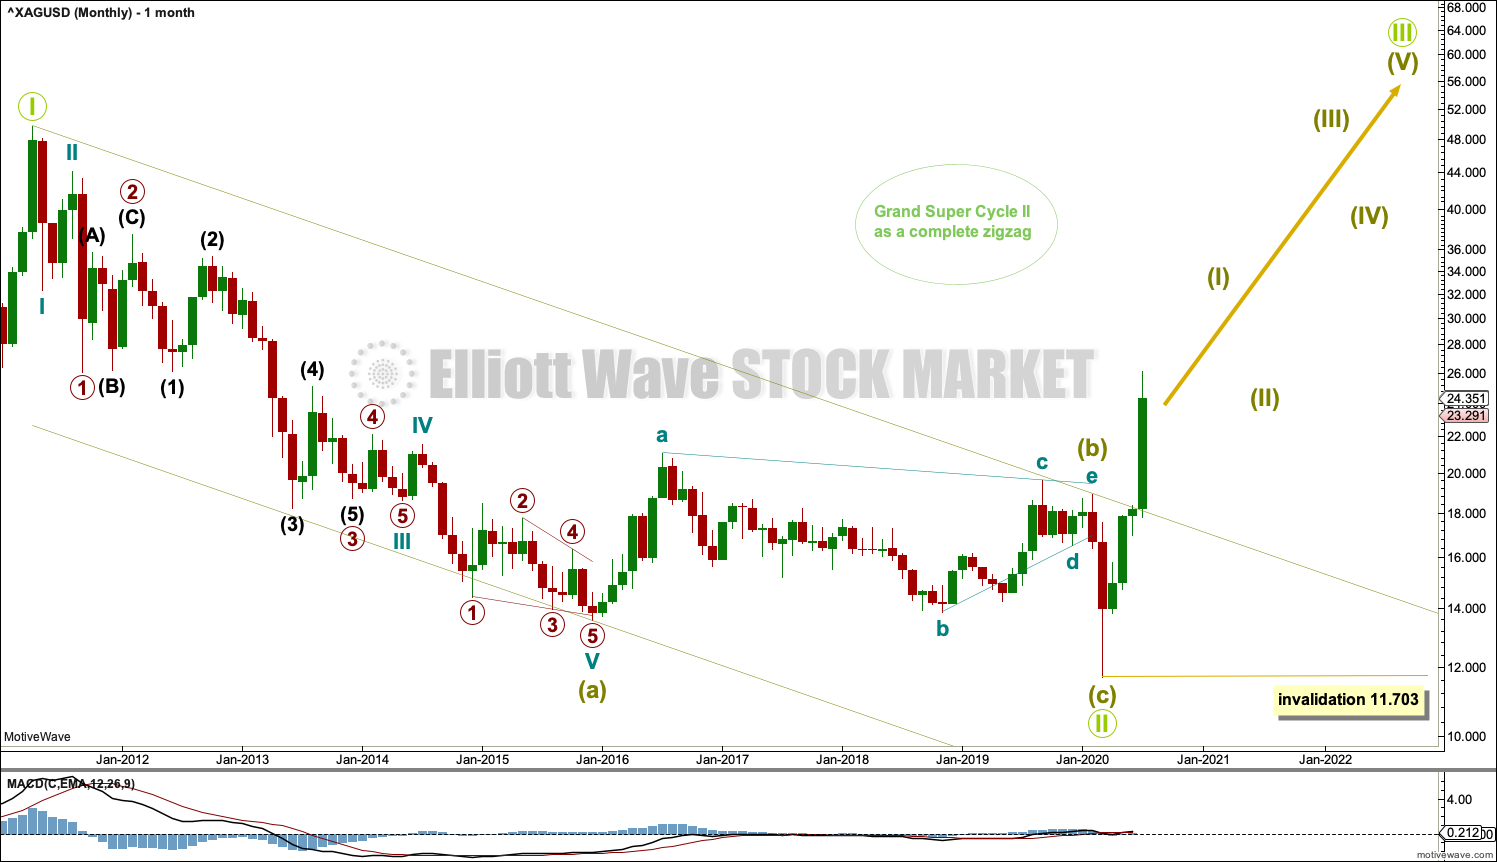
The bear market for Silver may be complete. A new high above 18.920 adds further confidence to this view.
This Elliott wave structure for this bear market is labelled as a single zigzag for Grand Super Cycle wave II. Single zigzags are the most common Elliott wave corrective structure.
Within the zigzag: Super Cycle wave (a) subdivides as a five wave impulse, Super Cycle wave (b) subdivides as a complete regular contracting triangle, and Super Cycle wave (c) subdivides as a complete five wave impulse that is relatively brief and shallow.
Draw a channel about the entire bear market of Grand Super Cycle wave II as shown. A breach of the upper edge of this channel would add confidence to this wave count. Price may have found resistance at the upper edge of this channel, which may have initiated a pullback.
When charts are drawn on a semi-log scale, price has now breached the upper edge of the trend channel. Copy this channel over to weekly and daily charts. The upper edge of this channel may now provide support.
Grand Super Cycle wave III must subdivide as a five wave impulse at Super Cycle degree.
WEEKLY CHART
Click chart to enlarge.
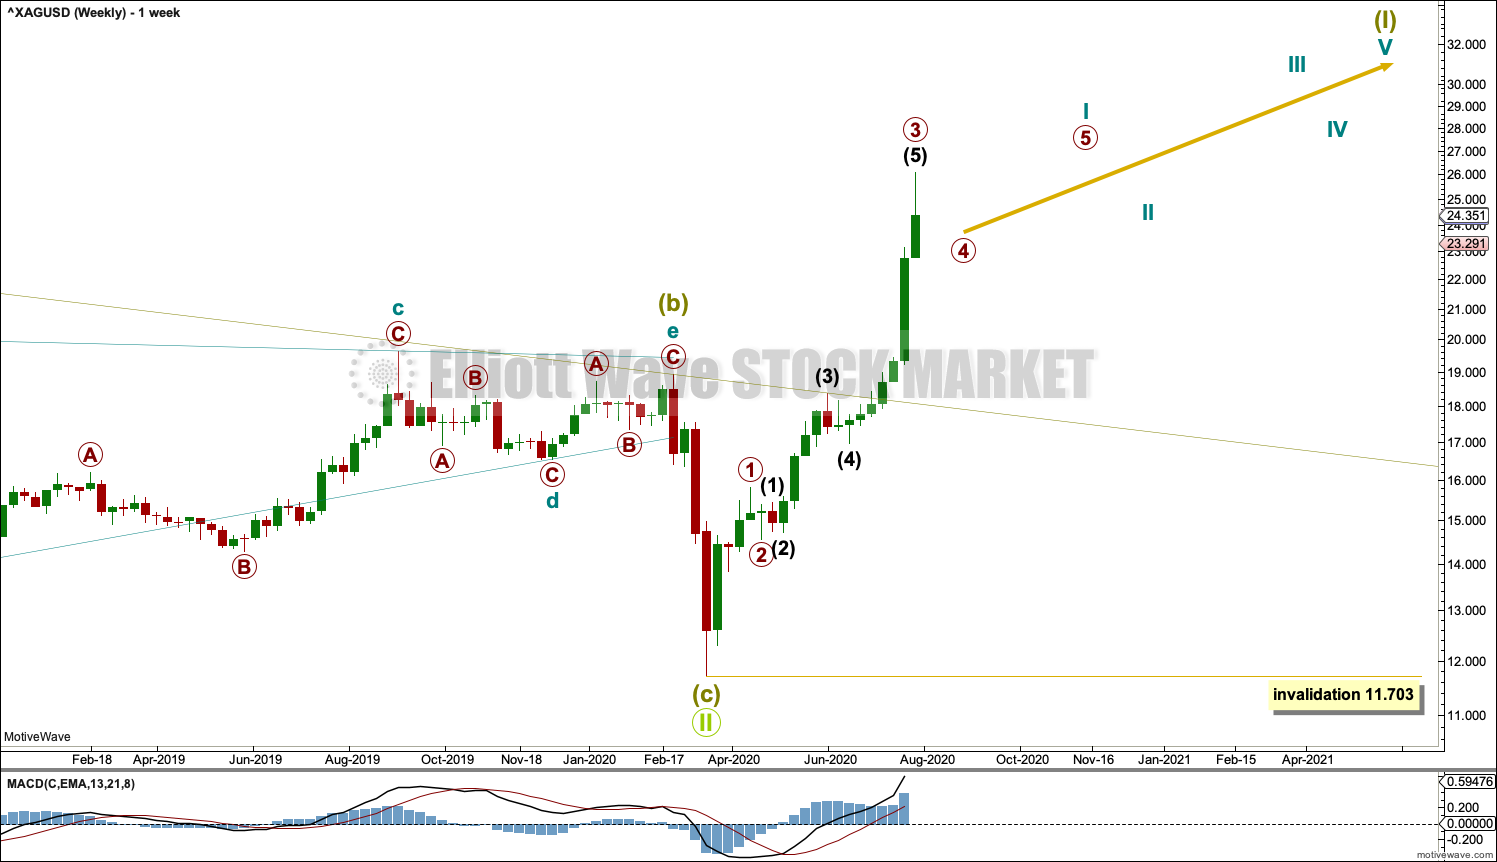
Grand Super Cycle wave II may be a complete zigzag. A new bull market may have begun for Silver.
The channel about Grand Super Cycle wave II is copied over from the monthly chart and extended outwards.
Super Cycle wave (I) may subdivide as an impulse or a leading diagonal. An impulse is much more common, so that is what shall be expected unless overlapping suggests a diagonal should be considered.
Cycle wave II may not move beyond the start of cycle wave I below 11.703.
DAILY CHART
Click chart to enlarge.
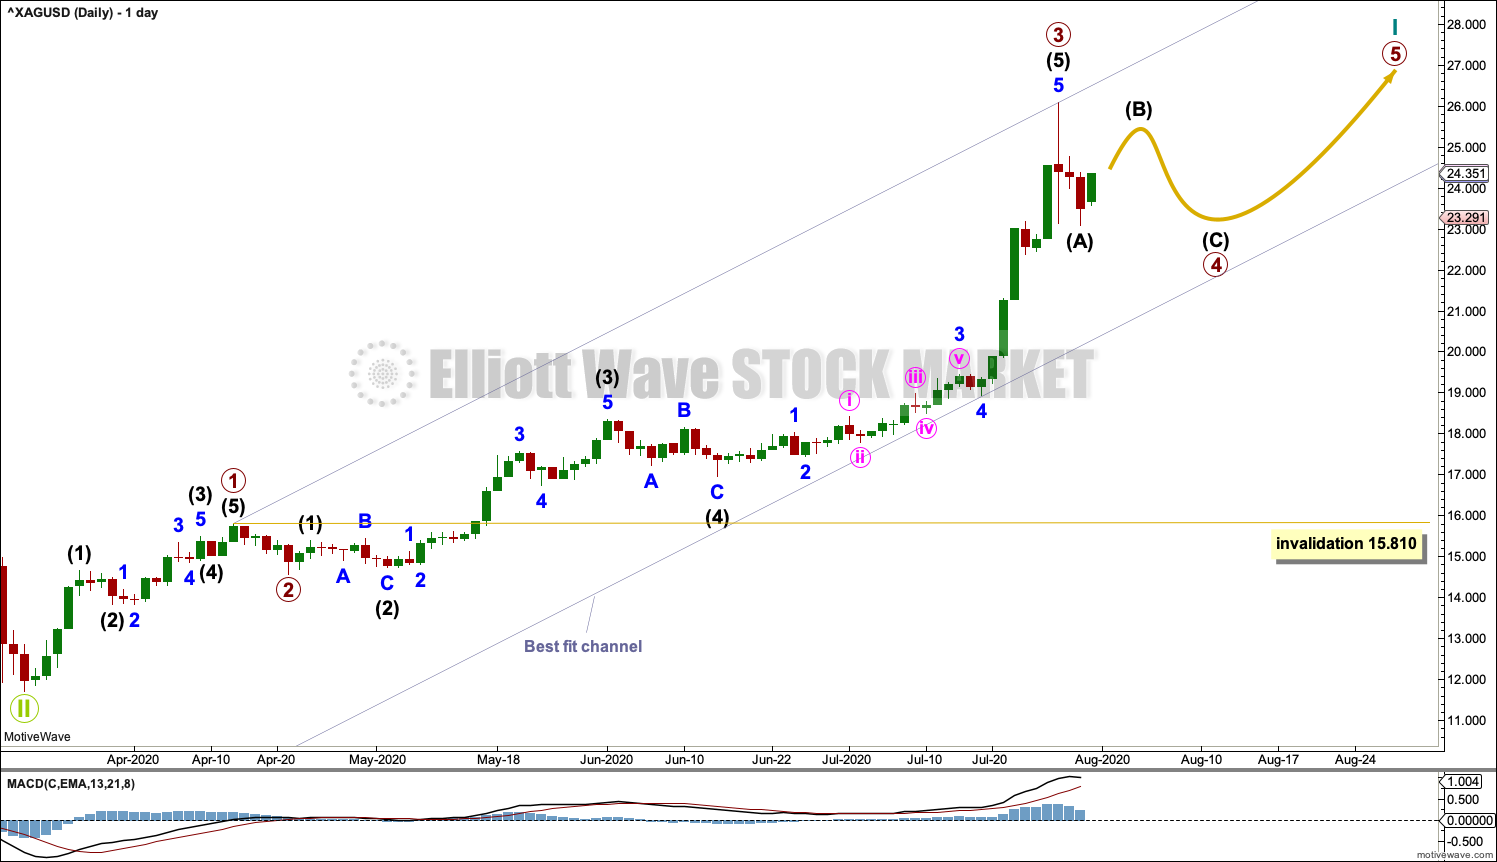
Cycle wave I may be an incomplete five wave impulse. Primary waves 1 through to 3 may be complete.
Primary wave 2 was a quick zigzag, lasting 5 sessions. For proportion and to relieve extreme conditions, primary wave 4 in this instance may be longer lasting; it may last about two weeks. Primary wave 4 may find support about the lower edge of the best fit channel, but it may not reach that low or be that time consuming.
When primary wave 4 may be complete, then the Fibonacci ratio between primary waves 1 and 3 may be used to calculate a target for primary wave 5 to complete the impulse of cycle wave I. That cannot be done until the starting point of primary wave 5 is known.
Primary wave 4 may not move into primary wave 1 price territory below 15.810.
TECHNICAL ANALYSIS
WEEKLY CHART
Click chart to enlarge. Chart courtesy of StockCharts.com.
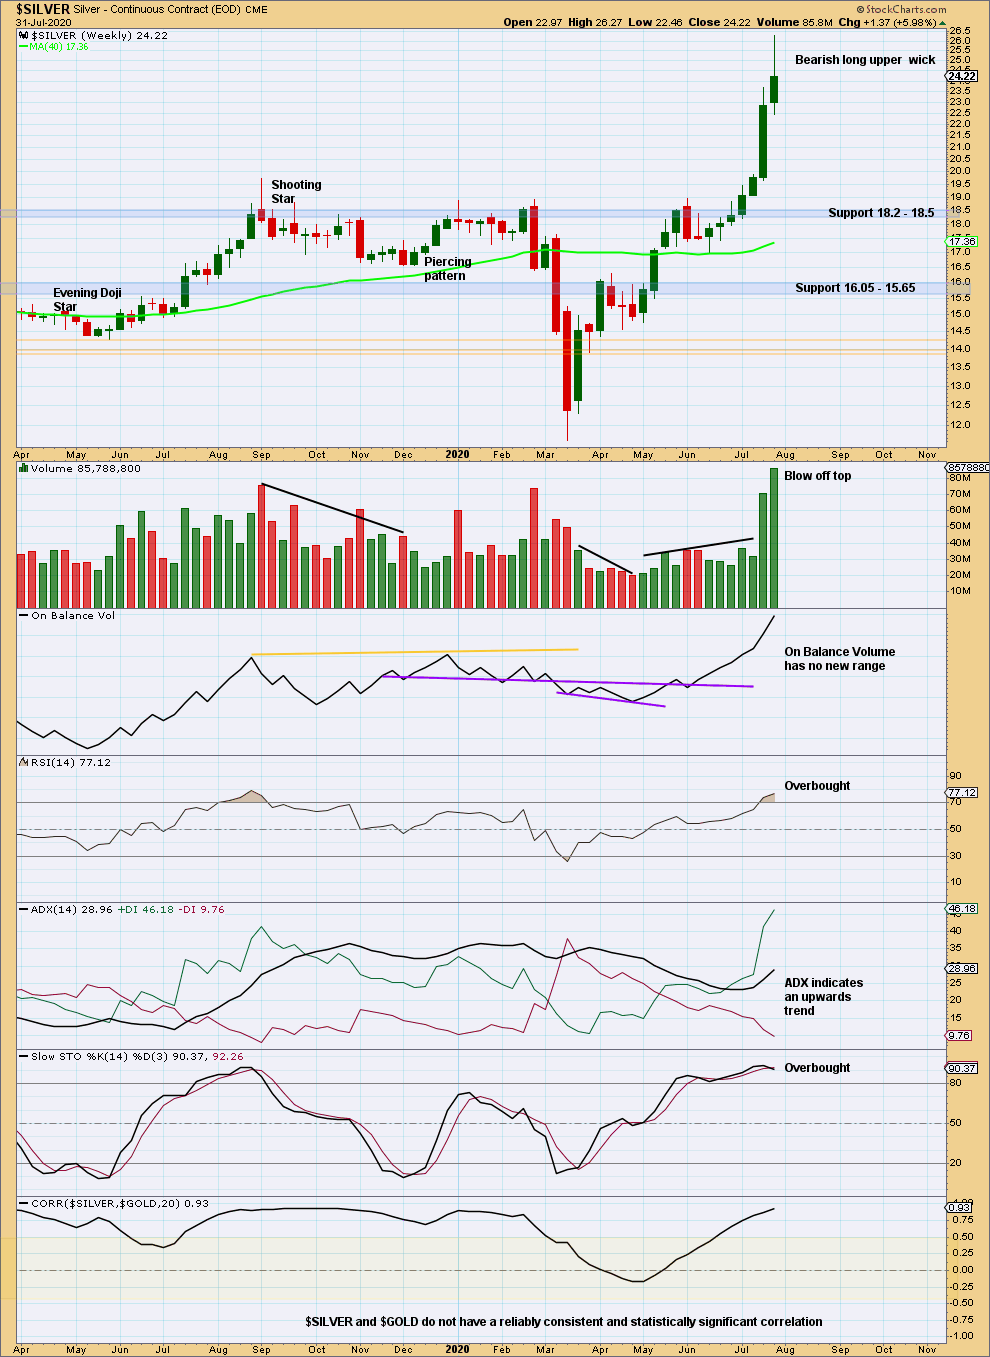
A long upper wick with strong volume suggests a blow off top may have formed and may be over this week. If it is not over this week, then it may be over next week. RSI at overbought supports this view.
DAILY CHART
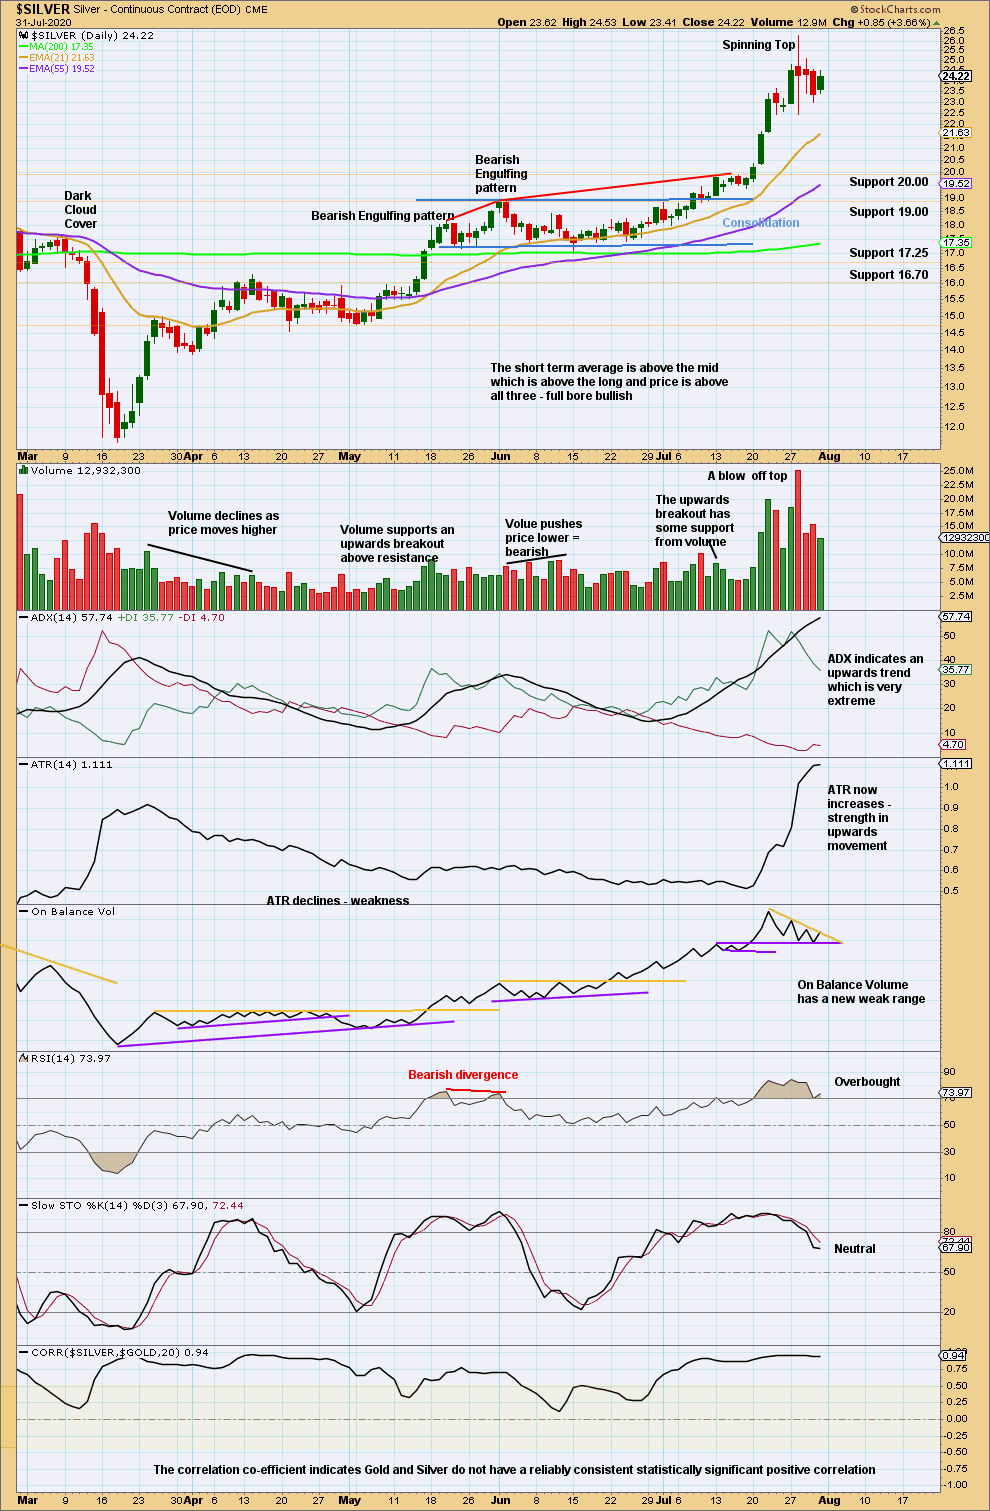
Click chart to enlarge. Chart courtesy of StockCharts.com.
Extreme ADX, overbought RSI, and a Spinning Top candlestick pattern all suggest a blow off top has formed and is complete. Some consolidation over a few days to a week or two may now be expected, before new highs.
Blow off tops are not usually the end of a trend. They often form just before the last consolidation within a strong trend.
Published @ 08:18 a.m. ET on August 2, 2020.
—
Careful risk management protects your trading account(s).
Follow my two Golden Rules:
1. Always trade with stops.
2. Risk only 1-5% of equity on any one trade.
—
New updates to this analysis are in bold.