
US OIL: Elliott Wave and Technical Analysis | Charts – August 21, 2020
A very small range week moved price higher, which did not make a new swing high.
Both Elliott wave counts remain valid.
Summary: Oil may have found a major sustainable low.
A slow rounded top may still be forming. The rounded top may take a few more weeks of sideways and slowly lower movement before it gathers any strength.
A pullback is still expected. The pullback may end about 27.59. It is possible the pullback may be deeper than this though; the first major correction within a new trend for Oil tends to be very deep.
When this pullback may be complete, then an upwards trend should resume with increased strength.
ELLIOTT WAVE COUNT
MONTHLY CHART
Click chart to enlarge.
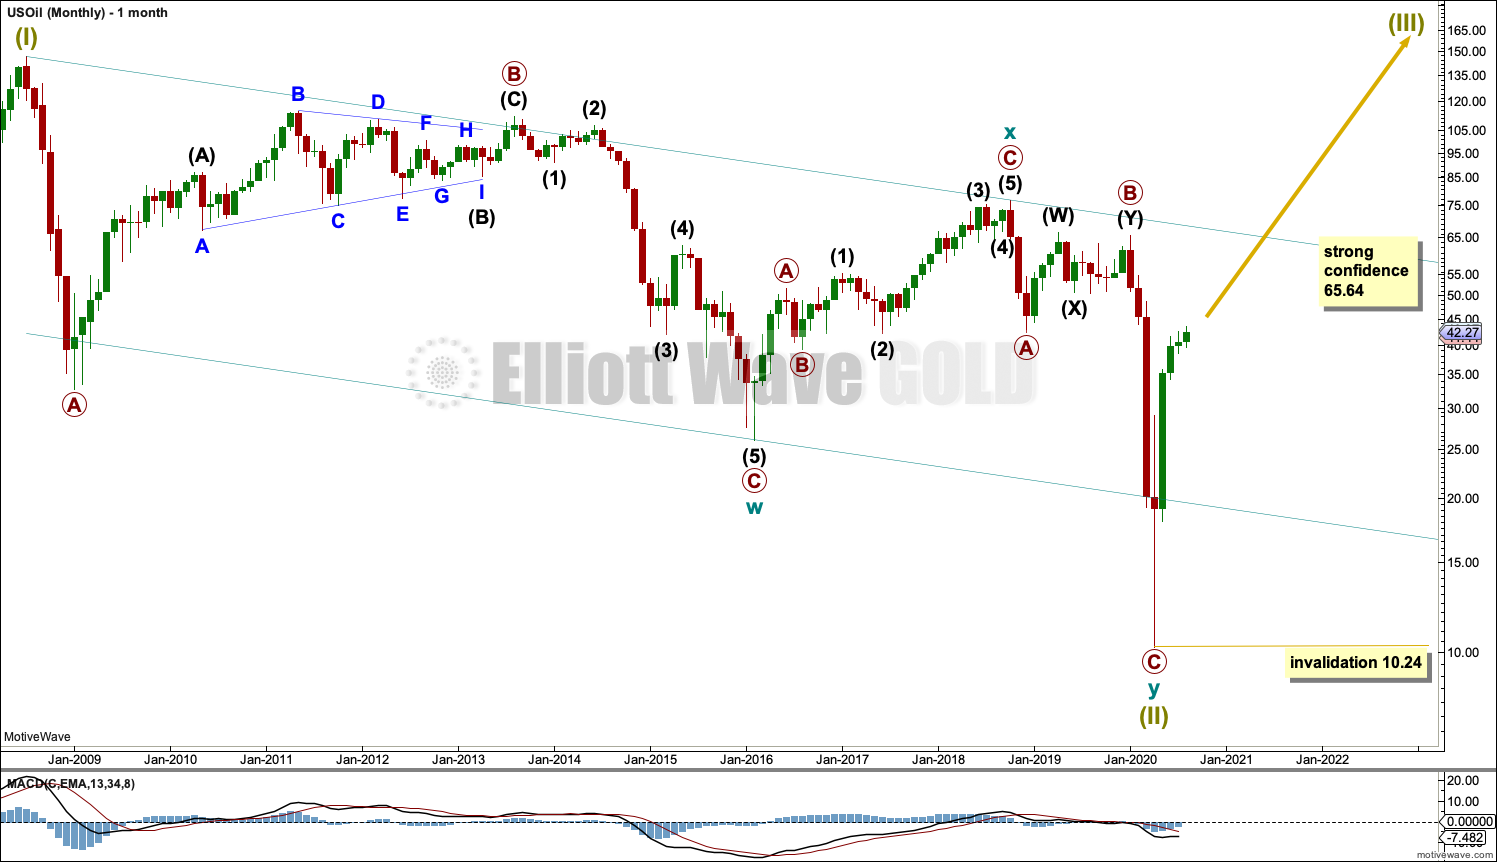
The basic Elliott wave structure is five steps forward and three steps back. This Elliott wave count expects that US Oil has completed a three steps back pattern, which began in July 2008. The Elliott wave count expects that the bear market for US Oil may now be over.
A channel is drawn about Super Cycle wave (II): draw the first trend line from the start of cycle wave w to the end of cycle wave x, then place a parallel copy on the end of cycle wave w. Price has bounced up off the channel. This trend line is breached, which is a typical look for the end of a movement for a commodity.
The upper edge of the channel may provide resistance.
Following five waves up and three steps back should be another five steps up; this is labelled Super Cycle wave (III), which may only have just begun. Super Cycle wave (III) may last a generation and must make a new high above the end of Super Cycle wave (I) at 146.73.
Super Cycle wave (III) may only subdivide as a five wave impulse. New trends for Oil usually start out very slowly with short first waves and deep time consuming second wave corrections. Basing action over a few years may now have begun.
WEEKLY CHART
Click chart to enlarge.
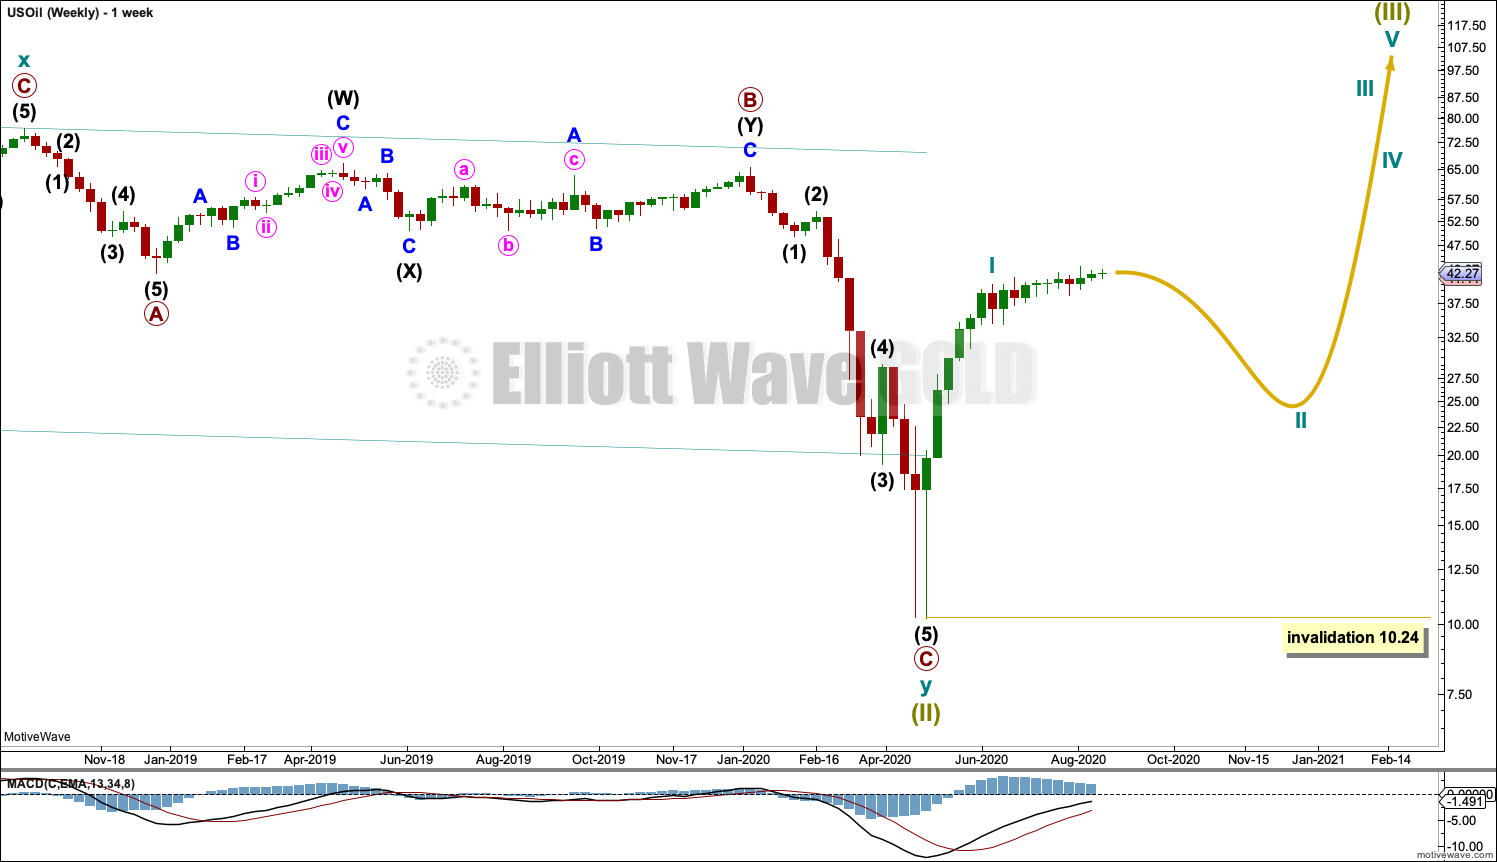
This week the degree of labelling within the new upwards trend is moved up one degree.
Super Cycle wave (III) must subdivide as an impulse. Cycle wave I within the impulse may be complete. Cycle wave II may not move beyond the start of cycle wave I below 10.24.
FIRST DAILY CHART
Click chart to enlarge.
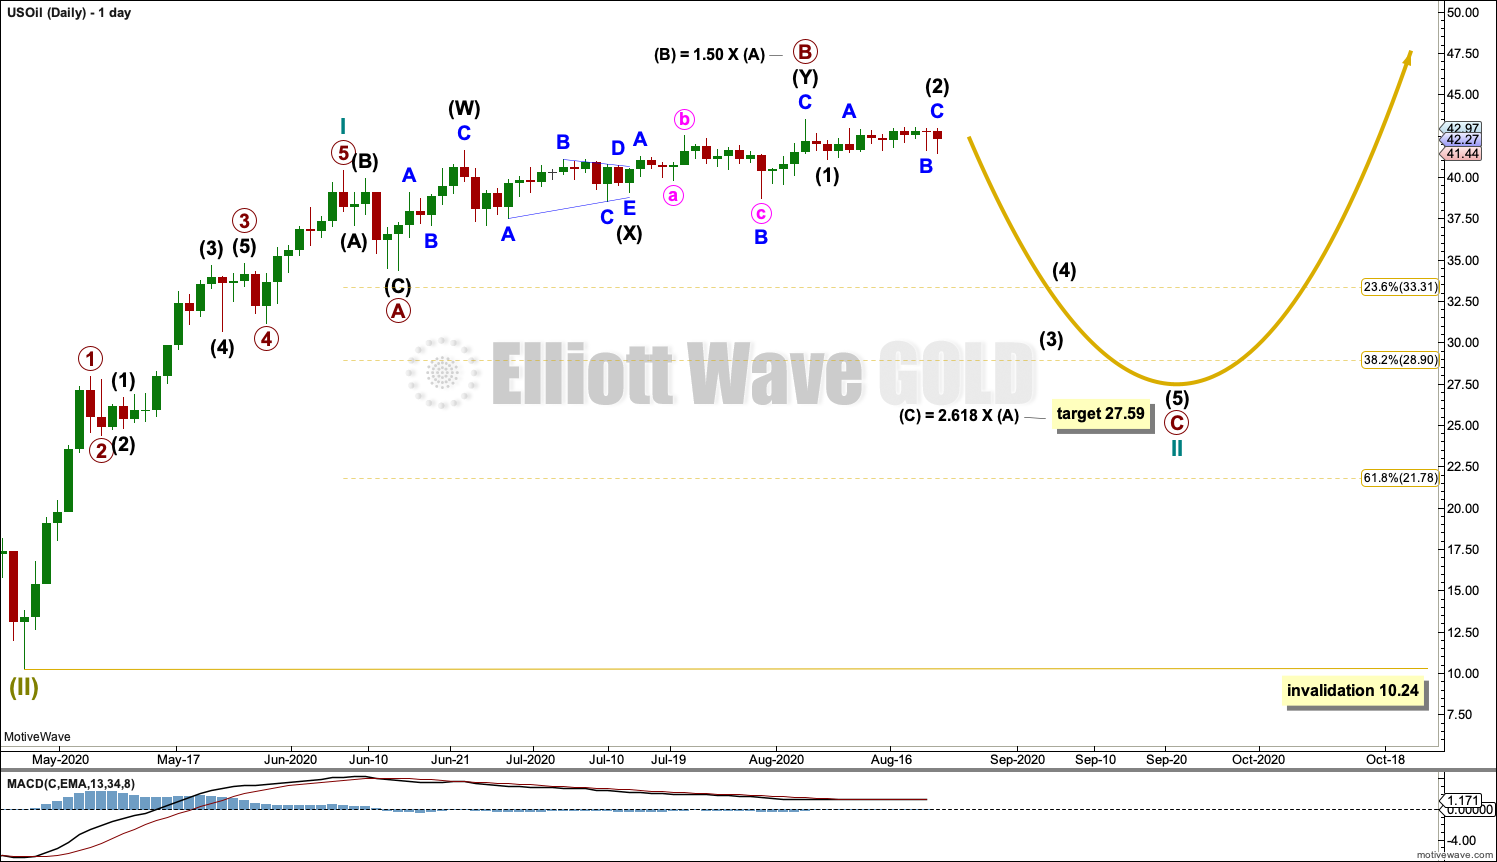
Cycle wave I within an impulse for Super Cycle wave (III) may now be complete.
Cycle wave II may be unfolding as an expanded flat correction. Primary wave A within the flat may be a complete zigzag. Primary wave B may have continued higher as a double zigzag. It would now be 1.50 times the length of primary wave A, which is a little beyond the common range for primary wave B within a flat from 1 to 1.38 times the length of primary wave A, but within an allowable limit of 2. This reduces the probability of this wave count to about even with the second.
Primary wave C may only subdivide as a five wave motive structure, most likely an impulse. If the target is wrong, then it may not be low enough.
A target is calculated for cycle wave II that expects a common Fibonacci ratio between primary waves A and C.
Cycle wave II may not move beyond the start of cycle wave I below 10.24.
SECOND DAILY CHART
Click chart to enlarge.
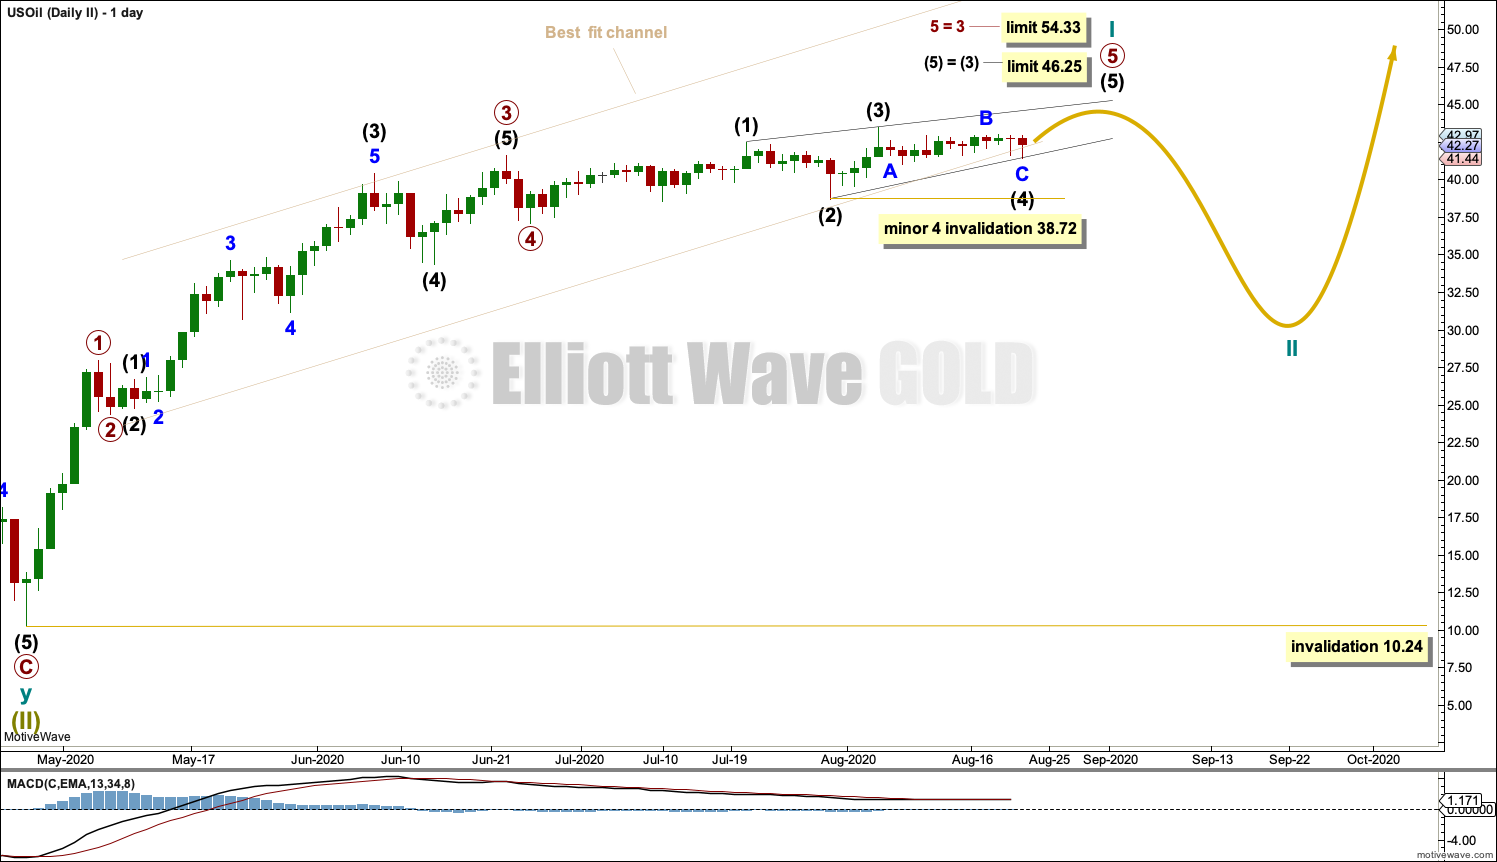
It is possible that cycle wave I is continuing higher.
Primary wave 5 may be an ending contracting diagonal. Within the diagonal: intermediate wave (3) is shorter than intermediate wave (1), intermediate wave (4) is shorter than intermediate wave (2), and intermediate wave (5) must be shorter than intermediate wave (3) (it must end before the limit at 46.25).
Intermediate wave (4) within the diagonal may not move beyond the end of intermediate wave (2) below 38.72.
TECHNICAL ANALYSIS
WEEKLY CHART
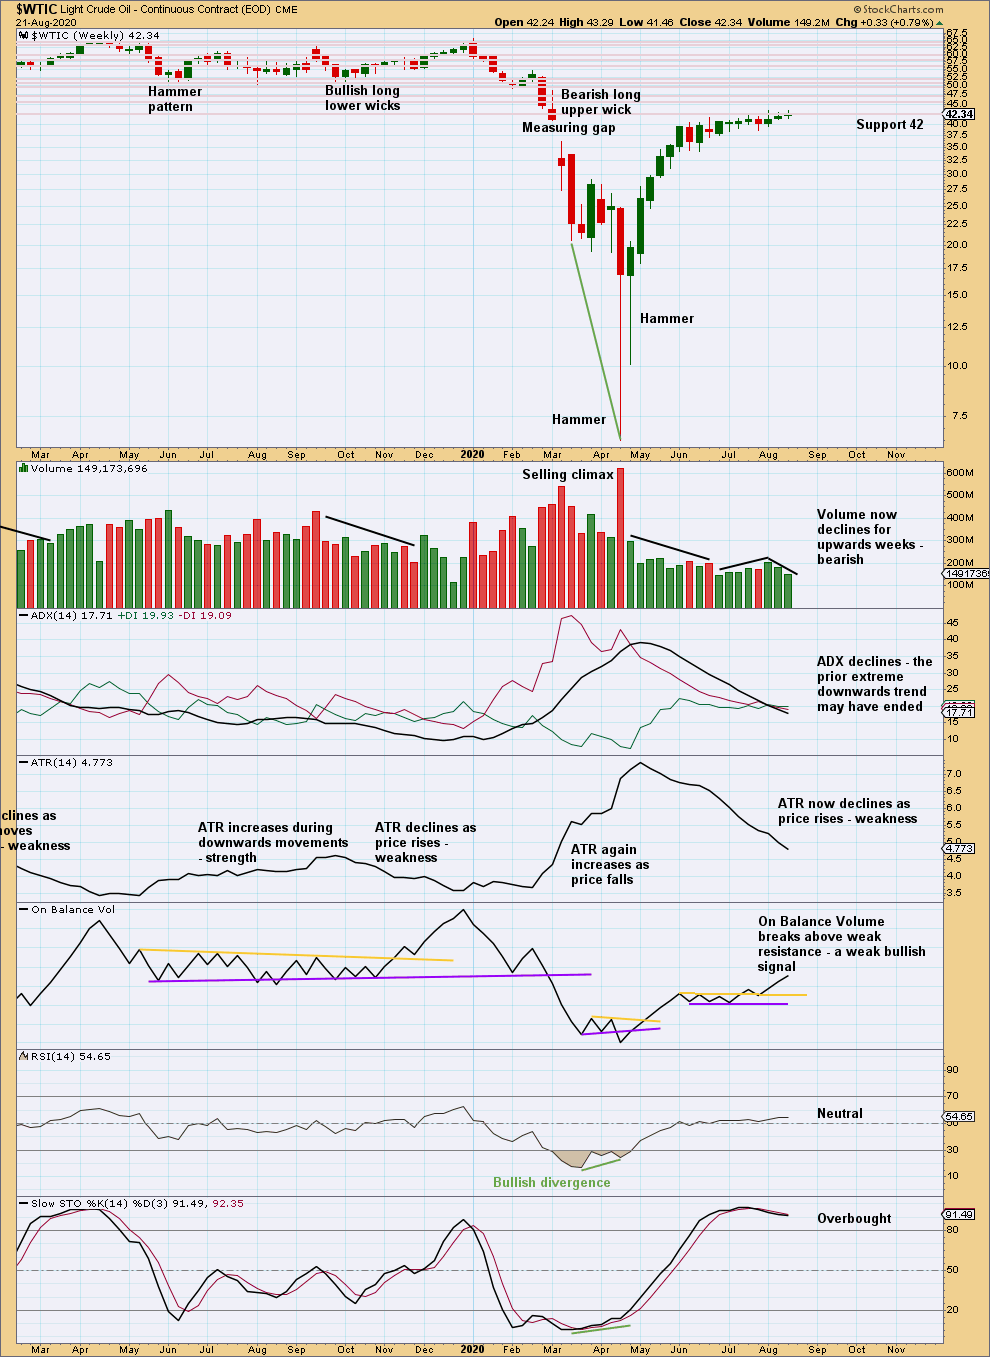
Click chart to enlarge. Chart courtesy of StockCharts.com.
Support about 42 has held this week. There is a strong cluster of resistance above; it would still be reasonable to expect a pullback to develop about here.
DAILY CHART
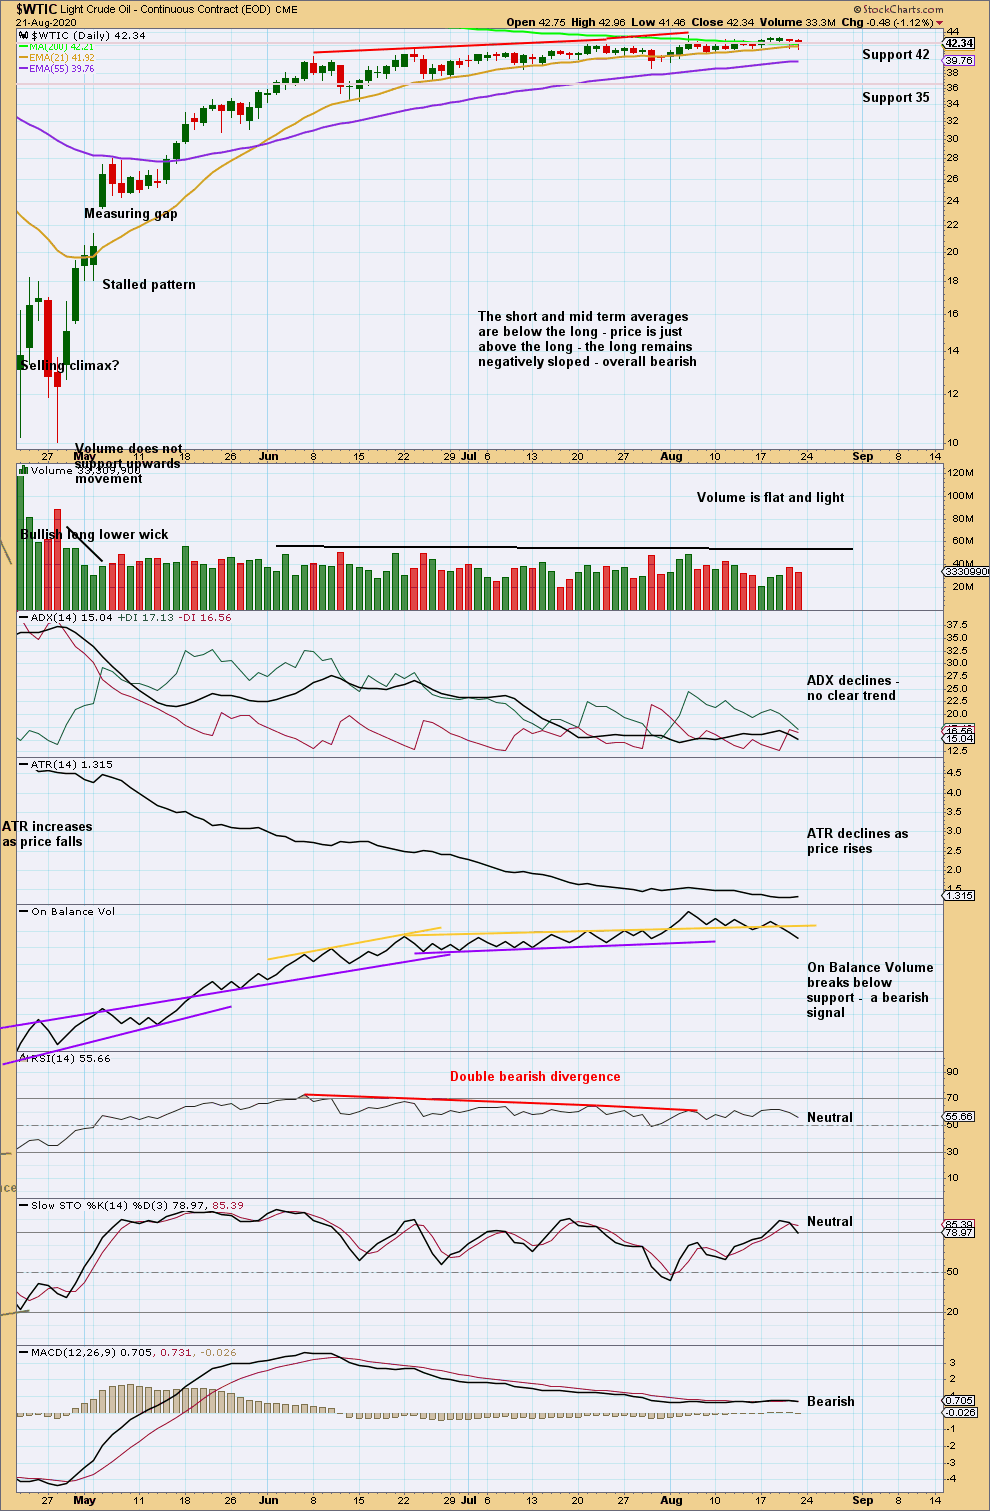
Click chart to enlarge. Chart courtesy of StockCharts.com.
There is still double bearish divergence between price and RSI. The probability of a multi-week pullback remains high.
A bearish signal from On Balance Volume favours the first daily chart.
The last two daily candlesticks look like small hanging men; these are bearish reversal patterns, but they require confirmation with a bearish candlestick to follow.
Published @ 07:24 p.m. ET.
—
Careful risk management protects your trading account(s).
Follow my two Golden Rules:
1. Always trade with stops.
2. Risk only 1-5% of equity on any one trade.
—
New updates to this analysis are in bold.