
US OIL: Elliott Wave and Technical Analysis | Charts – August 28, 2020
Another very small range week has moved price very slightly higher with weak volume.
Summary: Oil may have found a major sustainable low.
Price may continue slowly higher for a few more weeks to a short-term target at 46.55. If this target is wrong, then it may be too high.
A pullback is still expected. The pullback may end about 23.05. It is possible the pullback may be deeper than this though; the first major correction within a new trend for Oil tends to be very deep.
When this pullback may be complete, then an upwards trend should resume with increased strength.
ELLIOTT WAVE COUNT
MONTHLY CHART
Click chart to enlarge.
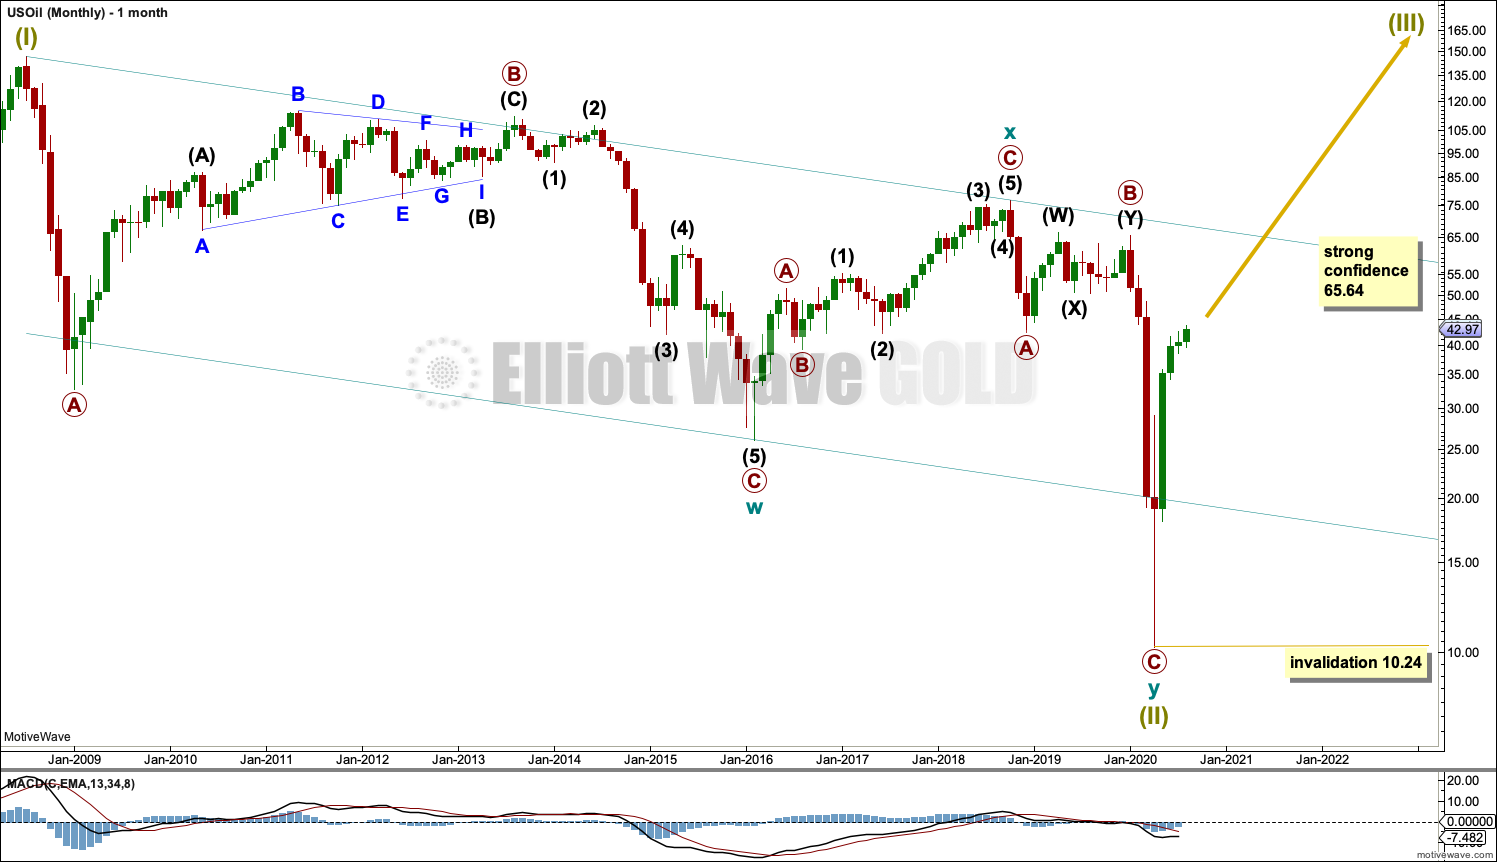
The basic Elliott wave structure is five steps forward and three steps back. This Elliott wave count expects that US Oil has completed a three steps back pattern, which began in July 2008. The Elliott wave count expects that the bear market for US Oil may now be over.
A channel is drawn about Super Cycle wave (II): draw the first trend line from the start of cycle wave w to the end of cycle wave x, then place a parallel copy on the end of cycle wave w. Price has bounced up off the channel. This trend line is breached, which is a typical look for the end of a movement for a commodity.
The upper edge of the channel may provide resistance.
Following five waves up and three steps back should be another five steps up; this is labelled Super Cycle wave (III), which may only have just begun. Super Cycle wave (III) may last a generation and must make a new high above the end of Super Cycle wave (I) at 146.73.
Super Cycle wave (III) may only subdivide as a five wave impulse. New trends for Oil usually start out very slowly with short first waves and deep time consuming second wave corrections. Basing action over a few years may now have begun.
WEEKLY CHART
Click chart to enlarge.
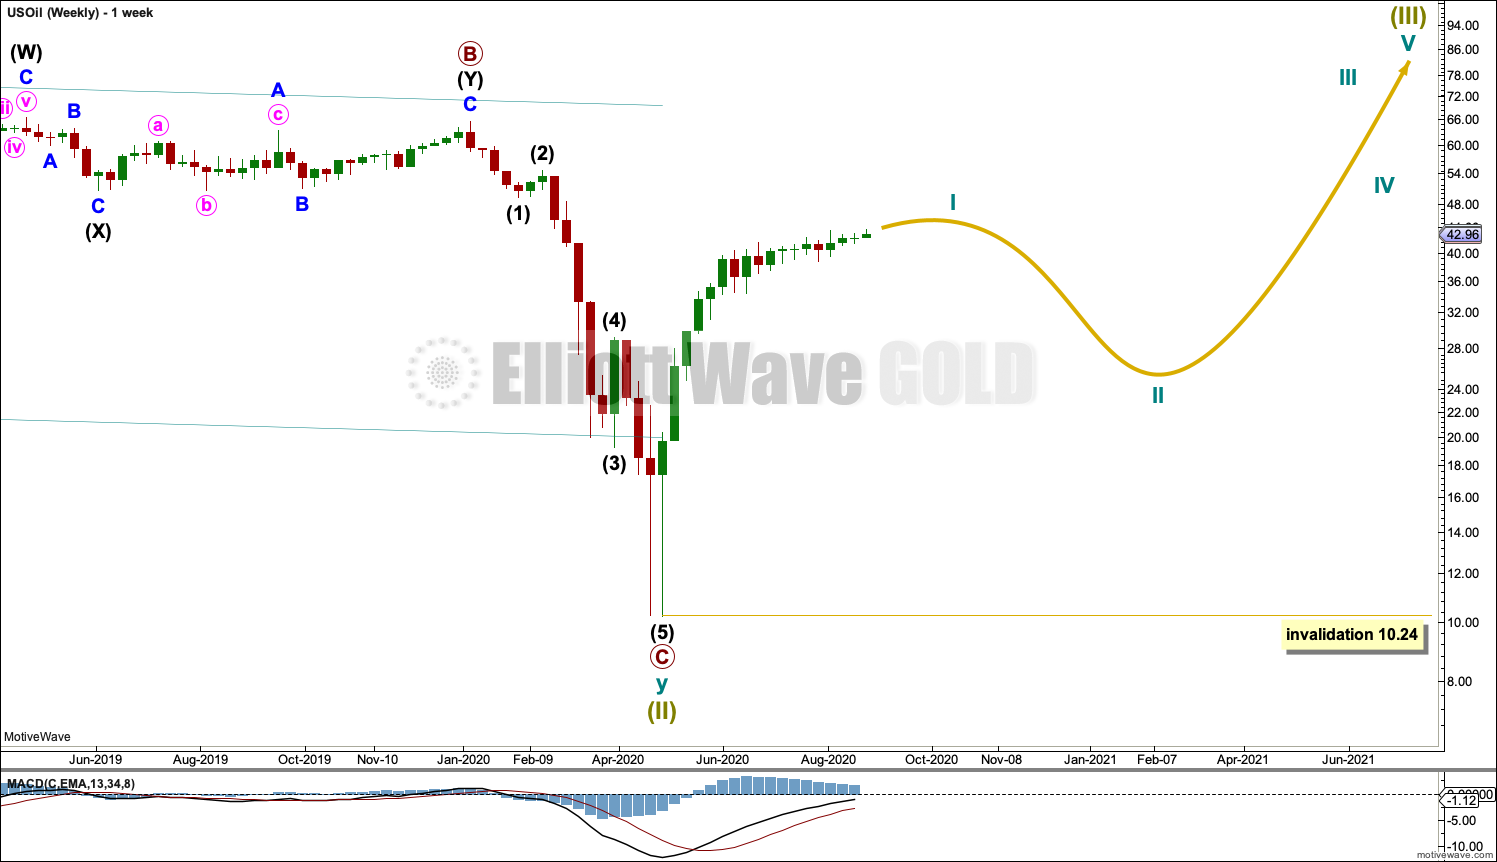
Super Cycle wave (III) must subdivide as an impulse. Cycle wave I within the impulse may be incomplete. Cycle wave II may not move beyond the start of cycle wave I below 10.24.
FIRST DAILY CHART
Click chart to enlarge.
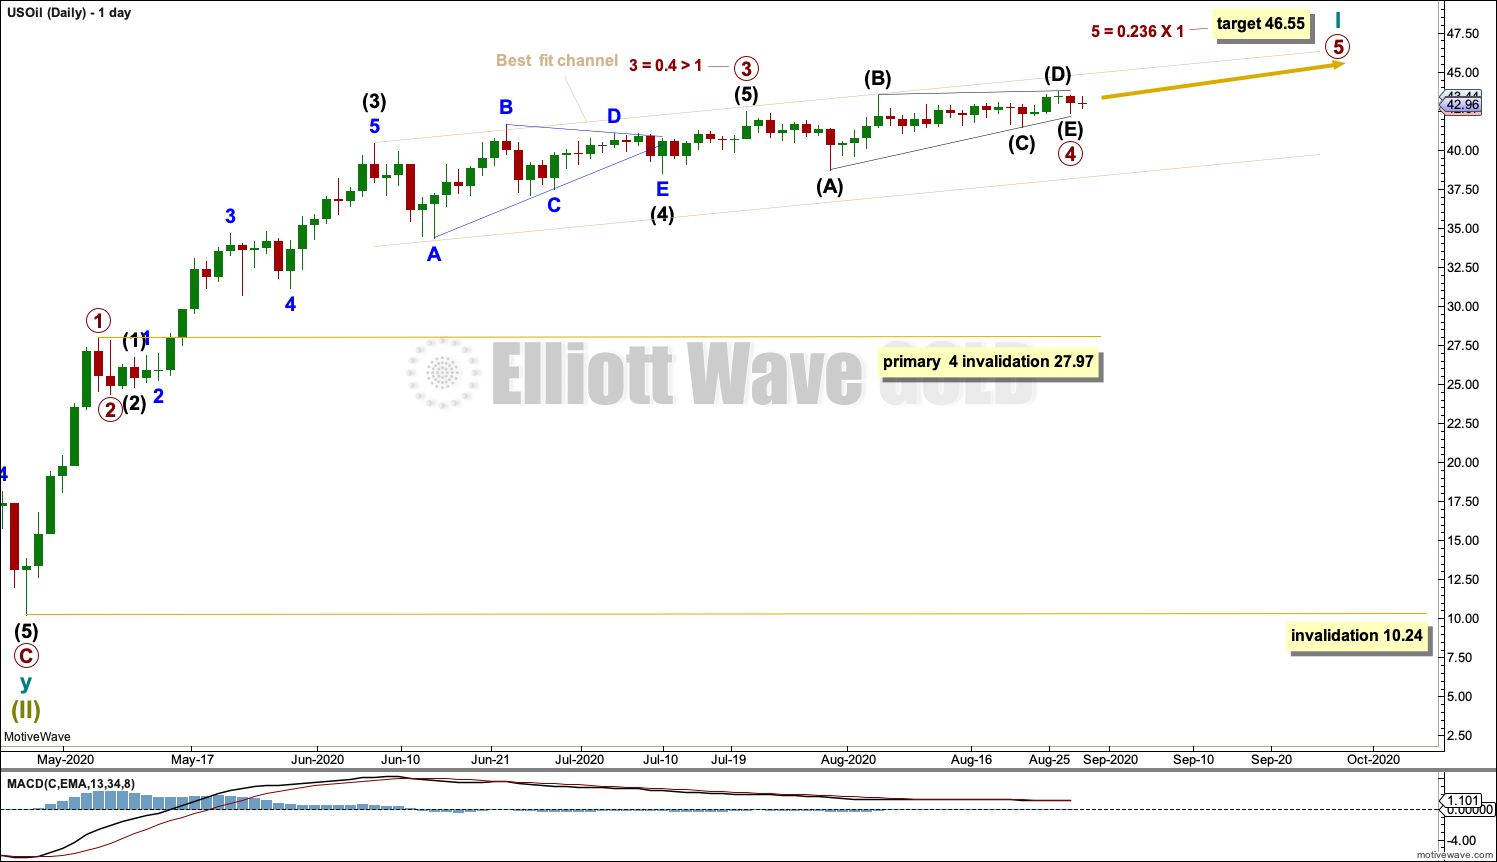
This week cycle wave I is reanalysed.
This labelling sees primary wave 3 longer than primary wave 1, with a close Fibonacci ratio of equality. Primary wave 4 may be a complete running barrier triangle.
A target is calculated for primary wave 5 to end. However, because there is already a close Fibonacci ratio between primary waves 1 and 3, primary wave 5 may not exhibit a Fibonacci ratio to either of primary waves 1 or 3. Oil only occasionally exhibits Fibonacci ratios between all three actionary waves.
The best fit channel is adjusted to contain the slowing end of cycle wave I. When this channel is breached by downwards movement, it may be an indication that cycle wave I should be over and cycle wave II should have begun.
Cycle wave II may not move beyond the start of cycle wave I below 10.24.
SECOND DAILY CHART
Click chart to enlarge.
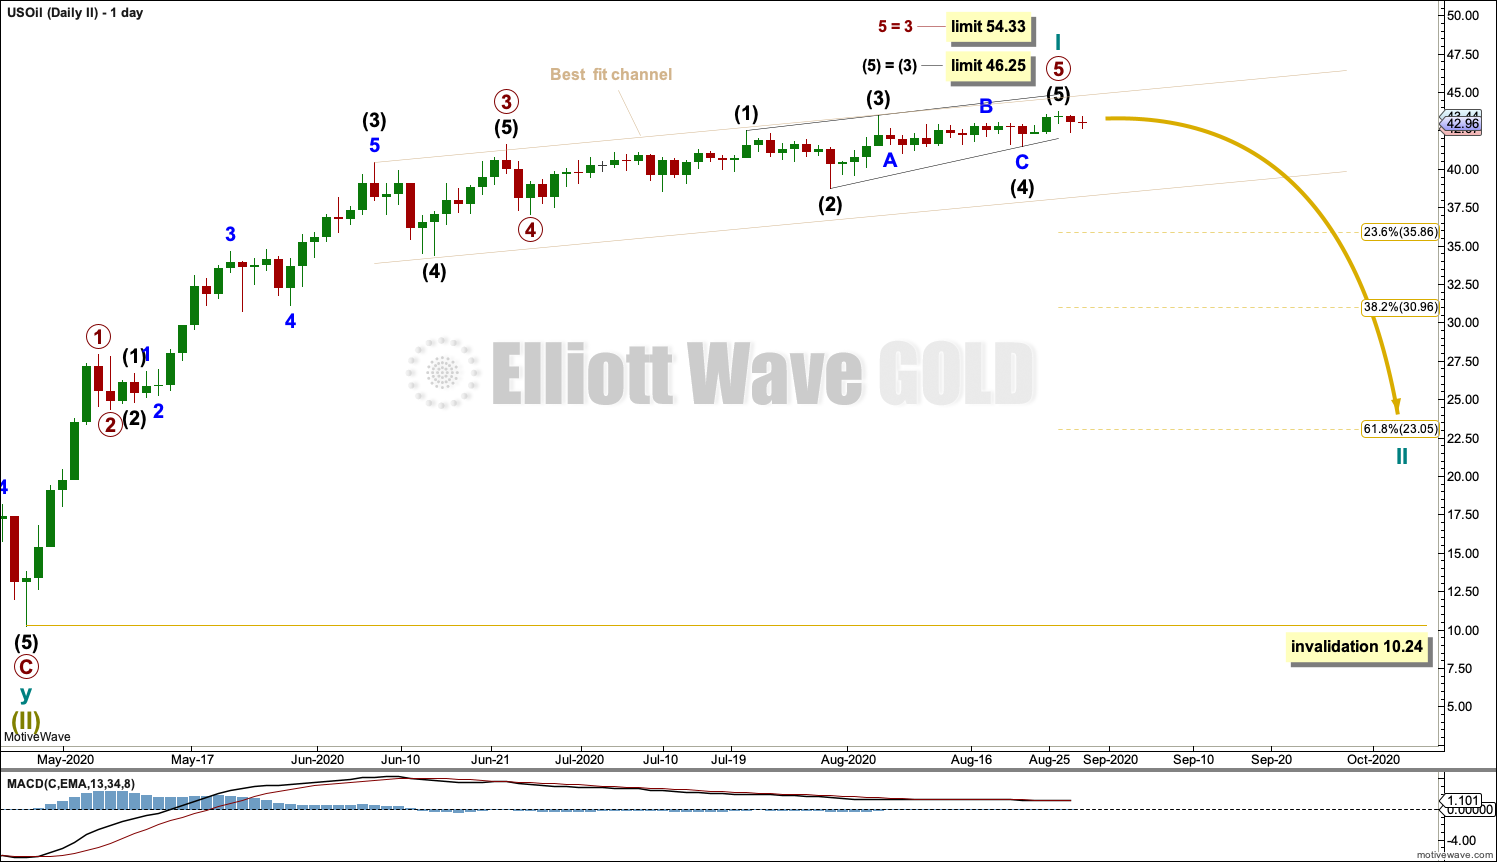
It is possible this week for this wave count that cycle wave I may be over. But if cycle wave I continues higher, then the limits apply.
Primary wave 5 for this wave count is labelled as an ending contracting diagonal. If intermediate wave (5) continues higher, then it may not be longer than equality with intermediate wave (3) at 46.25.
For this wave count primary wave 3 is shorter in length than primary wave 1. Primary wave 3 may not be the shortest of primary waves 1, 3 and 5; if it continues higher, then primary wave 5 is limited to no longer than equality in length with primary wave 3 at 54.33.
TECHNICAL ANALYSIS
WEEKLY CHART
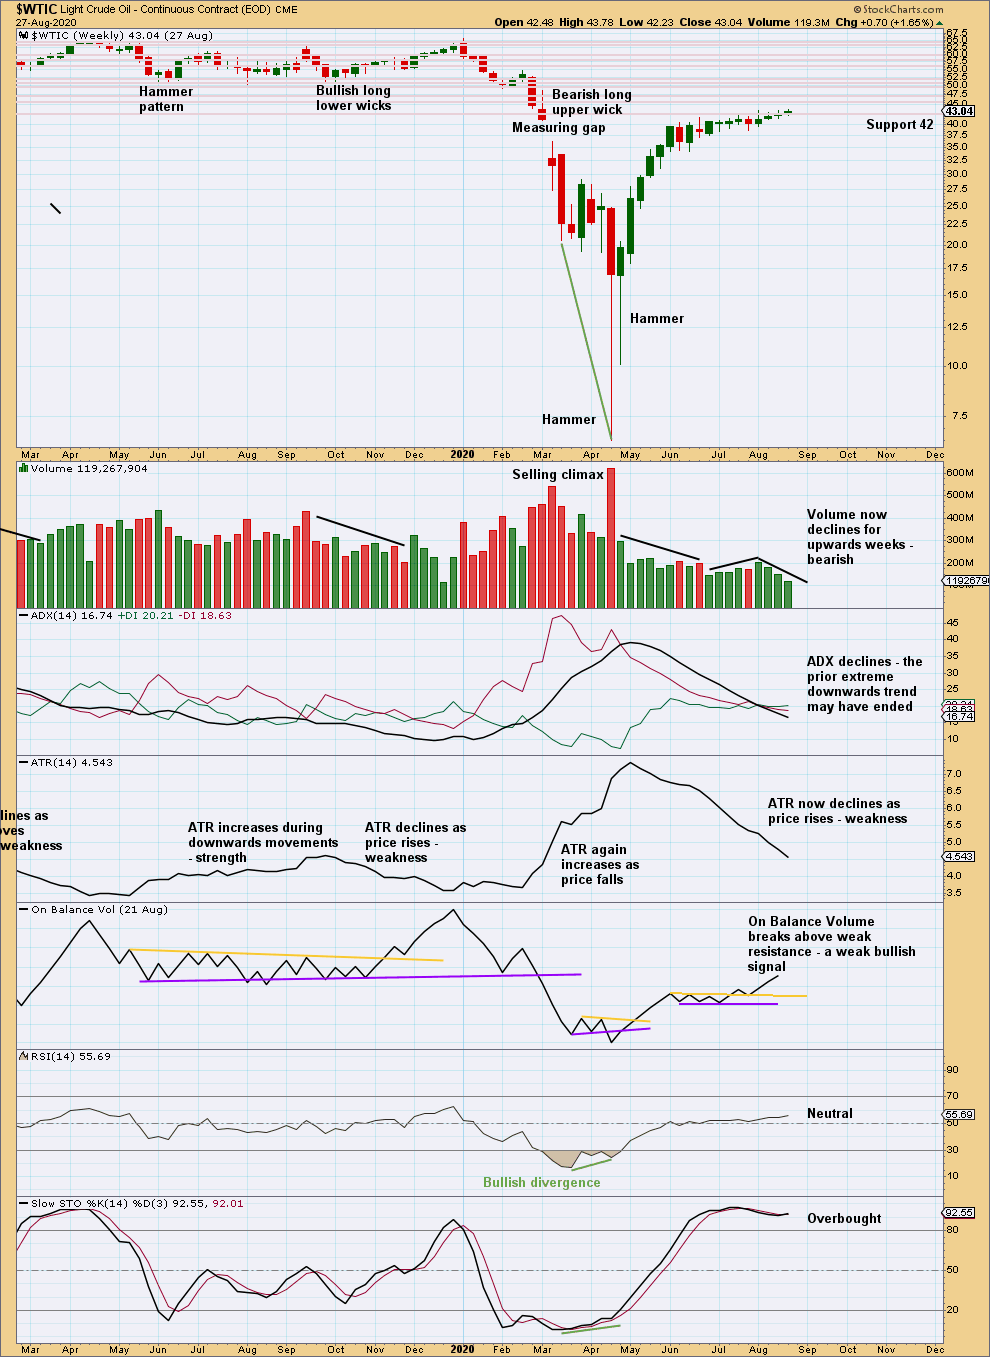
Click chart to enlarge. Chart courtesy of StockCharts.com.
Support about 42 has again held this week. There is a strong cluster of resistance above; it would still be reasonable to expect a pullback to develop about here.
DAILY CHART
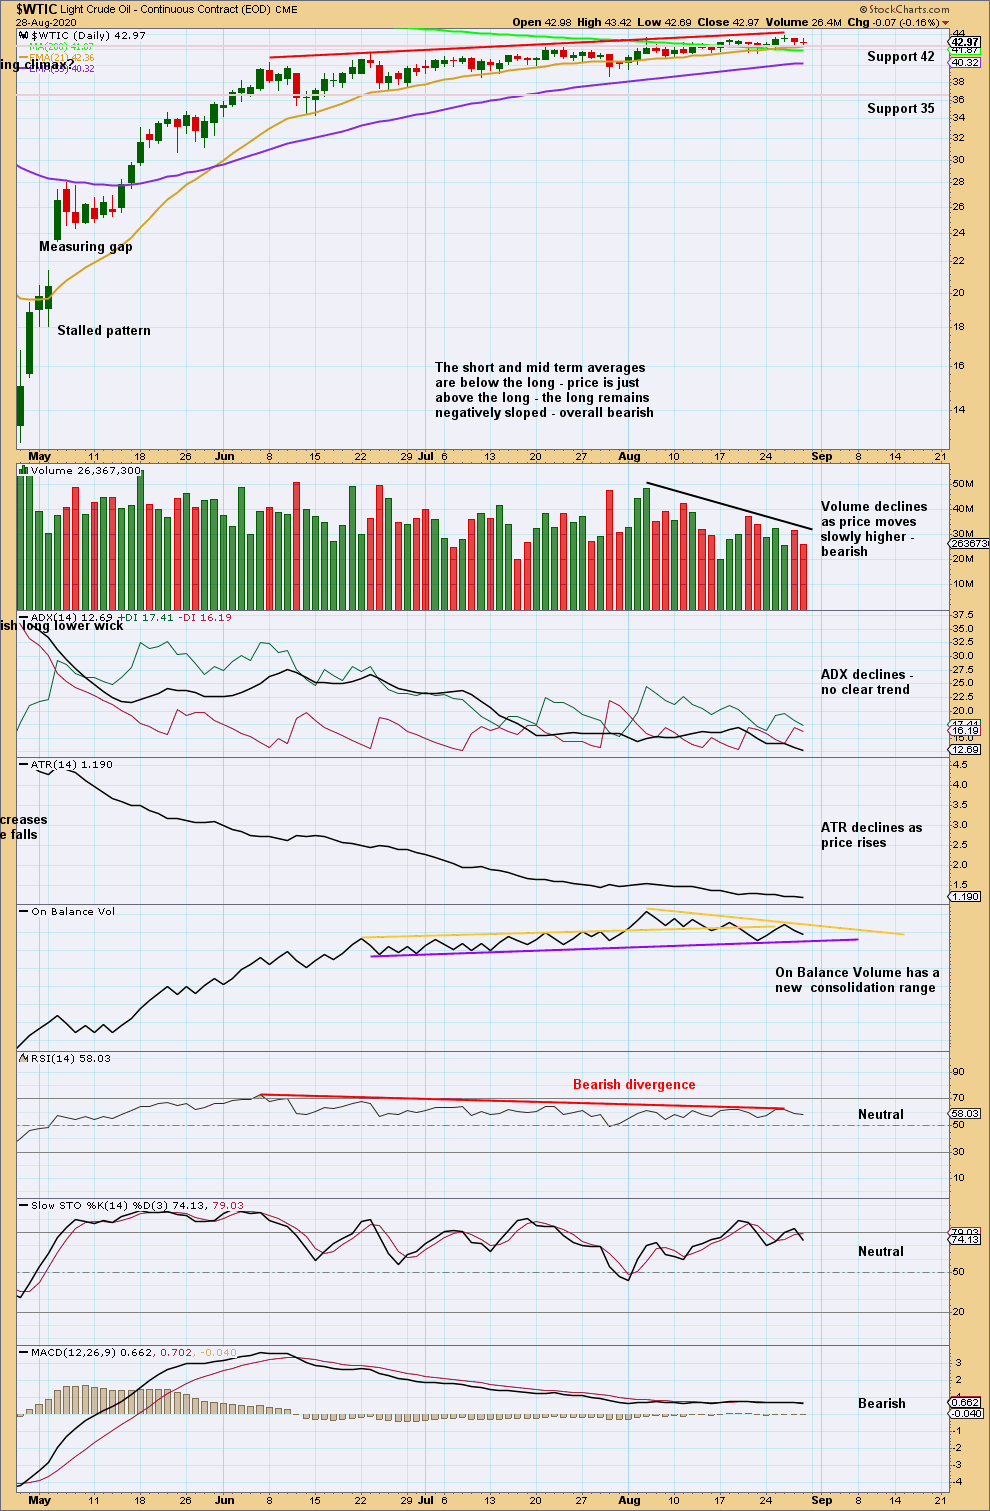
Click chart to enlarge. Chart courtesy of StockCharts.com.
There is now only single bearish divergence between price and RSI. The probability of a multi-week pullback remains high.
There is no bearish candlestick reversal pattern to indicate a high in place. A rounded top looks likely to be forming. These take time. Eventually, after a final high is found, downwards movement may increase in momentum and another V bottom may form.
Published @ 05:53 p.m. ET.
—
Careful risk management protects your trading account(s).
Follow my two Golden Rules:
1. Always trade with stops.
2. Risk only 1-5% of equity on any one trade.
—
New updates to this analysis are in bold.