
US OIL: Elliott Wave and Technical Analysis | Charts – September 18, 2020
A bounce this week remains below the short-term invalidation point. Volume supports the Elliott wave count.
Summary: Oil may have found a major sustainable low.
A multi-week pullback is expected to end about 23.05. It is possible the pullback may be deeper than this though; the first major correction within a new trend for Oil tends to be very deep.
When this pullback may be complete, then an upwards trend should resume with increased strength.
ELLIOTT WAVE COUNT
MONTHLY CHART
Click chart to enlarge.
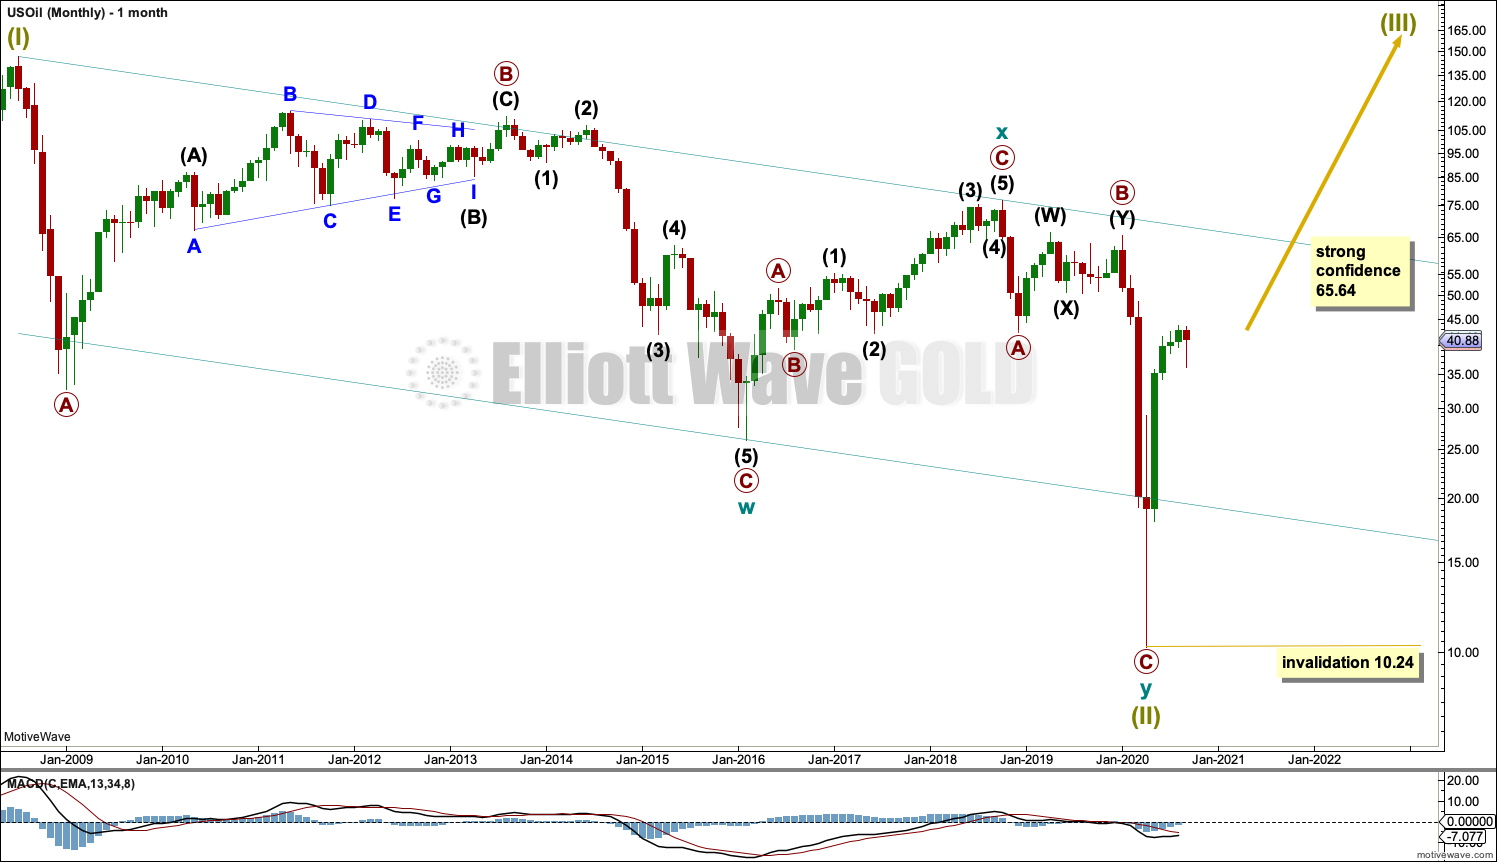
The basic Elliott wave structure is five steps forward and three steps back. This Elliott wave count expects that US Oil has completed a three steps back pattern, which began in July 2008. The Elliott wave count expects that the bear market for US Oil may now be over.
A channel is drawn about Super Cycle wave (II): draw the first trend line from the start of cycle wave w to the end of cycle wave x, then place a parallel copy on the end of cycle wave w. Price has bounced up off the channel. This trend line is breached, which is a typical look for the end of a movement for a commodity.
The upper edge of the channel may provide resistance.
Following five waves up and three steps back should be another five steps up; this is labelled Super Cycle wave (III), which may only have just begun. Super Cycle wave (III) may last a generation and must make a new high above the end of Super Cycle wave (I) at 146.73.
Super Cycle wave (III) may only subdivide as a five wave impulse. New trends for Oil usually start out very slowly with short first waves and deep time consuming second wave corrections. Basing action over a few years may now have begun.
WEEKLY CHART
Click chart to enlarge.
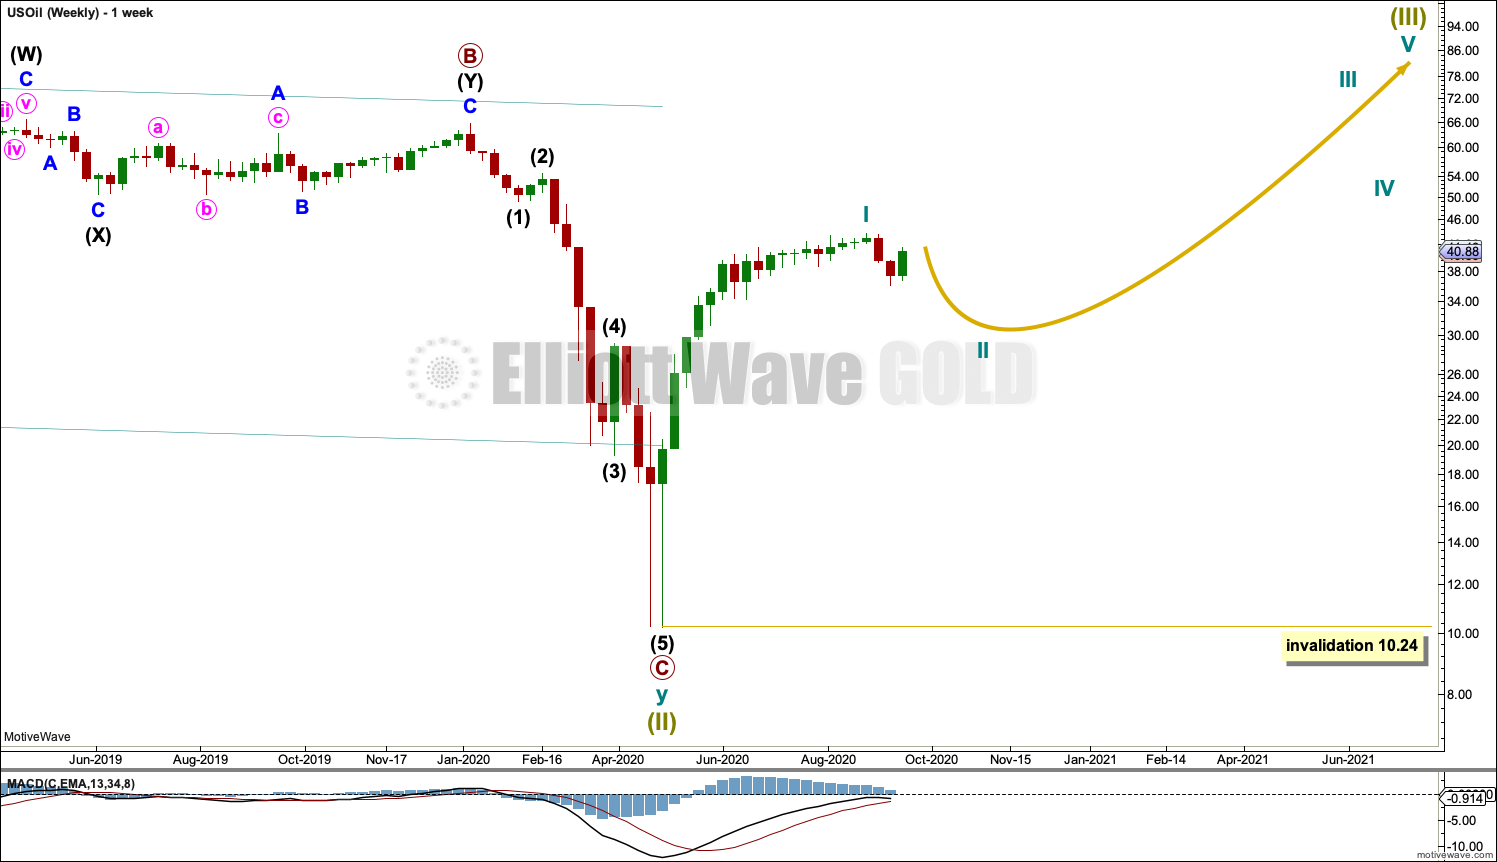
Super Cycle wave (III) must subdivide as an impulse. Cycle wave I within the impulse may be complete. Cycle wave II may not move beyond the start of cycle wave I below 10.24.
DAILY CHART
Click chart to enlarge.
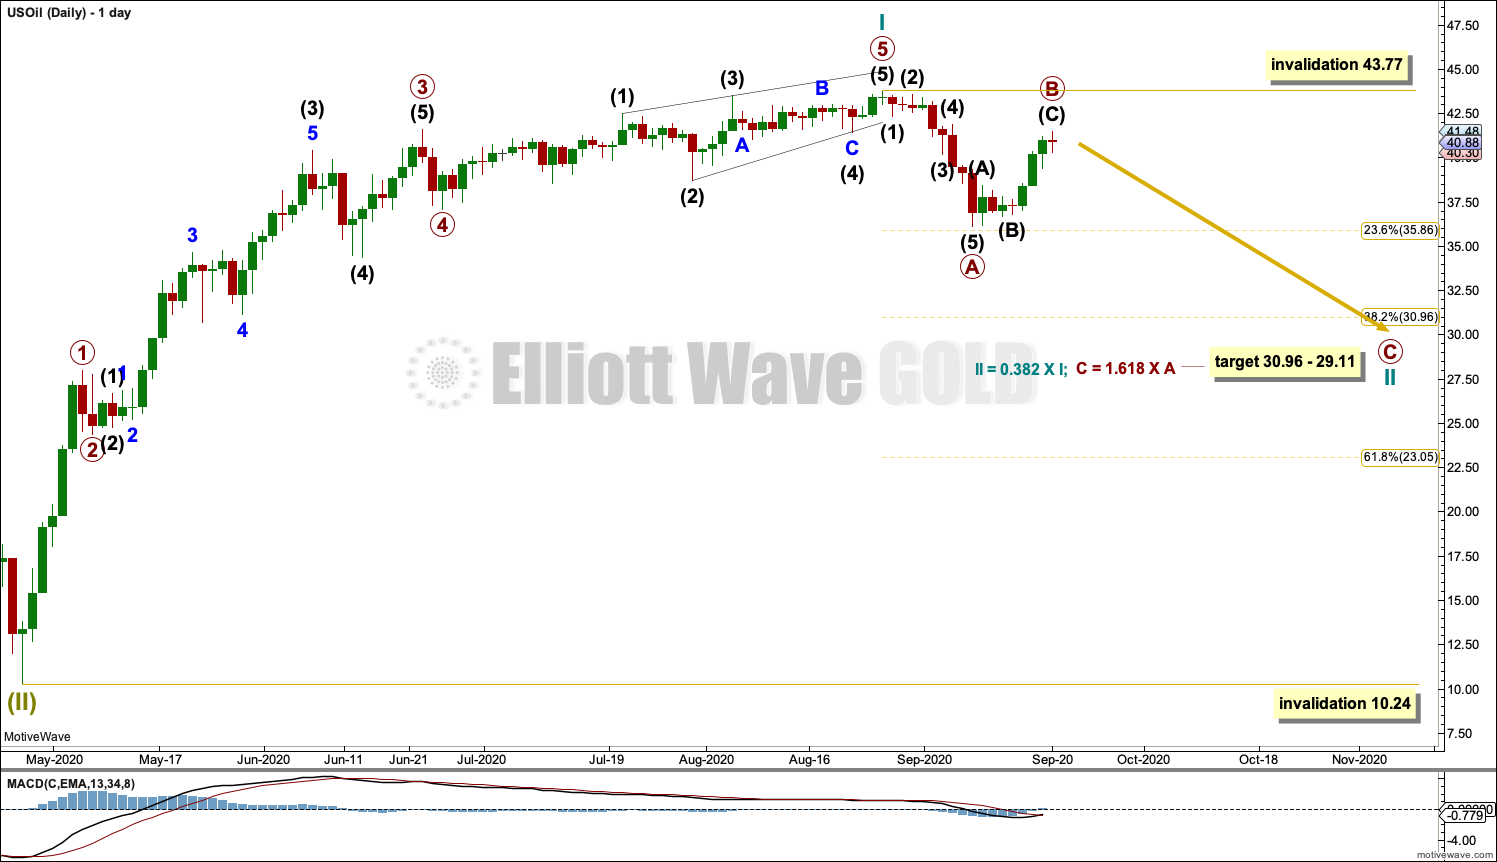
Cycle wave I now looks very likely to be over.
Cycle wave II may subdivide as any corrective Elliott wave structure except a triangle. At this stage, cycle wave II may be an incomplete zigzag that may end close to the 0.382 Fibonaccci ratio. Primary wave B within the zigzag may not move beyond the start of primary wave A above 43.77.
Cycle wave II may not move beyond the start of cycle wave I below 10.24.
FIRST ALTERNATE DAILY CHART
Click chart to enlarge.
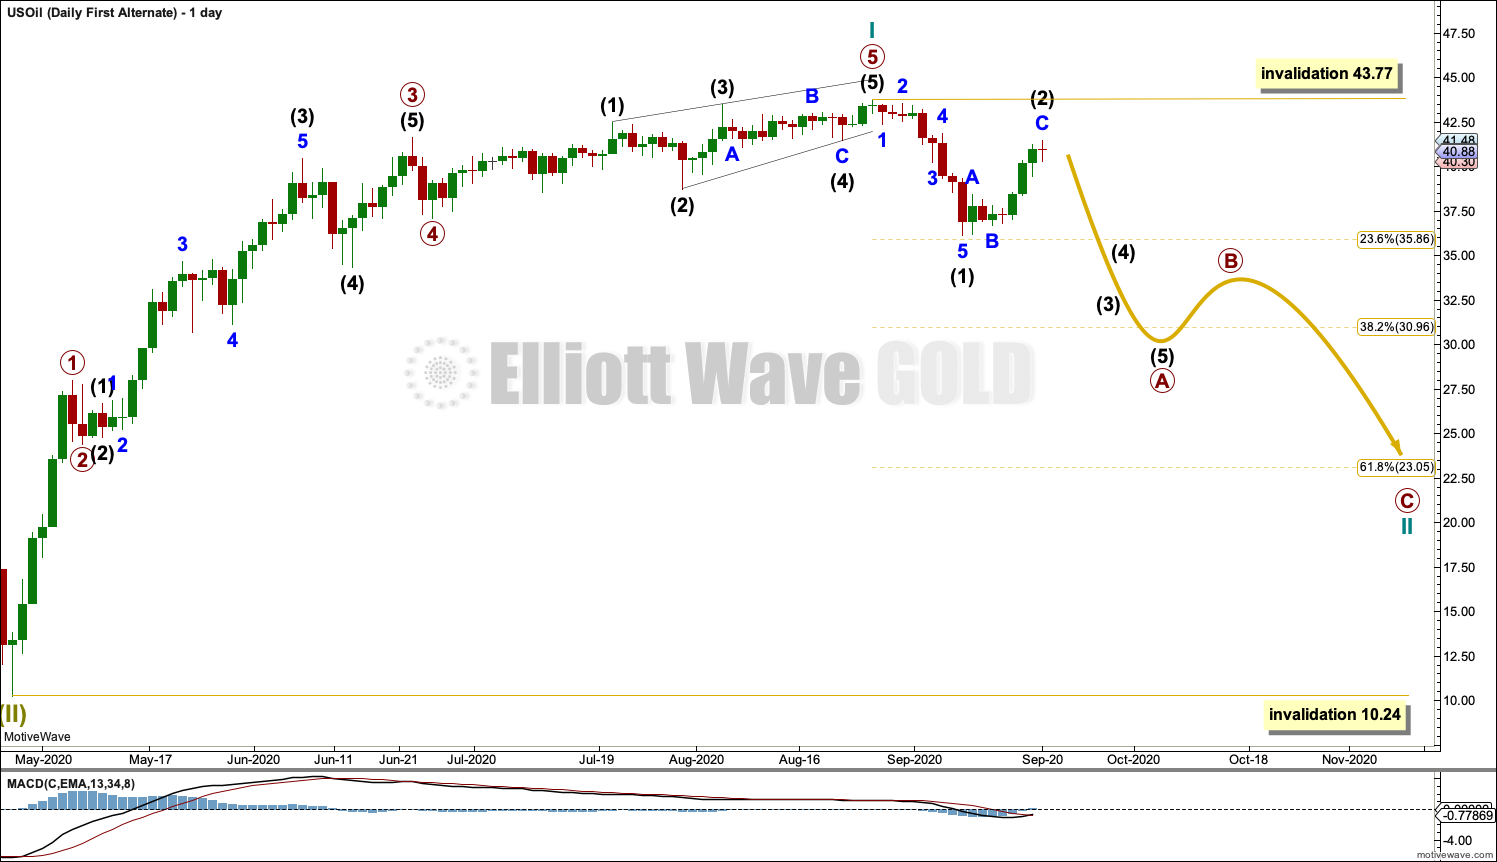
This first alternate wave count moves the degree of labelling within cycle wave II down one degree.
Cycle wave II may be subdividing as a zigzag. Primary wave A within cycle wave II may be an incomplete impulse.
Intermediate wave (2) within primary wave A may not move beyond the start of intermediate wave (1) above 43.77.
The 0.618 Fibonacci ratio of cycle wave I at 23.05 is a preferred target, but it is possible that cycle wave II may be deeper than this.
SECOND ALTERNATE DAILY CHART
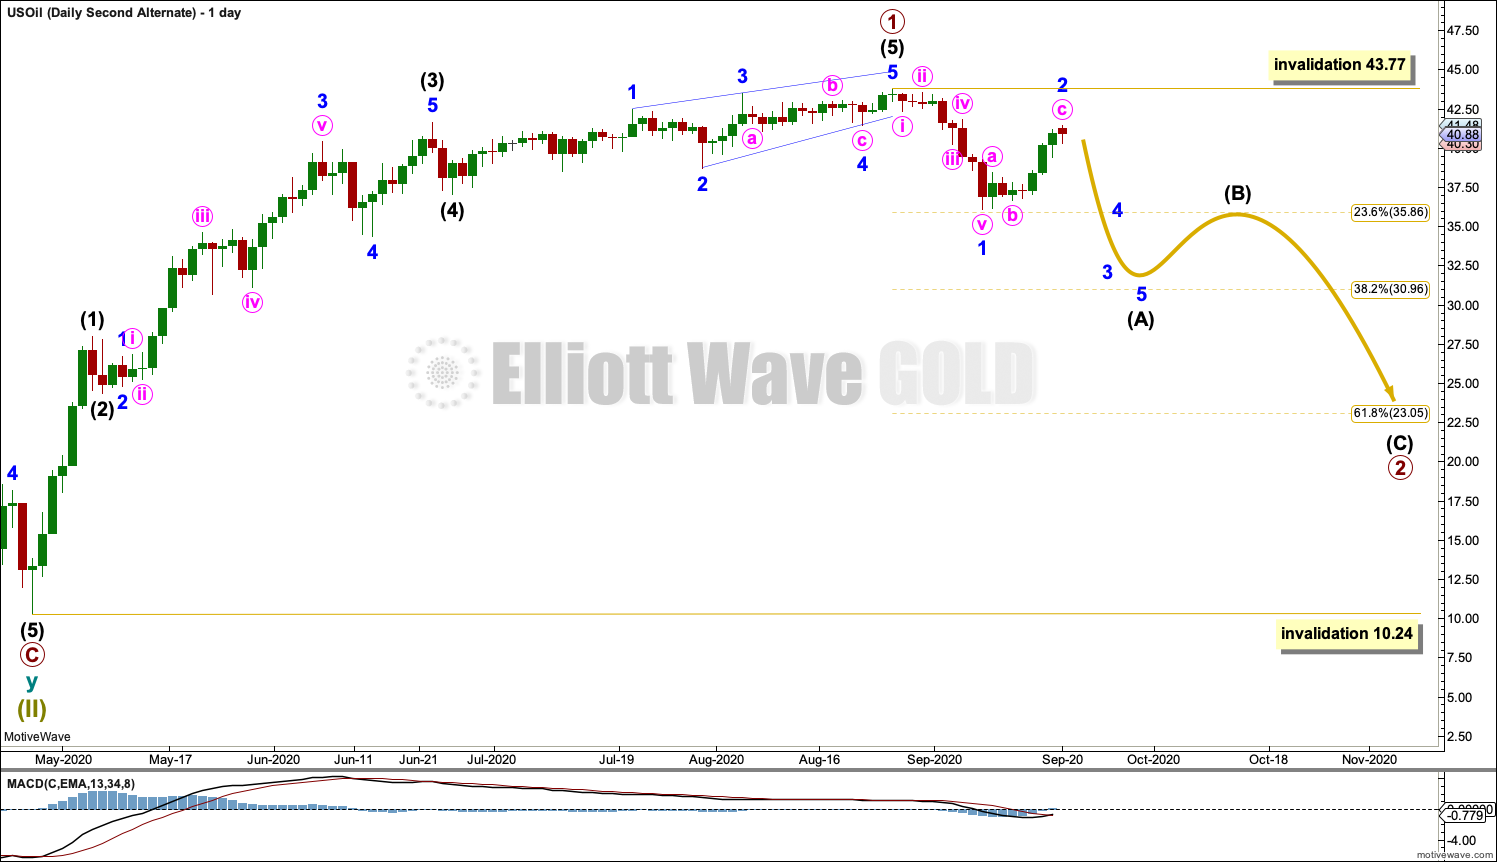
Click chart to enlarge.
It is also possible that the degree of labelling at the daily chart level may need to be changed back down one degree. It may be that only primary wave 1 is complete within cycle wave I and the current pullback may be primary wave 2.
Primary wave 2 may last several weeks to a few months.
TECHNICAL ANALYSIS
WEEKLY CHART
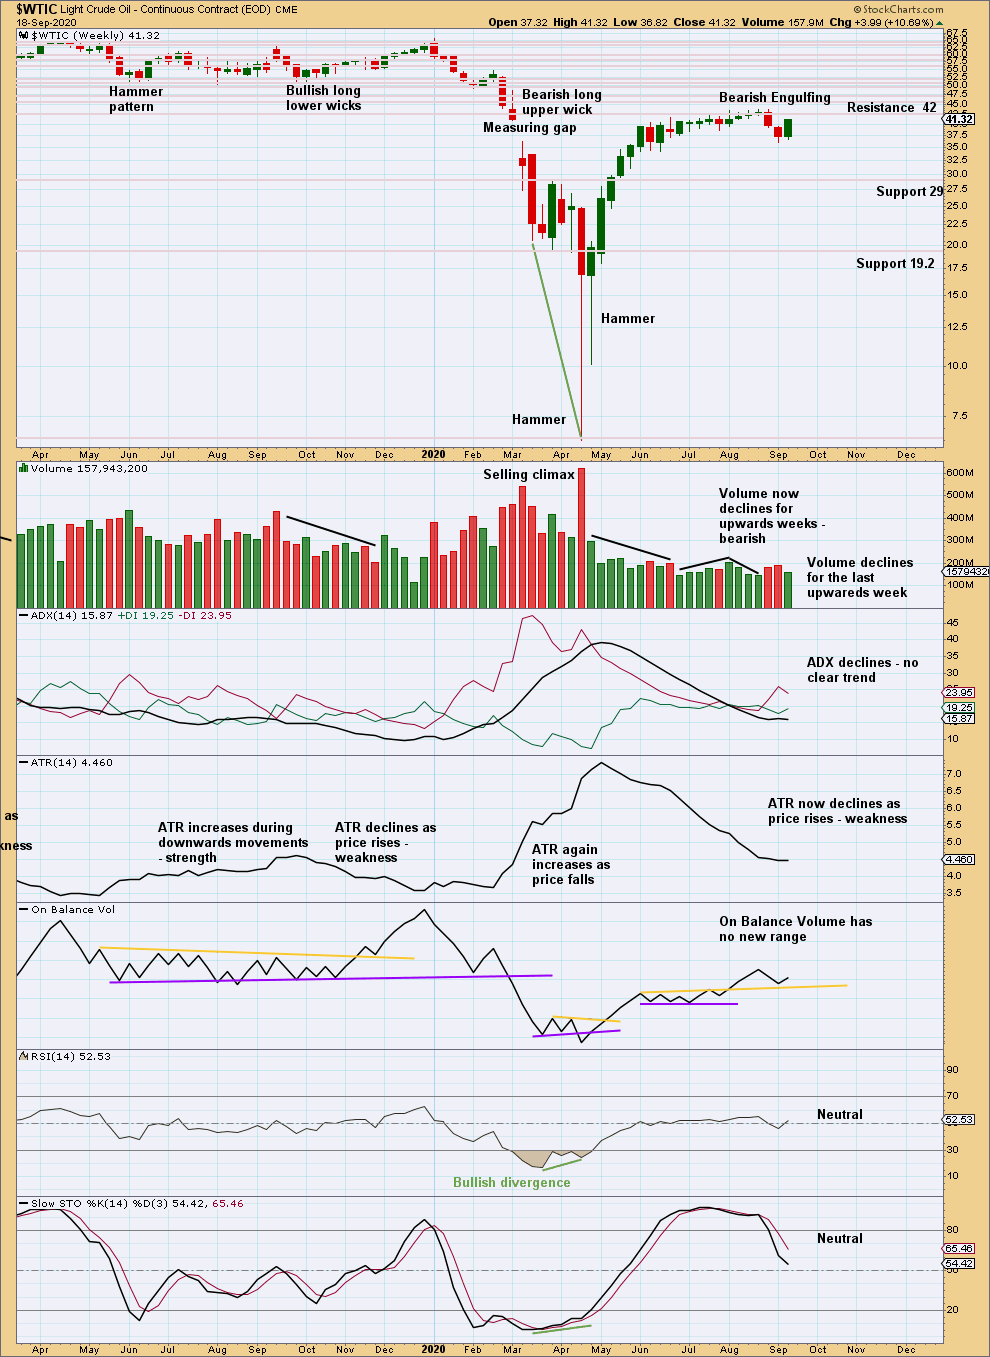
Click chart to enlarge. Chart courtesy of StockCharts.com.
Price has not yet reached support. Stochastics is not yet oversold. There is room for more downwards movement.
DAILY CHART
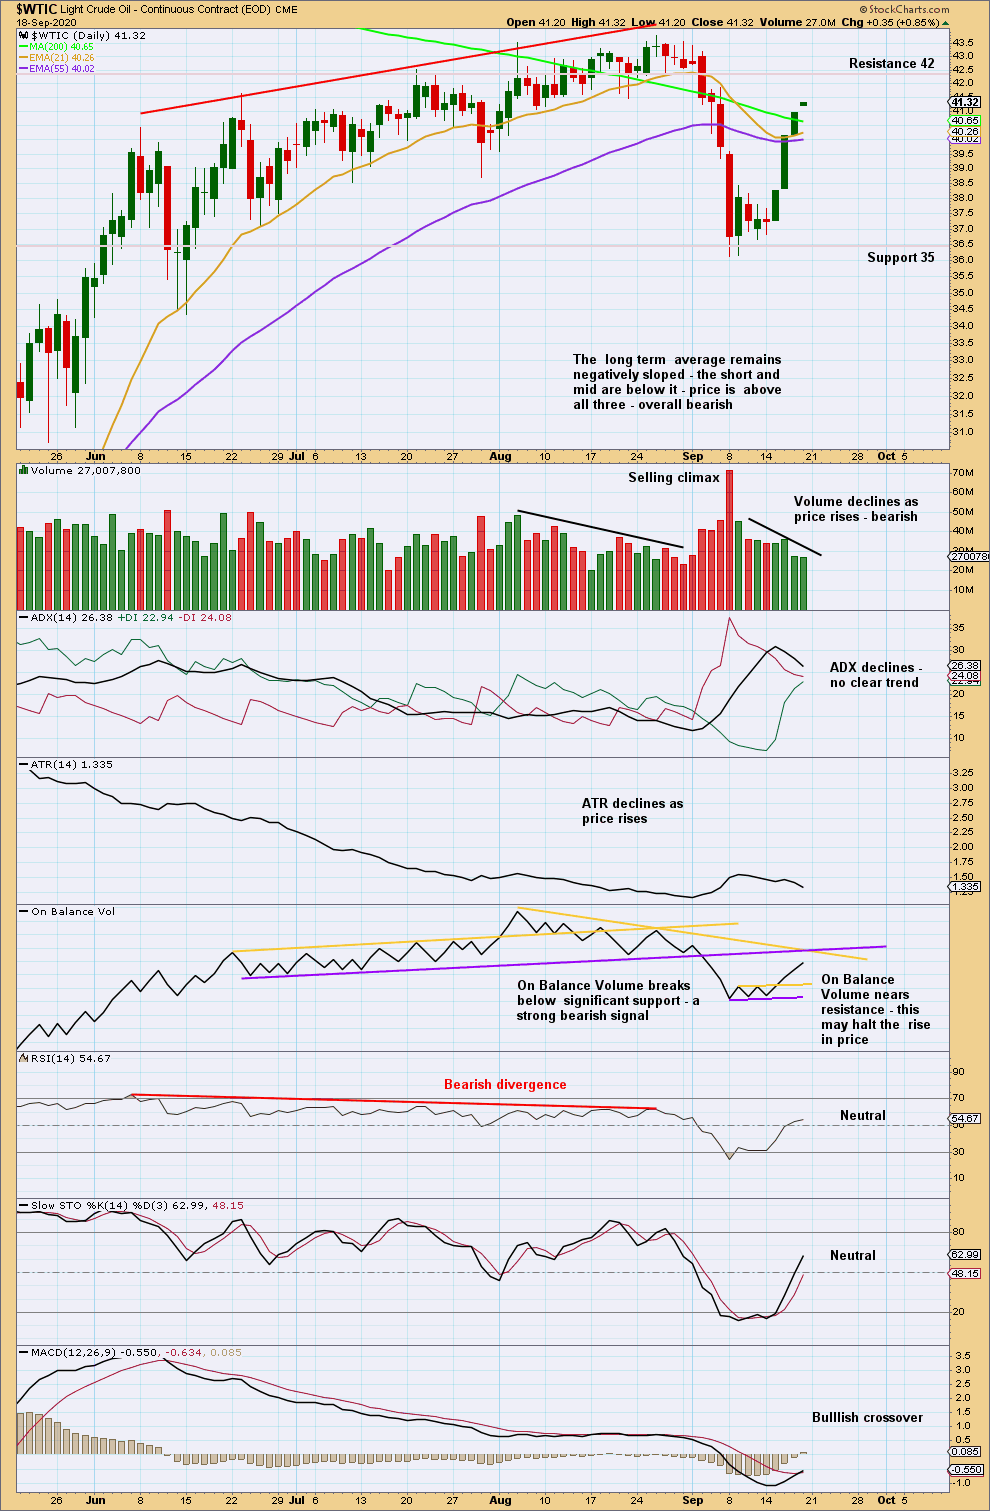
Click chart to enlarge. Chart courtesy of StockCharts.com.
This bounce may be a test of resistance after a break below support.
There is a bullish Piercing pattern at the low, but it is weak and lacks support from volume, so it is not convincing.
Conditions did not reach oversold and price did not reach next support on this pullback.
Published @ 06:43 p.m. ET.
—
Careful risk management protects your trading account(s).
Follow my two Golden Rules:
1. Always trade with stops.
2. Risk only 1-5% of equity on any one trade.
—
New updates to this analysis are in bold.