
GOLD: Elliott Wave and Technical Analysis | Charts – November 24, 2020
Downwards movement continues as the main Elliott wave count expects.
Summary: The first wave count is bearish for the bigger picture, and it has a main and an alternate daily chart. The main daily chart expects a multi-year bear market may be in its early stages to end below 1,046. Short-term targets are at 1,767 and then at 1,709. A long term target is at 657. The alternate daily chart has a low probability and would be invalidated below 1,764.12.
The second wave count is bullish for the bigger picture. It expects a multi-month to multi-year pullback or consolidation (within a larger bull market) may be in its early stages to possibly end about either 1,722.96 or 1,508.27.
Grand SuperCycle analysis is here.
Last analysis of monthly charts is here.
FIRST ELLIOTT WAVE COUNT
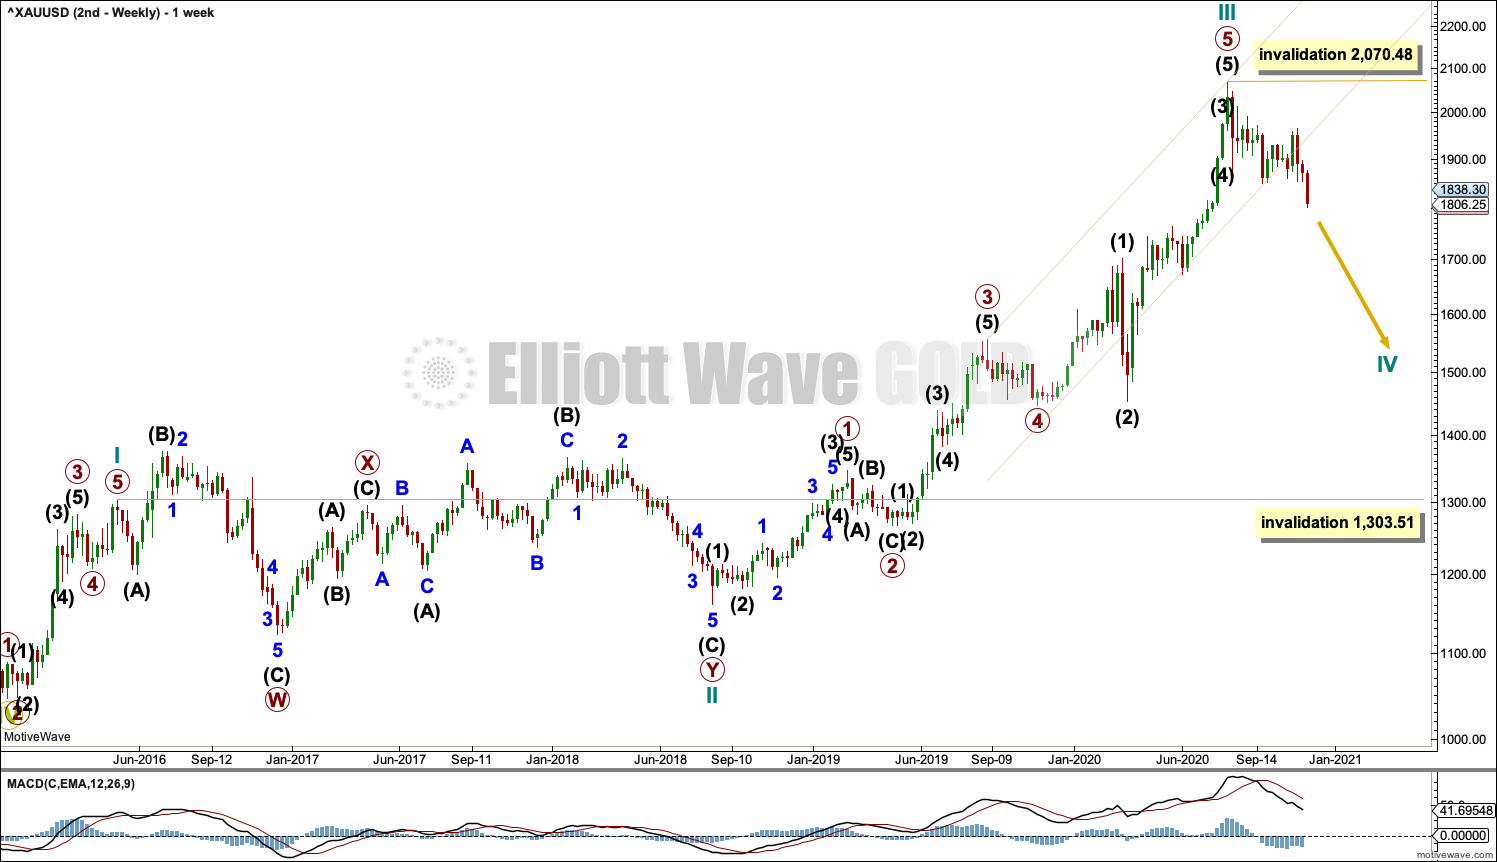
WEEKLY CHART
Click chart to enlarge.
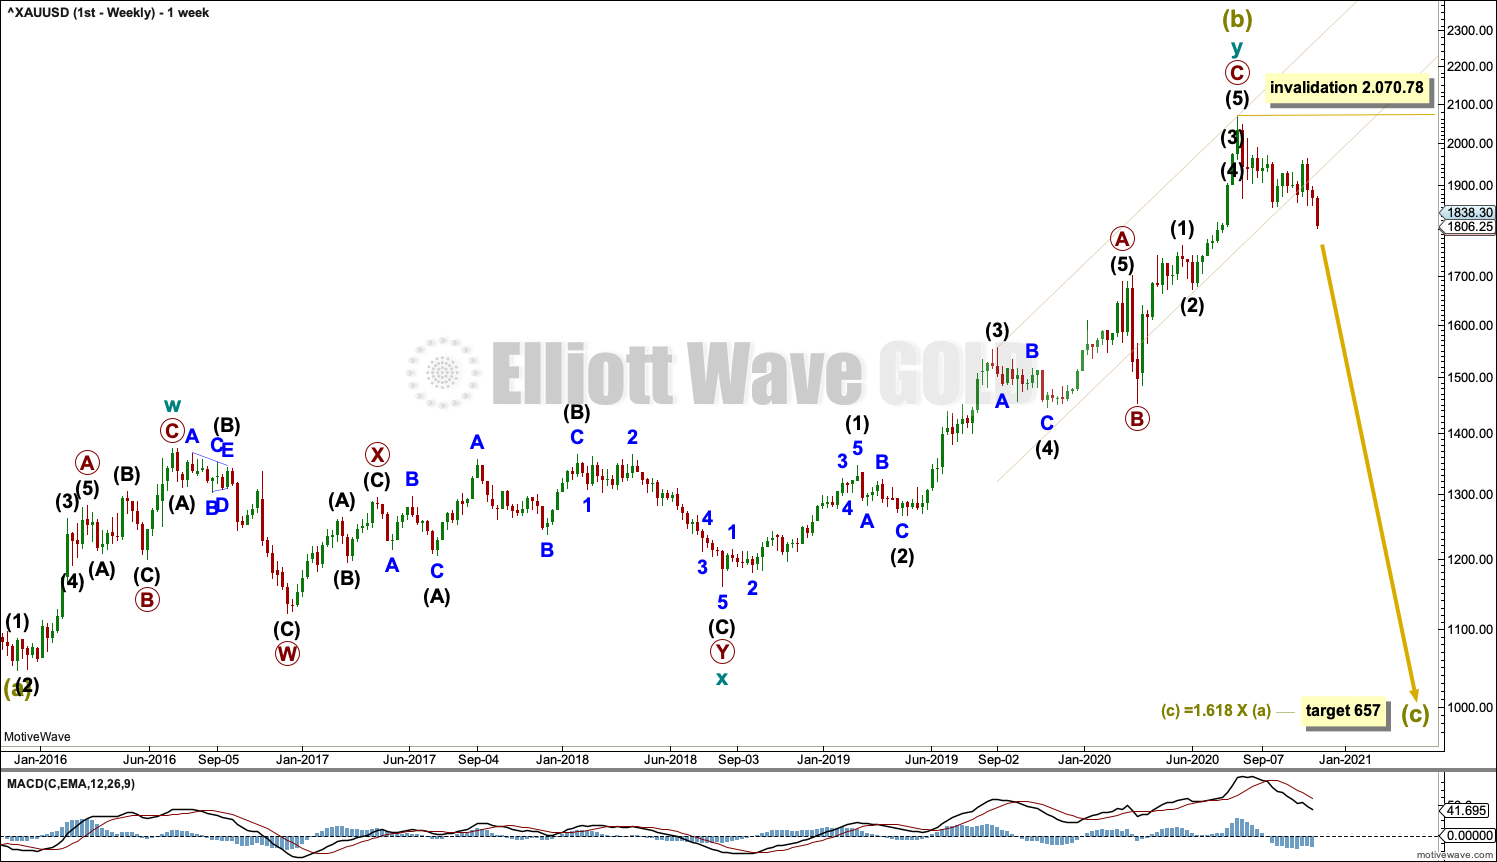
The bigger picture for this first Elliott wave count sees Gold as still within a bear market, in a three steps back pattern that is labelled Grand Super Cycle wave IV on monthly charts. Grand Super Cycle wave IV may be subdividing as an expanded flat pattern.
Super Cycle wave (b) within Grand Super Cycle wave IV may be a complete double zigzag. This wave count expects Super Cycle wave (c) to begin and to move price below the end of Super Cycle wave (a) at 1,046.27. The target calculated expects a common Fibonacci ratio for Super Cycle wave (c).
The first zigzag in the double is labelled cycle wave w. The double is joined by a three in the opposite direction, a combination labelled cycle wave x. The second zigzag in the double is labelled cycle wave y.
The purpose of the second zigzag in a double is to deepen the correction. Cycle wave y has achieved this purpose.
A best fit channel is drawn about primary wave C to contain as much of this movement as possible. Copy this channel over to daily charts. This channel is now clearly breached, which suggests the upwards wave labelled cycle wave y may be over.
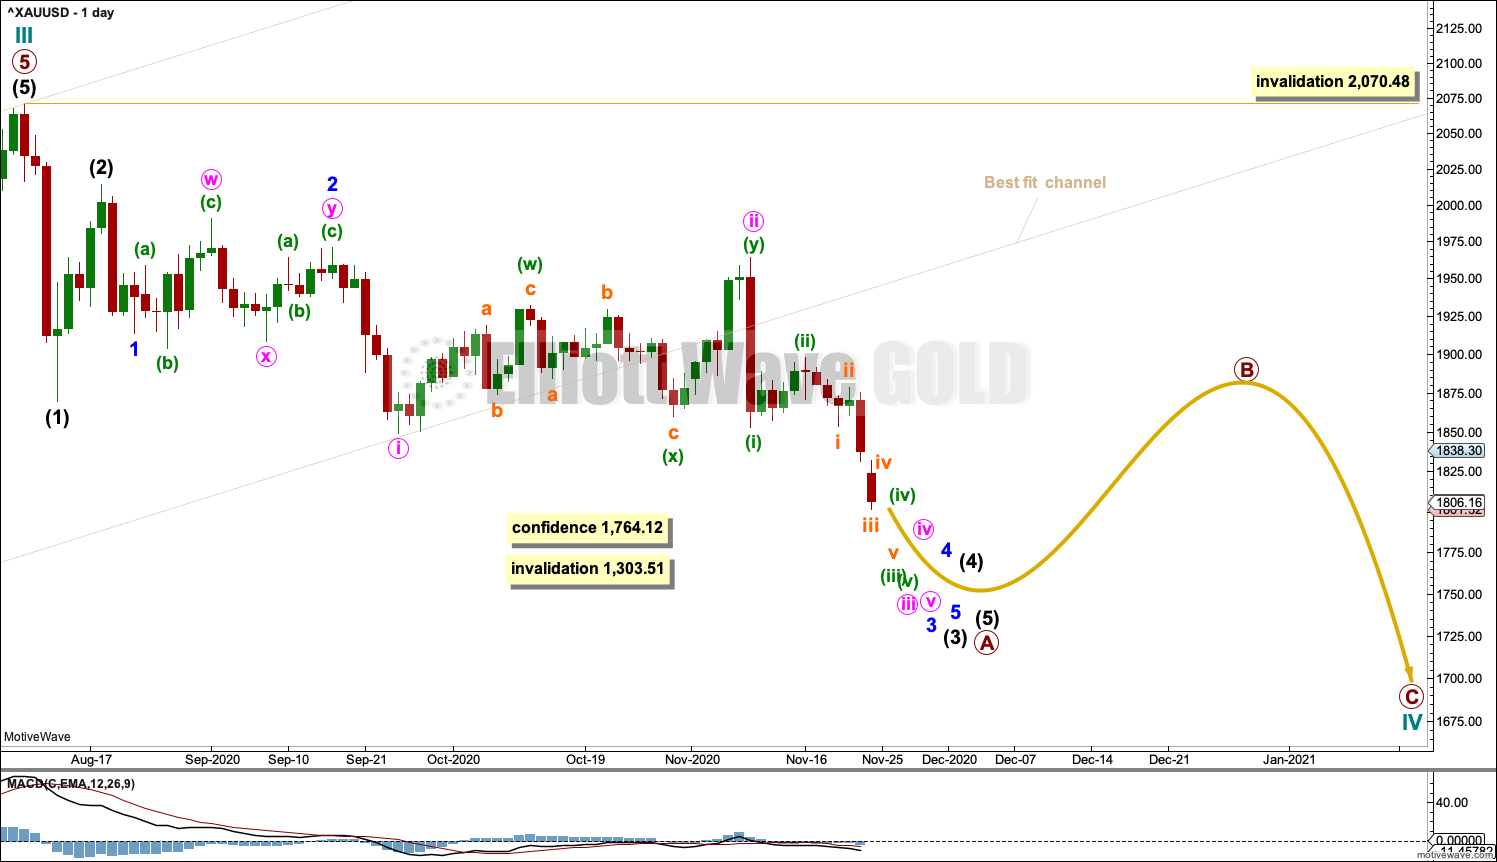
DAILY CHART
Click chart to enlarge.
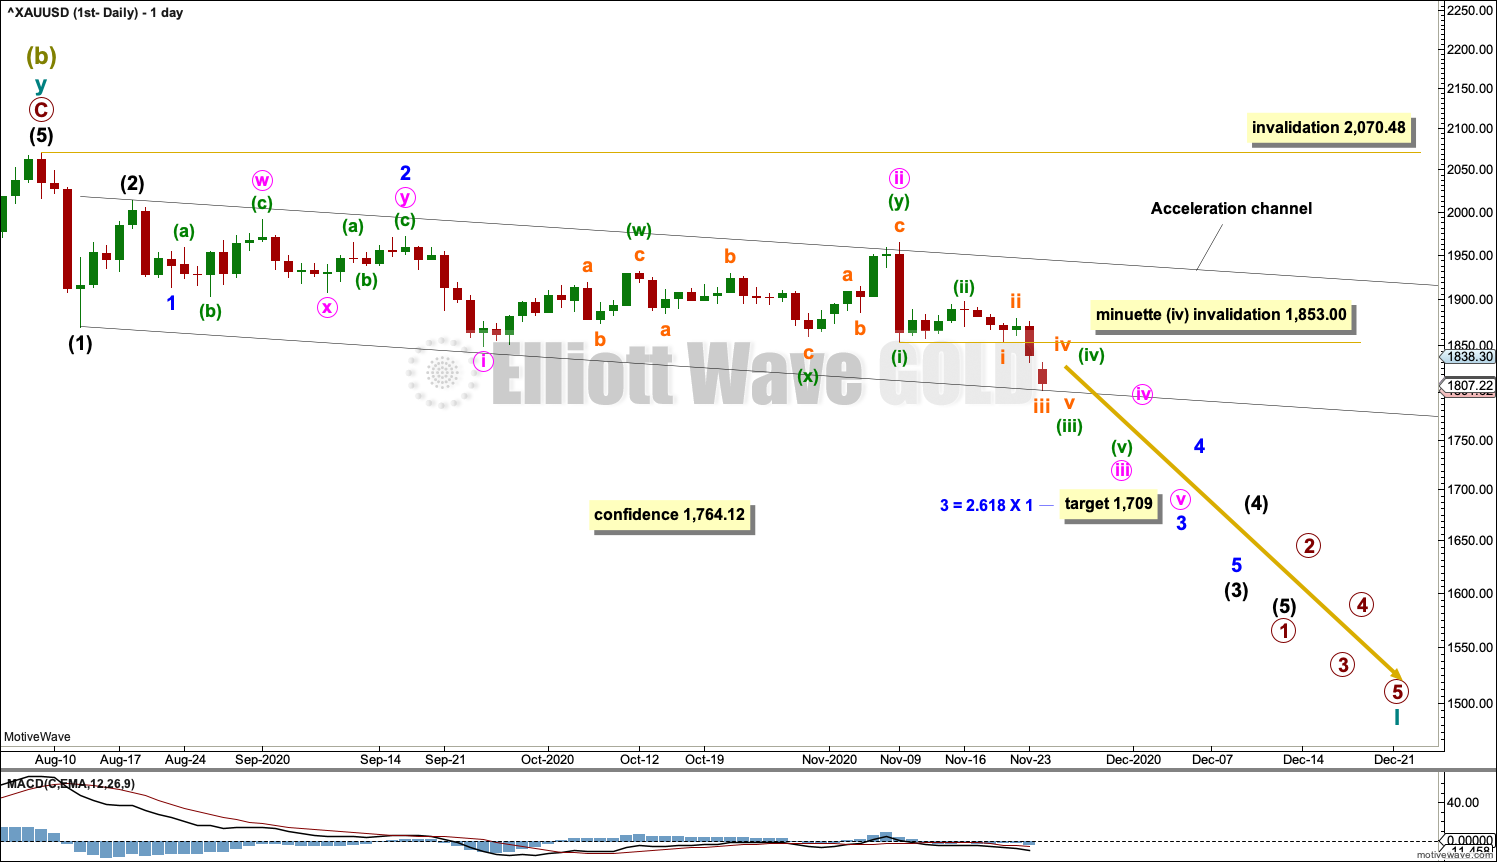
Within a new bear market, primary wave 1 may be an incomplete five wave impulse.
Primary wave 2 within the new downwards trend may not move beyond the start of primary wave 1 above 2,070.48.
Within primary wave 1, the middle portion may have passed today. Gold typically exhibits extended and strong fifth waves; this tendency is especially prevalent for fifth waves to end third wave impulses one degree higher. One or more of subminuette wave v, minuette wave (v), minute wave v and minor wave 5 may exhibit this tendency; there may be one or more selling climaxes along the way down.
Draw an acceleration channel about downwards movement and keep redrawing the channel as price continues lower. Draw the first trend line from the end of intermediate wave (1) to the last low, then place a parallel copy on the end of intermediate wave (2). When intermediate wave (3) may be complete, then this channel would be drawn using Elliott’s technique about primary wave 1.
A new low below 1,764.12 would add reasonable confidence to this wave count.
Subminuette wave iv, minuette wave (iv), minute wave iv and minor wave 4 may be relatively brief and shallow.
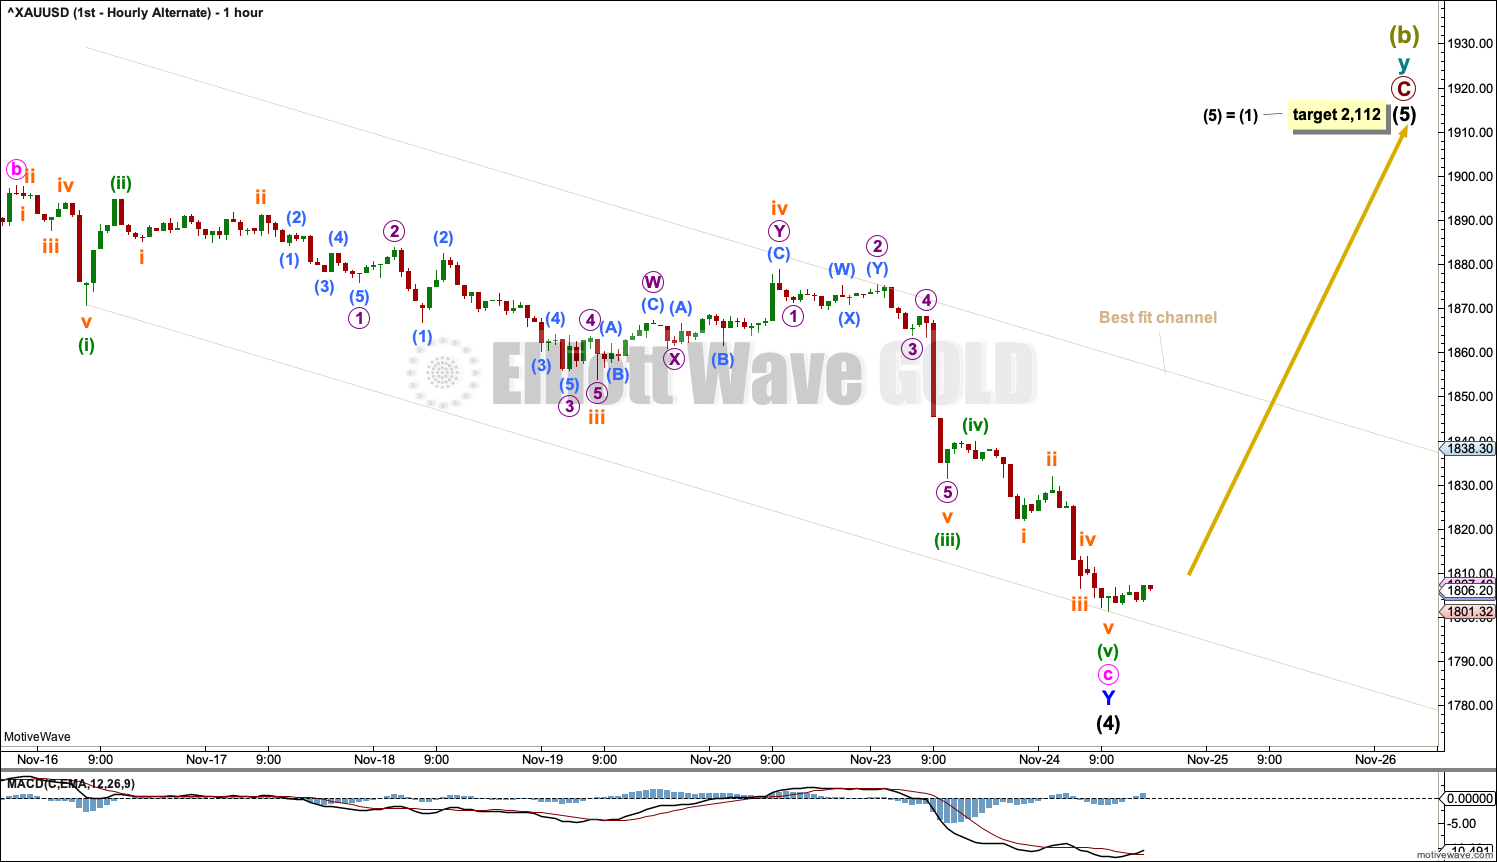
HOURLY CHART
Click chart to enlarge.
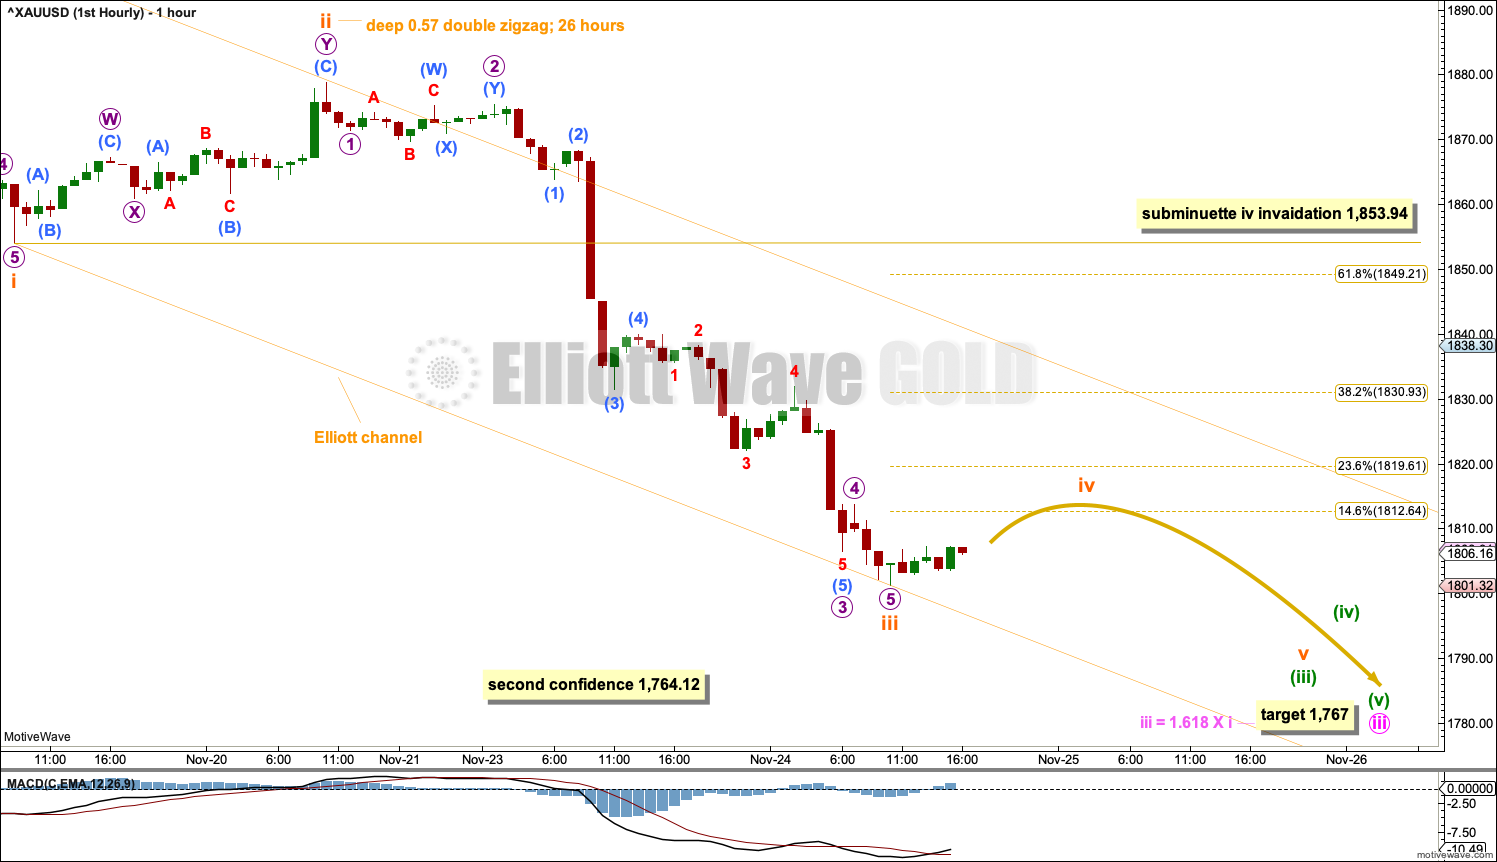
The hourly chart focusses on the middle of a third wave, from the low labelled subminuette wave i (which may now be seen on the daily chart). If subminuette wave iii is over as labelled, then it would be 6.34 longer than 1.618 the length of subminuette wave i.
Subminuette wave ii was a relatively deep and time consuming double zigzag; it shows up on the daily chart as it lasted over 24 hours. Subminuette wave iv may be more brief; it may be over within a day and may not show up on the daily chart. Subminuette wave iv may be shallow in relation to subminuette wave iii; the 0.146 and 0.236 Fibonacci ratios may be reasonable targets for resistance. If subminuette wave iv is more time consuming or deeper than expected, then it may find resistance at the upper edge of the Elliott channel.
Subminuette wave v downwards may exhibit a further increase in strength.
ALTERNATE DAILY CHART
Click chart to enlarge.
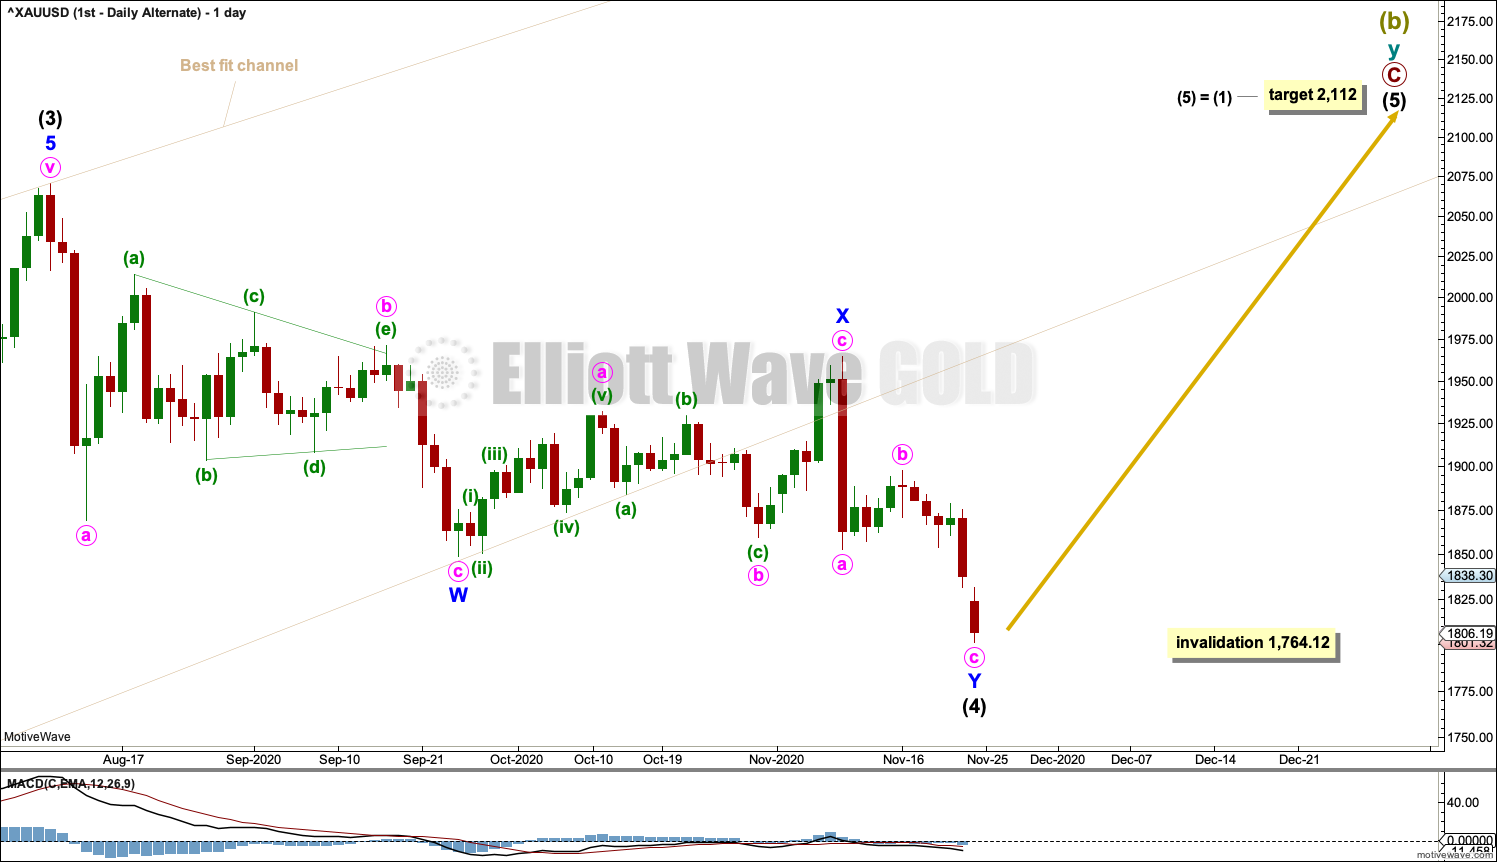
Primary wave C may be incomplete.
Intermediate wave (4) may have continued a little lower as a double zigzag. Intermediate wave (4) is now grossly disproportionate to intermediate wave (2); intermediate wave (2) lasted 14 sessions, whereas intermediate wave (4) so far has lasted 77 sessions. This disproportion gives the wave count the wrong look and reduces its probability further.
The wide beige channel is copied over from the weekly chart. Price has now breached the channel. This channel breach favours the main wave count.
Intermediate wave (4) may not move into intermediate wave (1) price territory below 1,764.12. This is the final price point which would invalidate this wave count.
ALTERNATE HOURLY CHART
Click chart to enlarge.
The second zigzag in the double for intermediate wave (4) may be complete. A breach of the best fit channel would be required for any initial confidence in this wave count at this stage.
SECOND ELLIOTT WAVE COUNT
WEEKLY CHART
Click chart to enlarge.
This wave count sees the the bear market complete at the last major low for Gold on 3 December 2015.
If Gold is in a new bull market, then it should begin with a five wave structure upwards on the weekly chart.
Cycle wave I fits as a five wave impulse with reasonably proportionate corrections for primary waves 2 and 4.
Cycle wave II fits as a double flat. However, within the first flat correction labelled primary wave W, this wave count needs to ignore what looks like an obvious triangle from July to September 2016 (this can be seen labelled as a triangle on the first wave count above). This movement must be labelled as a series of overlapping first and second waves. Ignoring this triangle reduces the probability of this wave count in Elliott wave terms.
Cycle wave III may be complete.
A best fit channel is drawn about cycle wave III in the same way as the channel as on the first wave count.
DAILY CHART
Click chart to enlarge.
Cycle wave III may be complete, and cycle wave IV may be underway.
Cycle wave IV may subdivide as any one of more than 23 Elliott wave corrective structures. It would most likely subdivide as a zigzag. A new bearish trend at cycle degree should begin with a five wave structure downwards at the daily chart level; this would be incomplete. No second wave correction within this first five down may move beyond the start of its first wave above 2,070.48.
Targets for cycle wave IV at this stage may be calculated from Fibonacci ratios of cycle wave III. Cycle wave IV may end at either one of the 0.382 Fibonacci ratio at 1,722.96 or the 0.618 Fibonacci ratio at 1,508.27. Cycle wave IV may not move into cycle wave I price territory below 1,303.51 (this can be seen on the weekly chart).
The short-term picture at the hourly chart level for this wave count looks exactly the same as the hourly chart for the first wave count.
TECHNICAL ANALYSIS
WEEKLY CHART
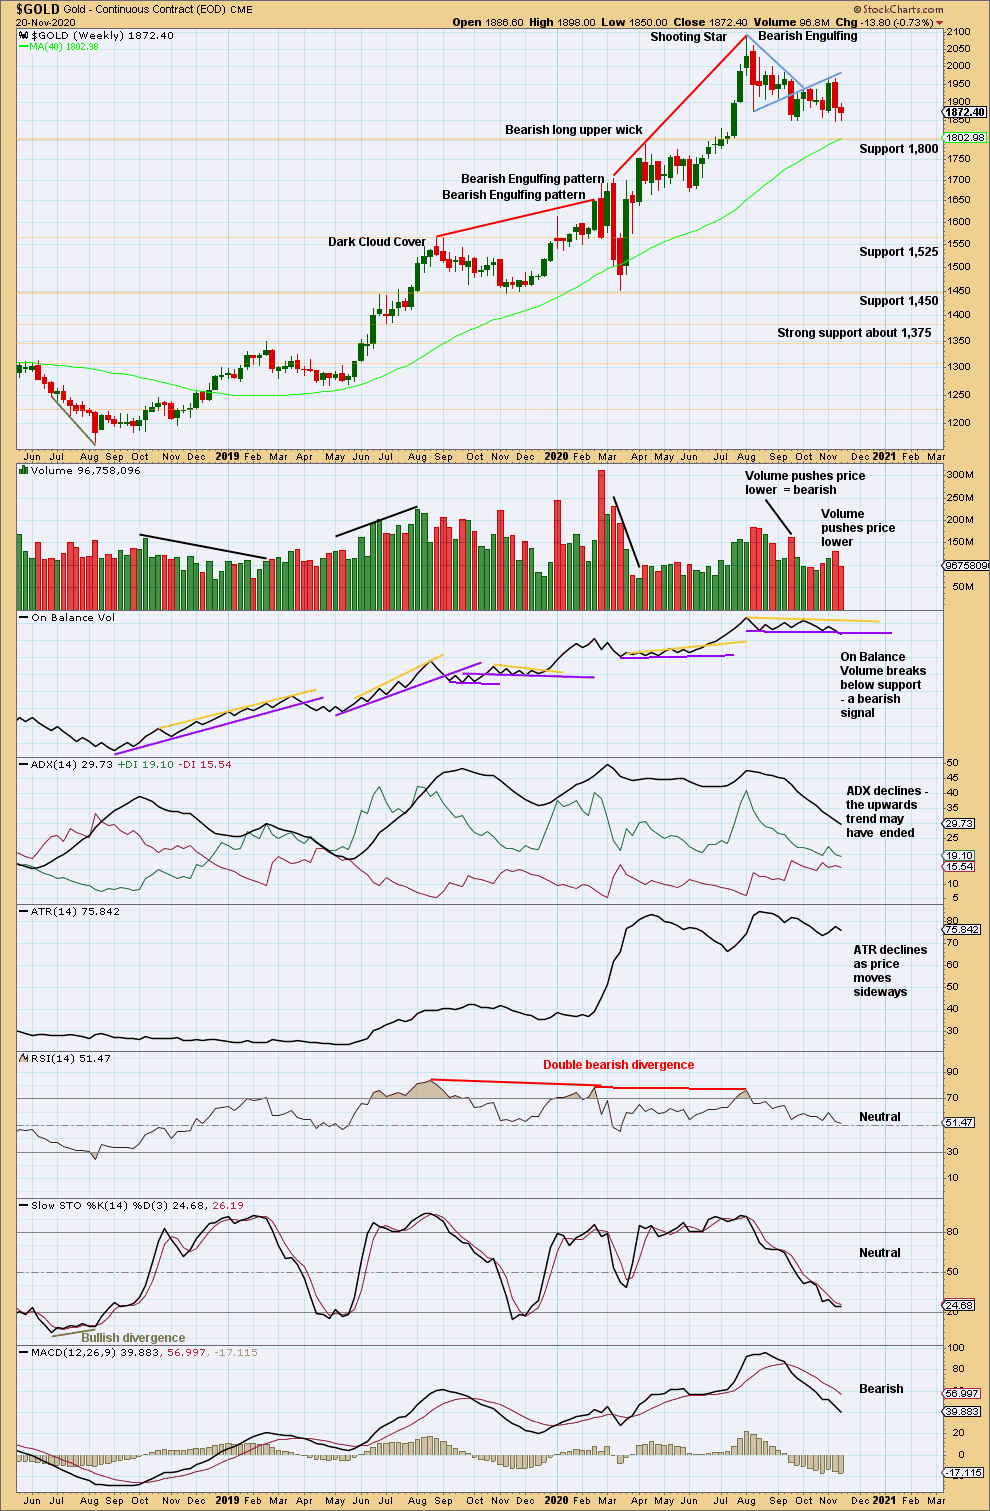
Click chart to enlarge. Chart courtesy of StockCharts.com.
At the last high were two bearish candlestick patterns with overbought RSI exhibiting double bearish divergence. It is possible there may have been a 180° trend change at the high. A new swing low below 1,671.70 would add confidence in that view.
Last week On Balance Volume breaks below support. The support line is reasonably long held and horizontal, but it has been tested only three prior times. The signal is a reasonable bearish signal. This, in conjunction with strong volume for downwards weeks and days, suggests a downwards breakout may be more likely than upwards.
DAILY CHART
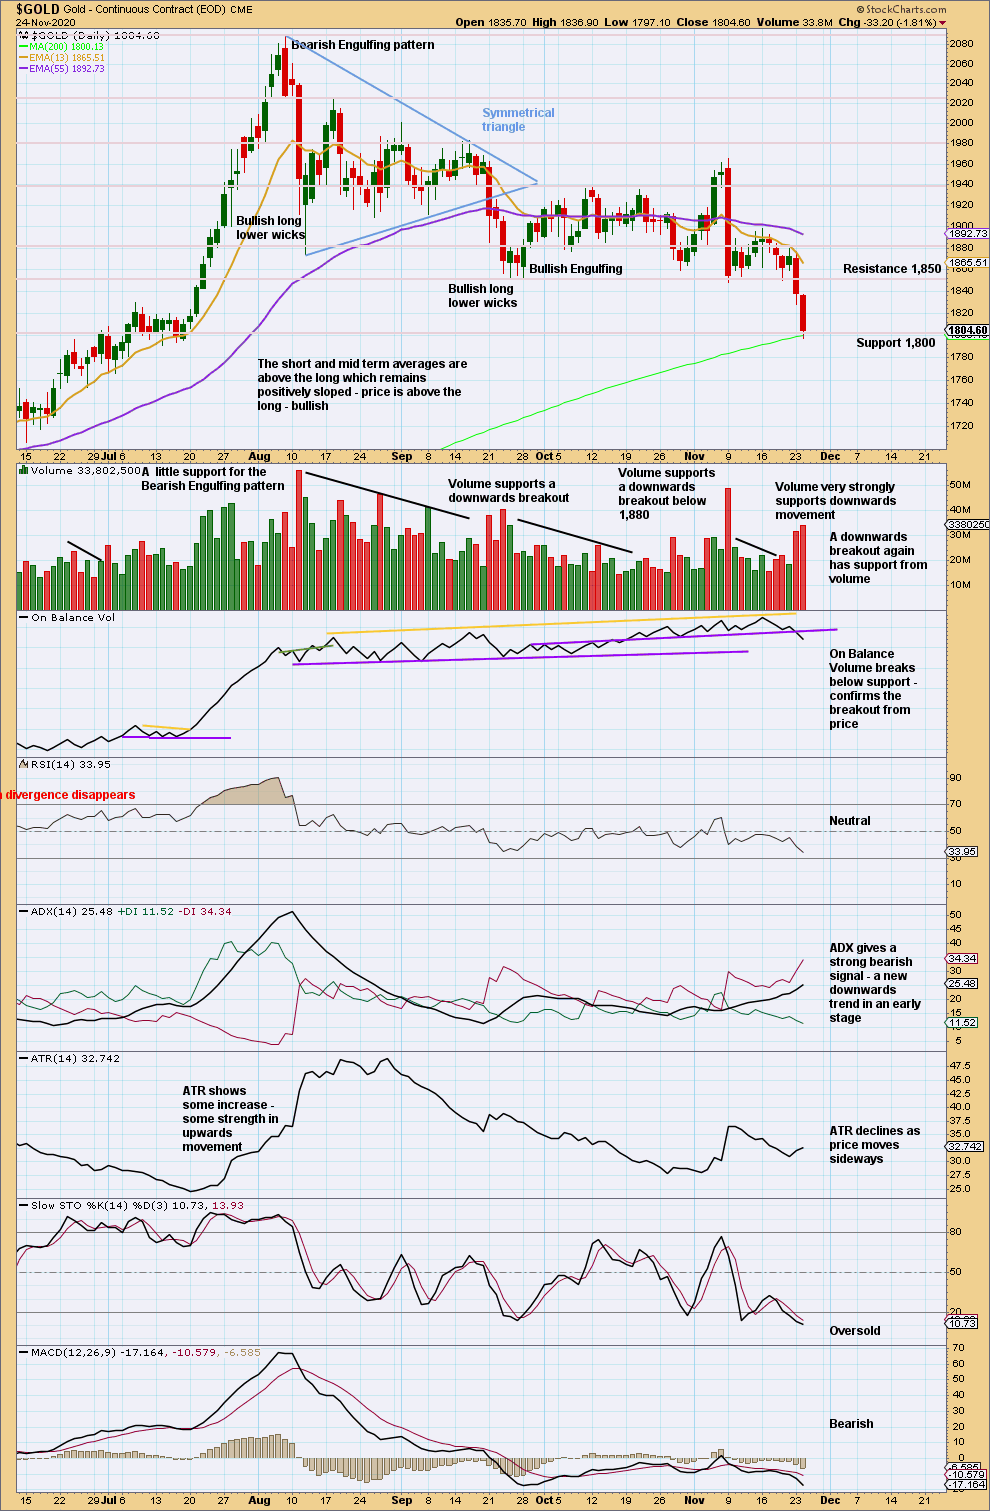
Click chart to enlarge. Chart courtesy of StockCharts.com.
Next support below is at 1,670 to 1,675.
Stochastics may remain extreme for reasonable periods of time when Gold trends. When ADX and RSI both reach extreme, and thereafter RSI exhibits bullish divergence, then a low may be in place. While neither ADX nor RSI are yet extreme, there is room for this downwards trend to continue.
This chart supports the main Elliott wave counts.
GDX WEEKLY CHART
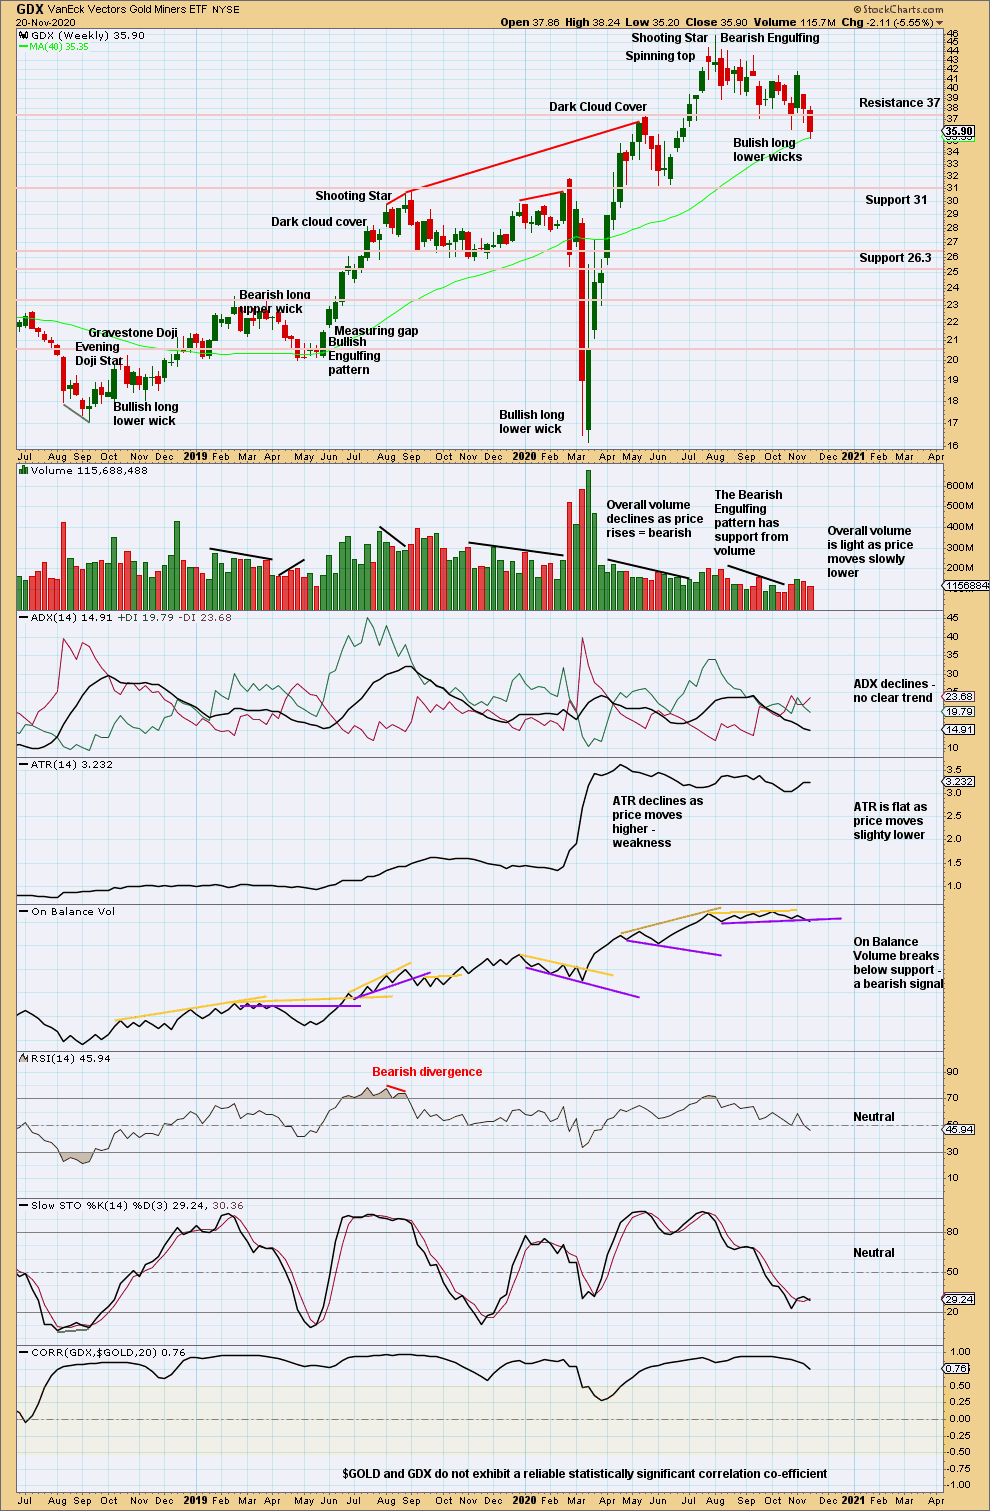
Click chart to enlarge. Chart courtesy of StockCharts.com.
A bearish signal from On Balance Volume this week also for GDX suggests more downwards movement ahead.
GDX DAILY CHART
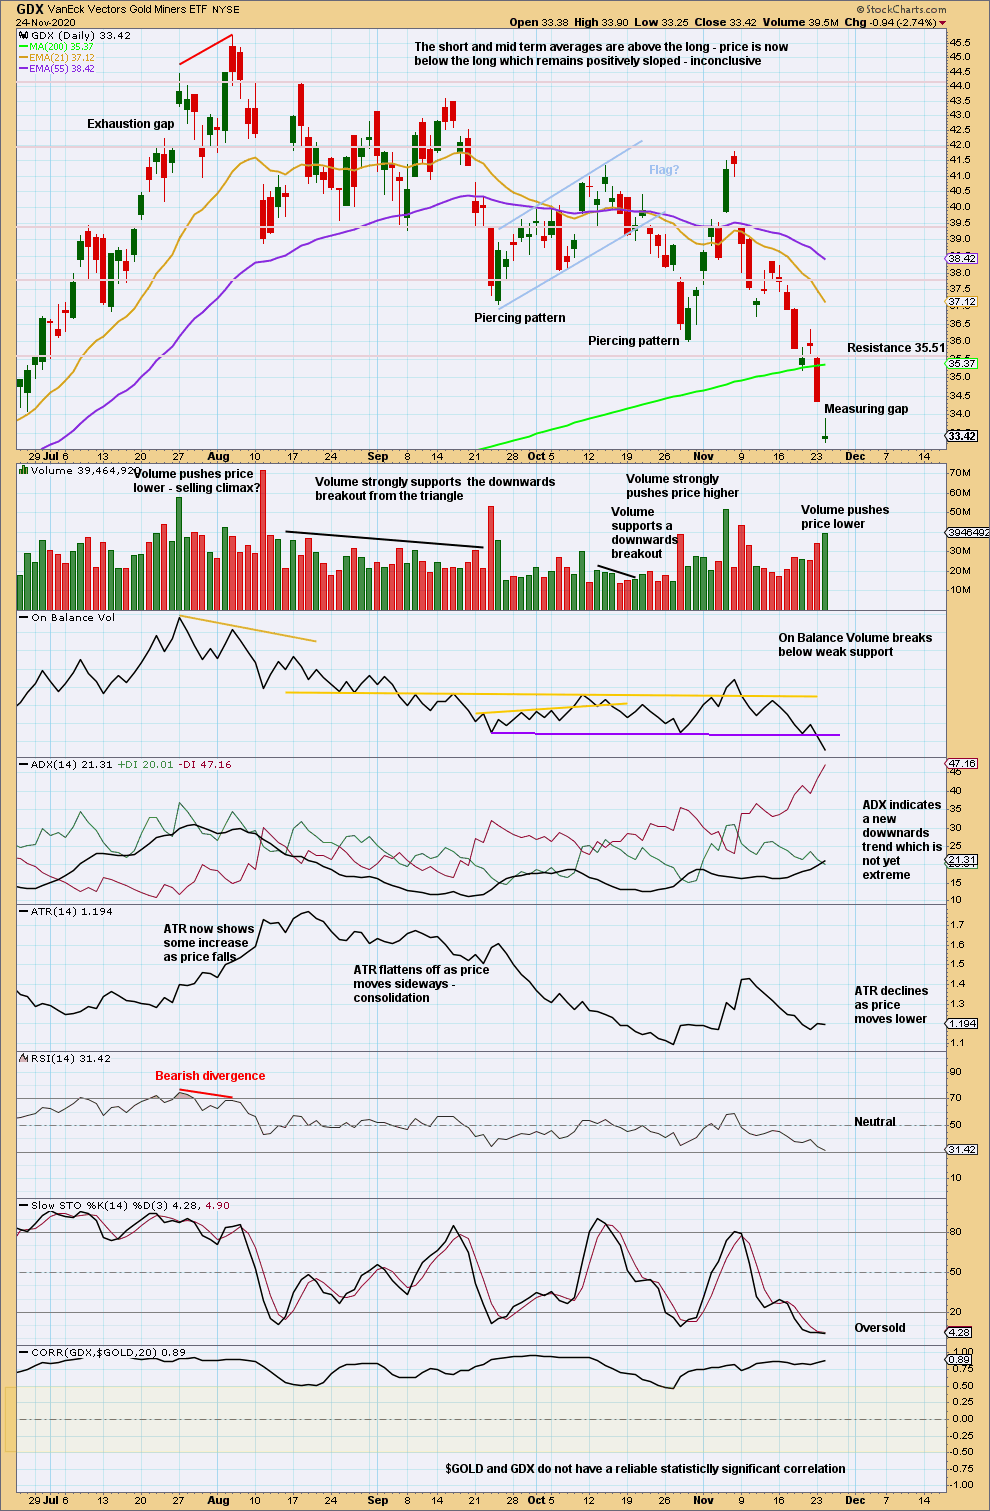
Click chart to enlarge. Chart courtesy of StockCharts.com.
Next support on the weekly chart is at 31. The measuring gap gives a target at 31.88.
Published @ 06:19 p.m. ET.
—
Careful risk management protects your trading account(s).
Follow my two Golden Rules:
1. Always trade with stops.
2. Risk only 1-5% of equity on any one trade.
—
New updates to this analysis are in bold.