
Lara’s Weekly: Elliott Wave and Technical Analysis of S&P500 and Gold and US Oil | Charts – November 13, 2020

S&P 500
Market breadth and volume this week support the main Elliott wave count.
Summary: The main wave count expects a low is now in. The target is at 4,606 and an invalidation point at 3,233.94.
If the main wave count is invalidated with a new low below 3,233.94 and then 2,191.86, then an alternate may be used. This wave count is very bearish. It expects a strong wave down to a target at 1,708. The invalidation point is 666.76. This alternate wave count does not have support from classic technical analysis.
The biggest picture, Grand Super Cycle analysis, is here.
Last monthly charts are here. Video is here.
ELLIOTT WAVE COUNTS
MAIN WAVE COUNT
WEEKLY CHART
Click chart to enlarge.
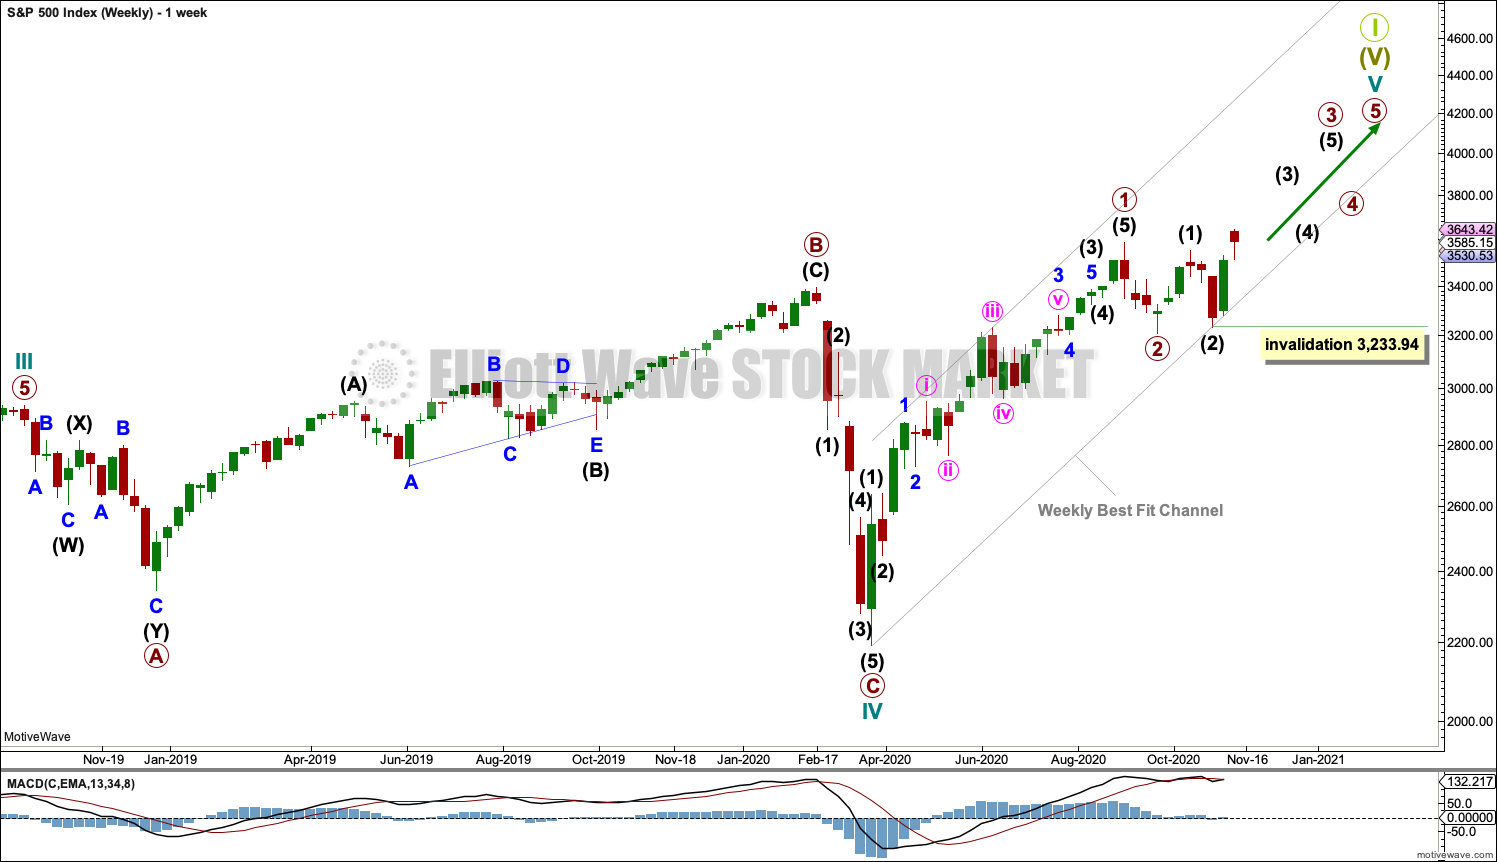
Cycle wave V may last from one to several years. So far it is in its eighth month.
This wave count may allow time for the AD line to diverge from price as price makes final highs before the end of the bull market. The AD line most commonly diverges a minimum of 4 months prior to the end of a bull market.
Cycle wave V would most likely subdivide as an impulse. But if overlapping develops, then an ending diagonal should be considered. This chart considers the more common impulse.
Primary waves 1 and 2 may be complete.
Primary wave 3 may only subdivide as an impulse.
There is already a Fibonacci ratio between cycle waves I and III within Super Cycle wave (V). The S&P500 often exhibits a Fibonacci ratio between two of its actionary waves but rarely between all three; it is less likely that cycle wave V would exhibit a Fibonacci ratio. The target for Super Cycle wave (V) to end would best be calculated at primary degree, but that cannot be done until all of primary waves 1, 2, 3 and 4 are complete.
DAILY CHART
Click chart to enlarge.
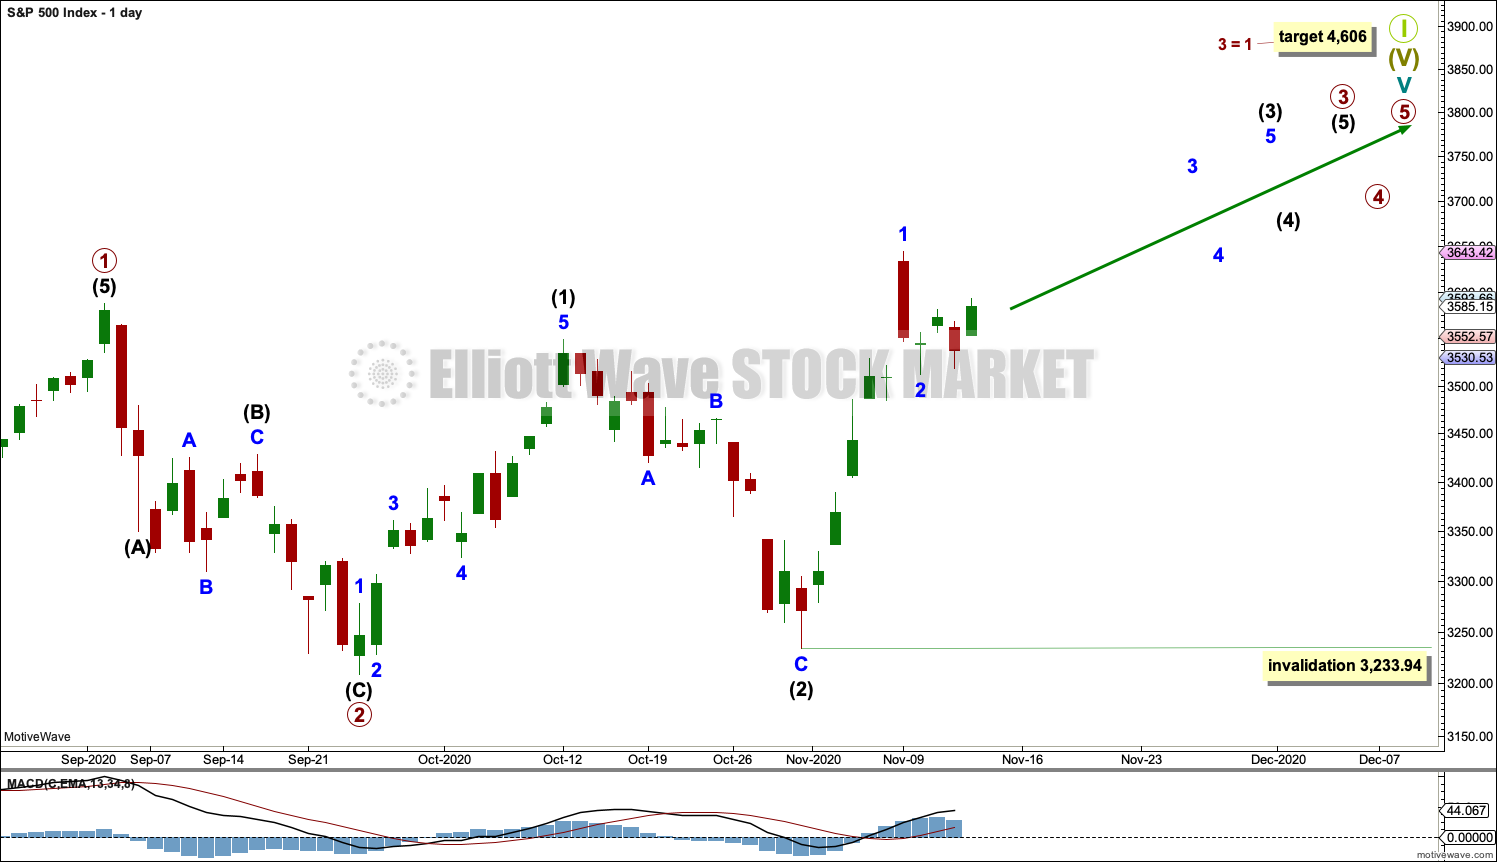
Primary waves 1 and 2 may both be complete. Primary wave 3 may now be underway.
Primary wave 3 may only subdivide as an impulse. Within primary wave 3: Intermediate waves (1) and (2) may both be complete, and intermediate wave (3) may now be underway and may only subdivide as an impulse.
No second wave correction within intermediate wave (3) may move beyond the start of its first wave below 3,233.94.
Primary wave 1 looks extended. The target for primary wave 3 expects it to also be extended.
ALTERNATE WAVE COUNT
WEEKLY CHART
Click chart to enlarge.
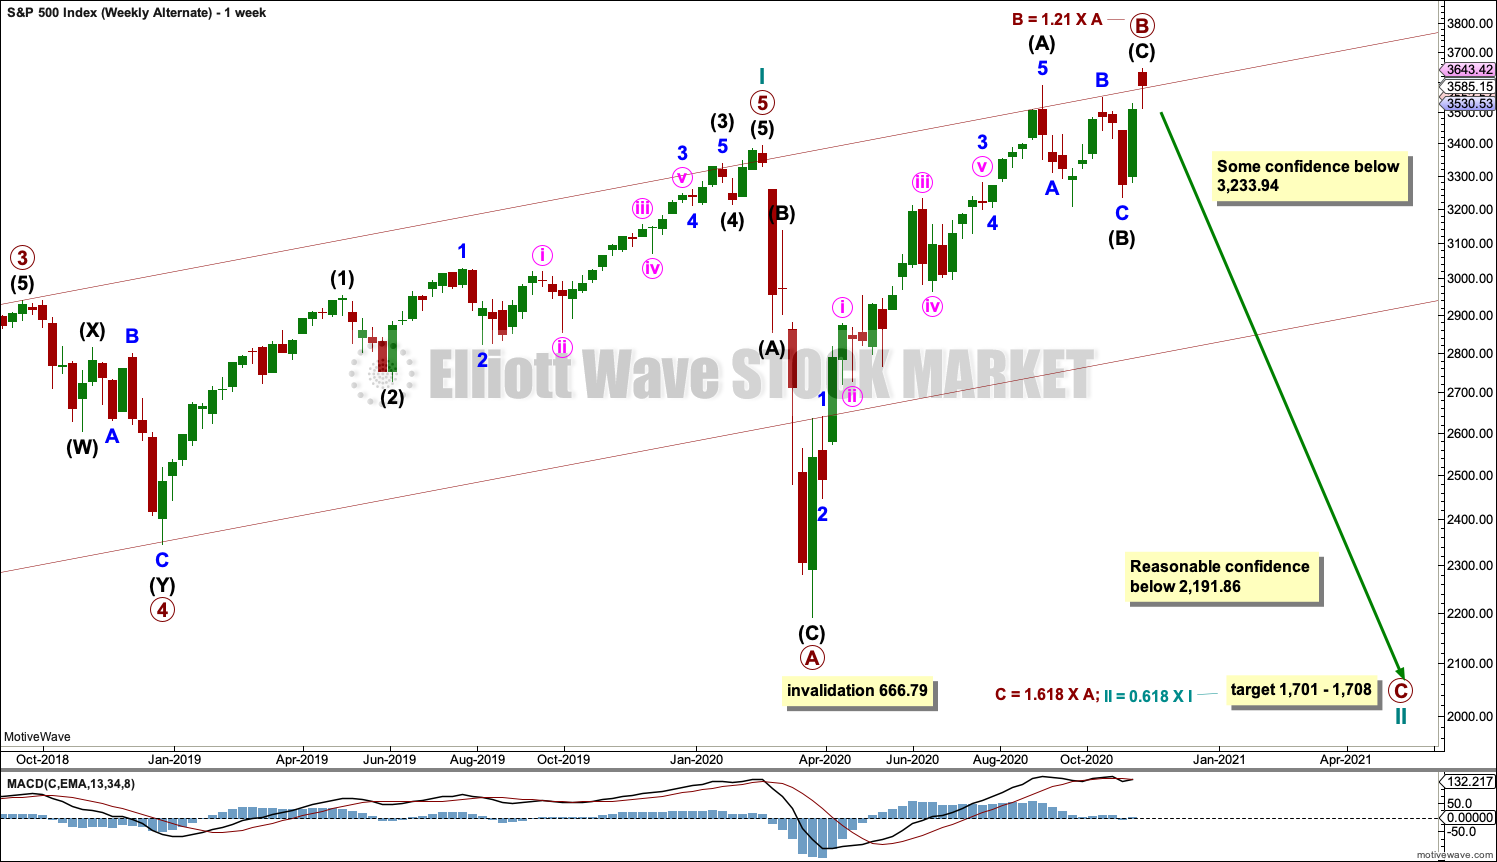
To view the material difference between the main and this alternate wave count, monthly charts should be viewed. There is a link to charts, text and video analysis of monthly charts at the top of this analysis.
Cycle wave II may be subdividing as an expanded flat. Primary wave B within the expanded flat is a 1.21 length of primary wave A, which is within the most common range for B waves within flats of up to 1.38. Expanded flats are reasonably common structures.
A 7 point target zone is calculated at two wave degrees.
Cycle wave II may not move beyond the start of cycle wave I below 666.79.
DAILY CHART
Click chart to enlarge.
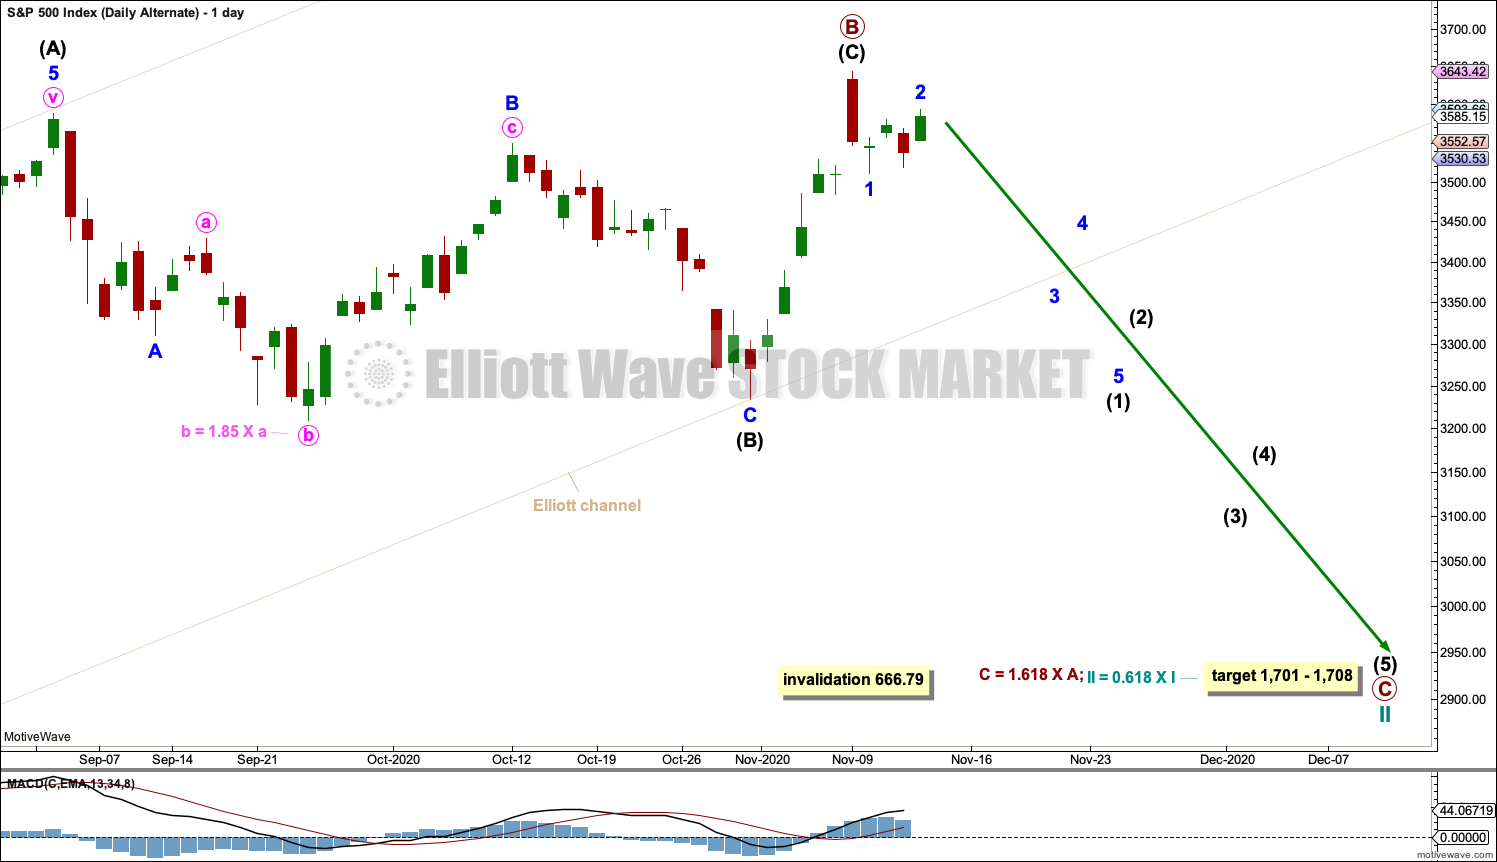
Primary wave B may be complete as a zigzag at today’s high. Primary wave C may now begin and must subdivide as a five wave motive structure, most likely an impulse.
Cycle wave II may not move beyond the start of cycle wave I below 666.79.
There is no upper invalidation point for this wave count; primary wave B could continue higher as a double zigzag. The common range for B waves within flat corrections is from 1 to 1.38 times the length of their corresponding A waves. This gives a range within primary wave B that may continue up to 3,850.15. Prior to this price point being reached, it may be possible to discard this alternate wave count based upon technical analysis.
TECHNICAL ANALYSIS
WEEKLY CHART
Click chart to enlarge. Chart courtesy of StockCharts.com.
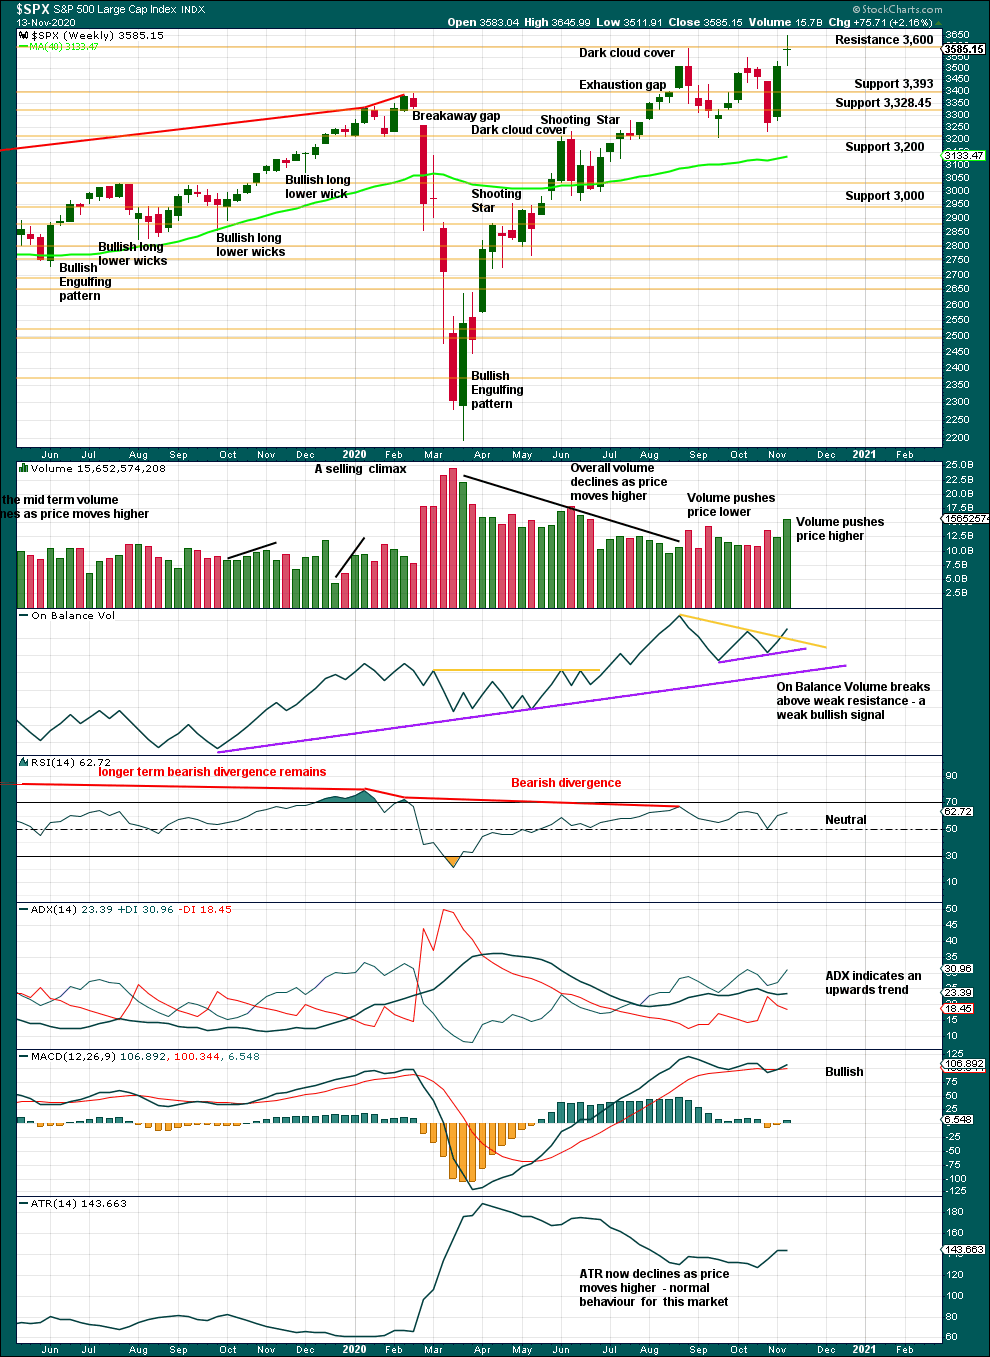
This chart is bullish and supports the main Elliott wave count. All of volume, On Balance Volume, ADX and MACD are bullish. The doji this week is not on its own a reversal signal; on its own a doji represents a pause. Only if next week completes a red candlestick that opens lower would the doji then be part of a bearish pattern, which has not happened yet.
DAILY CHART
Click chart to enlarge. Chart courtesy of StockCharts.com.
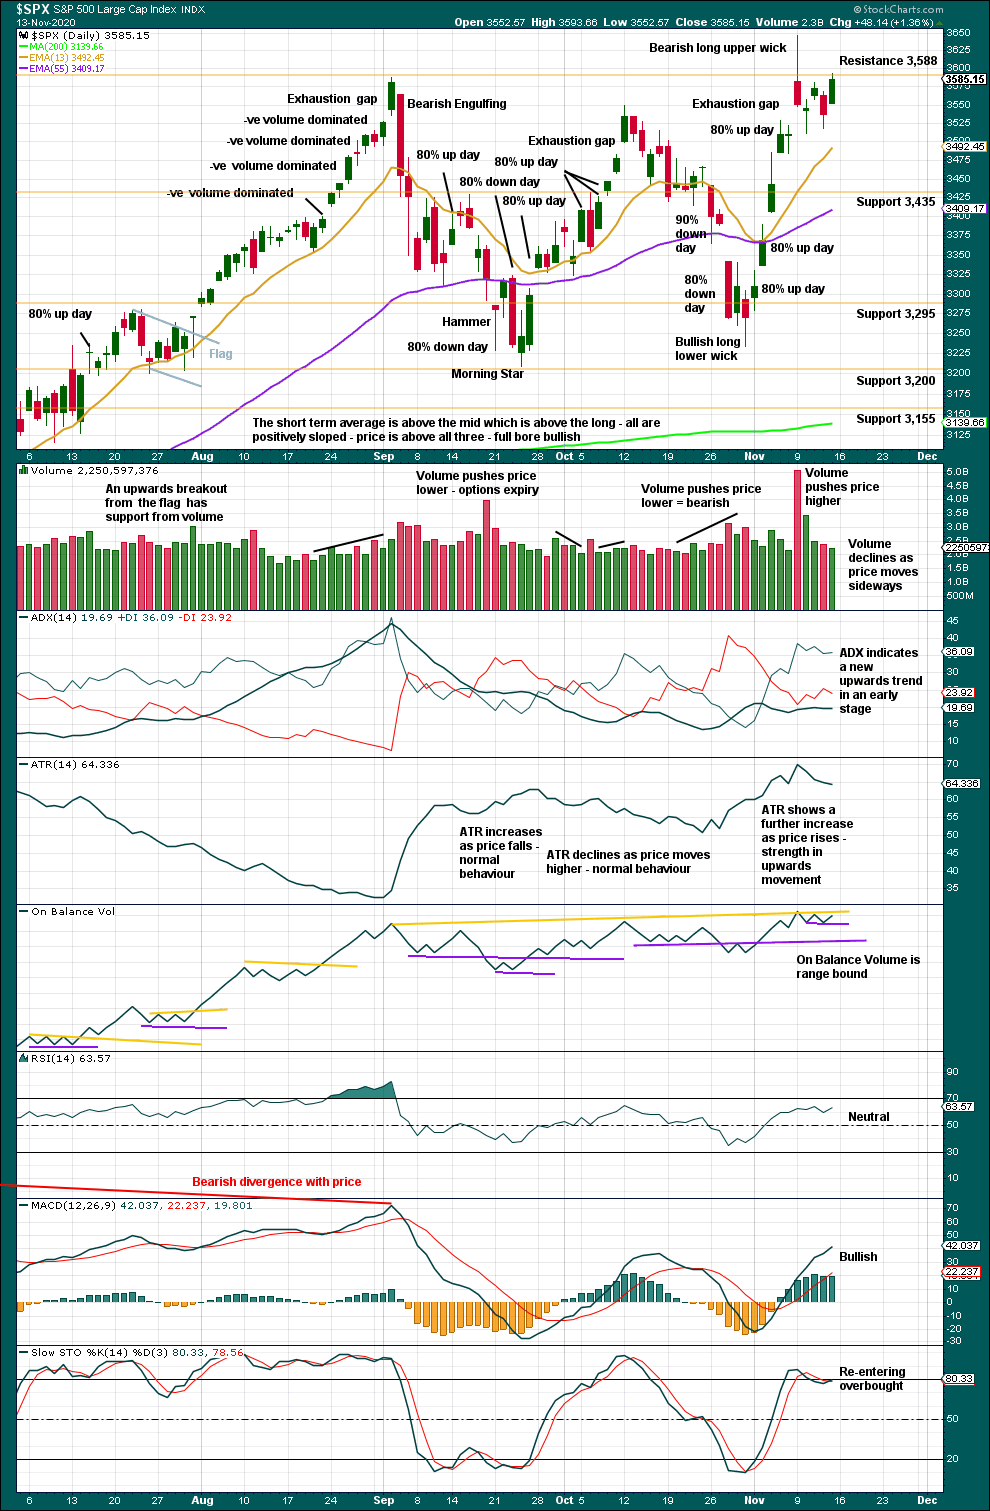
The gap is closed, so it is renamed an exhaustion gap. A small consolidation may have been the result after closure of this gap.
There is an upwards trend. When this market trends, then Stochastics may remain overbought for extended periods of time while price moves a considerable distance.
Resistance needs to be overcome before confidence that the consolidation is over may be had. This means that price needs to close above the prior all time high at 3,588.11 before we can have confidence that it will keep going up and not continue in the large sideways range price has been in since early September.
BREADTH – AD LINE
WEEKLY CHART
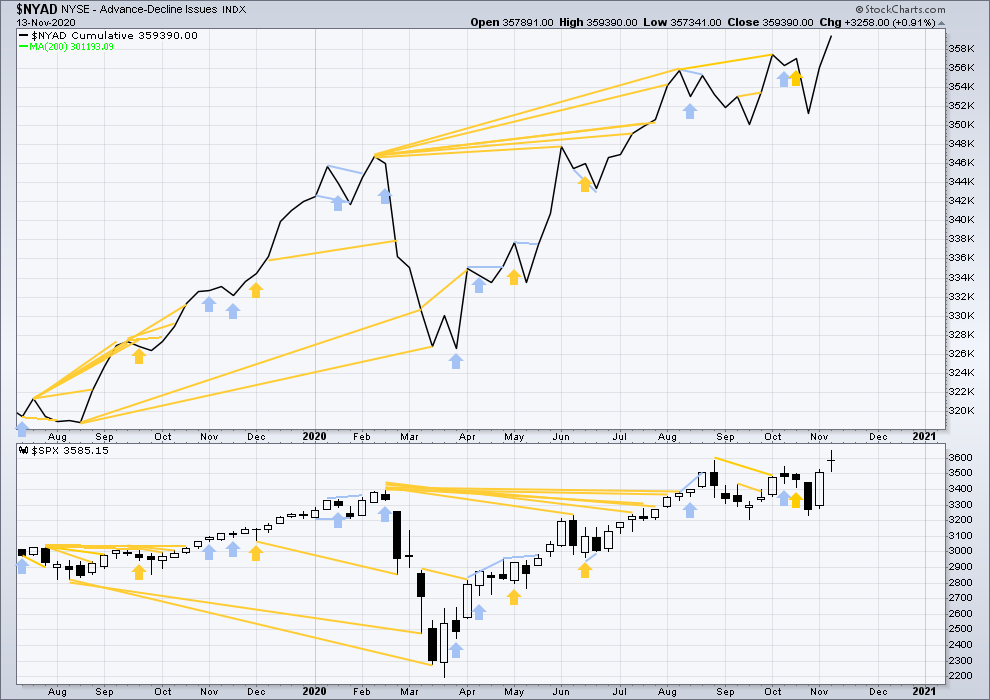
Click chart to enlarge. Chart courtesy of StockCharts.com. So that colour blind members are included, bearish signals will be noted with blue and bullish signals with yellow.
Breadth should be read as a leading indicator.
Lowry’s Operating Companies Only AD line has made a new all time high on the 12th of October. This erases prior bearish divergence with the last all time high in January 2020. With both the NYSE and OCO AD lines making new all time highs, breadth is leading price. This is a strong bullish signal and supports the main Elliott wave count.
Large caps all time high: 3,645.99 on November 9, 2020.
Mid caps all time high: 2,162.80 on November 9, 2020.
Small caps all time high: 1,100.58 on August 27, 2018.
This week both price and the AD line have made new all time highs. Upwards movement has support from rising market breadth. This supports the Elliott wave count.
DAILY CHART
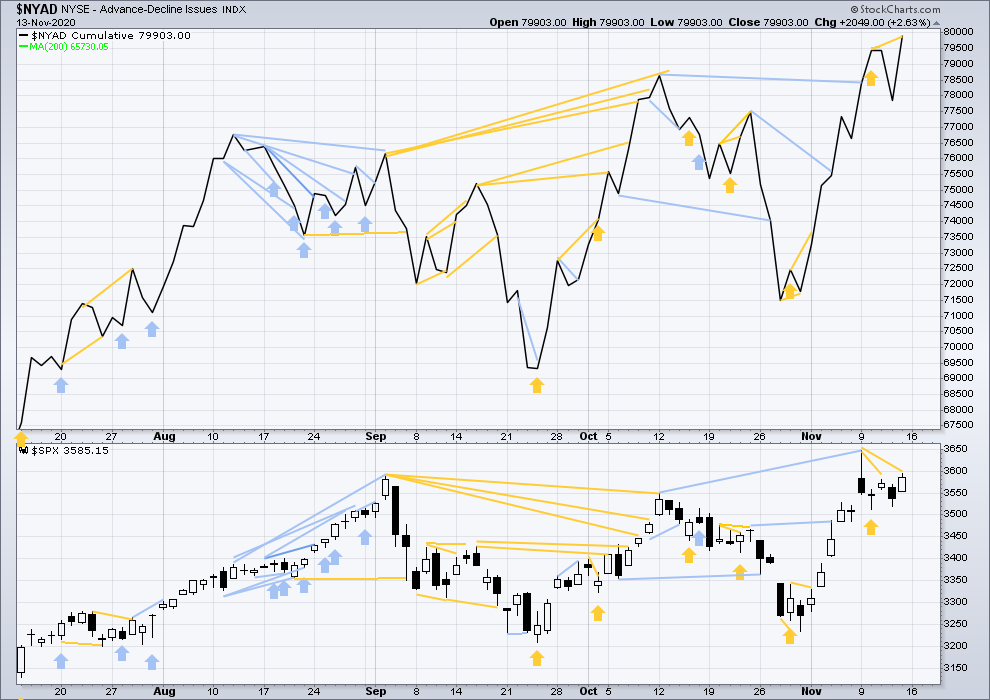
Click chart to enlarge. Chart courtesy of StockCharts.com. So that colour blind members are included, bearish signals will be noted with blue and bullish signals with yellow.
On Friday the AD line has made a new all time high, but price has not. This divergence is bullish and supports the main Elliott wave count.
VOLATILITY – INVERTED VIX CHART
WEEKLY CHART
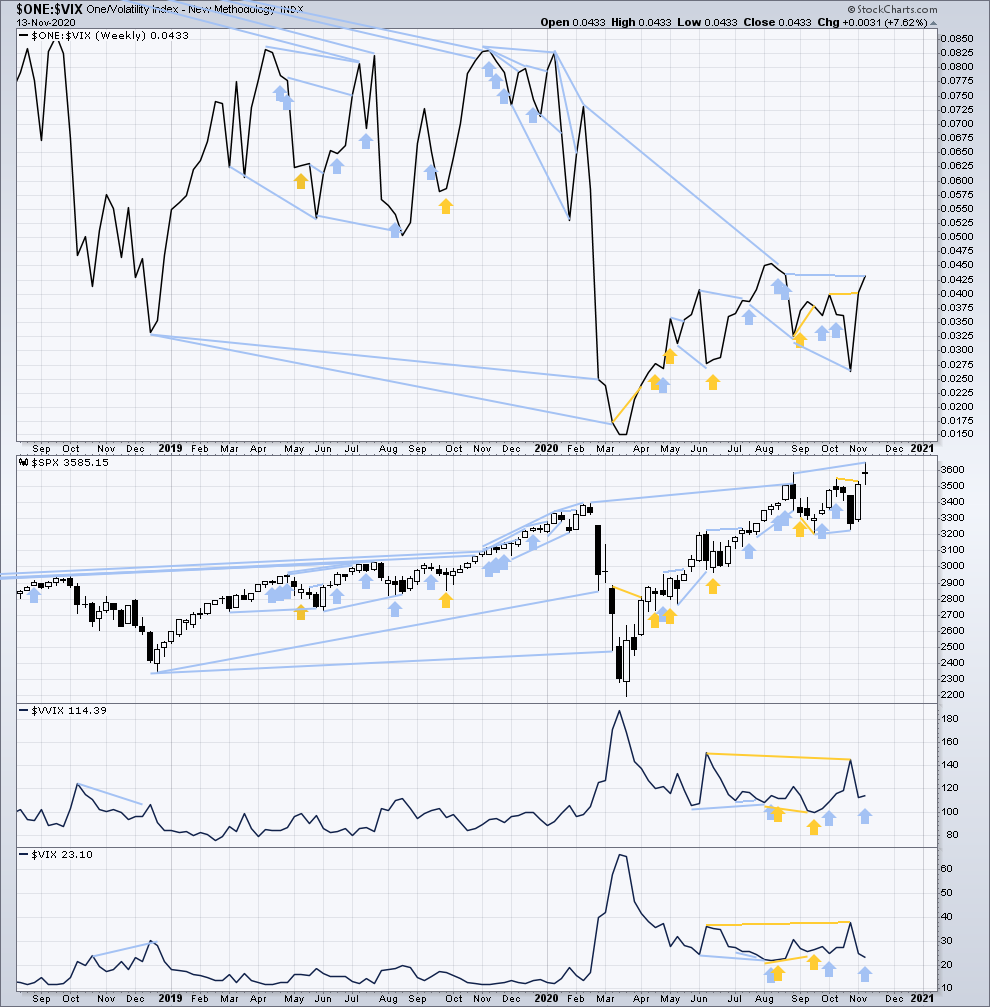
Click chart to enlarge. Chart courtesy of StockCharts.com. So that colour blind members are included, bearish signals will be noted with blue and bullish signals with yellow.
Inverted VIX remains well below all time highs. The all time high for inverted VIX was in the week beginning October 30, 2017. There is over 3 years of bearish divergence between price and inverted VIX. There is all of long, mid and short-term bearish divergence. This supports the alternate Elliott wave count.
This week price has made a new all time high, but inverted VIX has not. There is new short-term bearish divergence between price and inverted VIX.
Comparing VIX and VVIX: VIX has declined this week as price has risen, but VVIX has increased. This divergence is bearish for price for the short term.
DAILY CHART
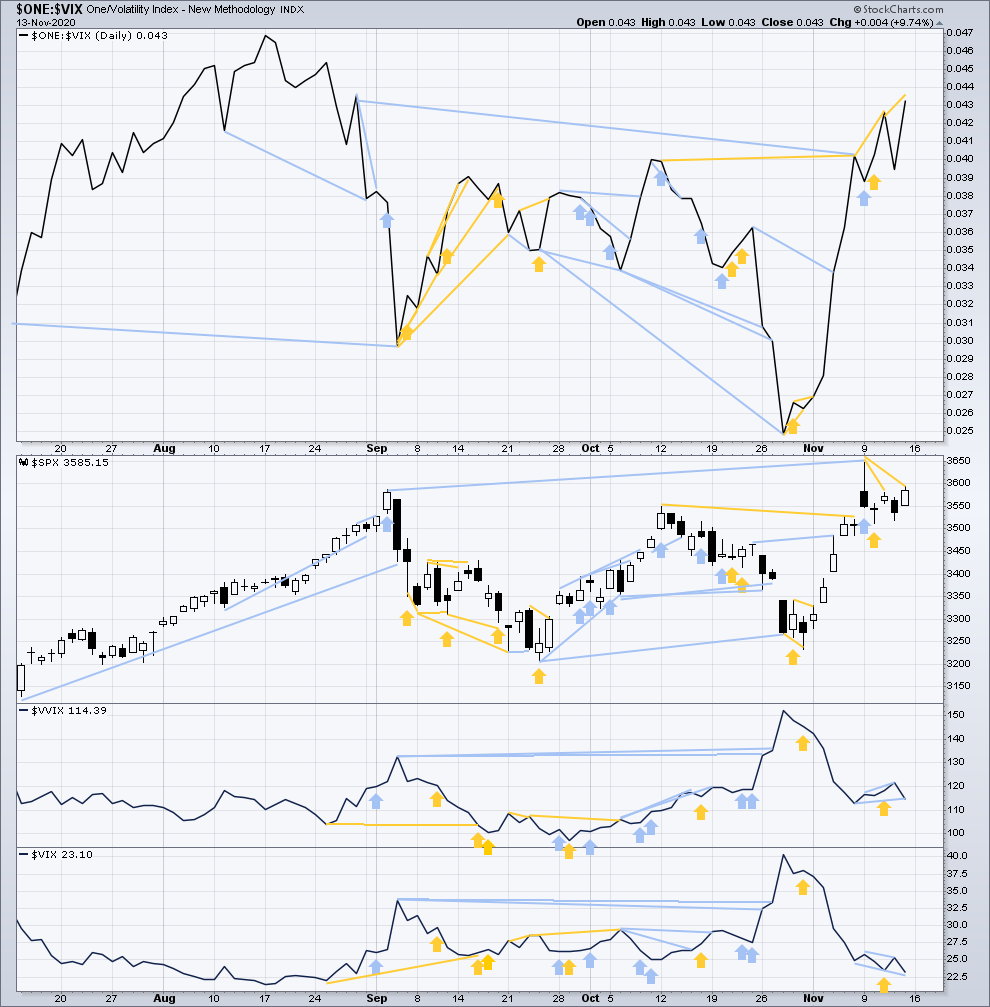
Click chart to enlarge. Chart courtesy of StockCharts.com. So that colour blind members are included, bearish signals will be noted with blue and bullish signals with yellow.
On Friday inverted VIX has made a new short term high, but price has not. This divergence is bullish and supports the main Elliott wave count.
Comparing VIX and VVIX at the daily chart level: Both VIX and VVIX have moved lower. VIX has made a new short term swing low, but VVIX has not. This divergence is bearish for price for the short term.
DOW THEORY
Dow Theory still concludes a bear market is in place.
Dow Theory confirmed a bear market with the following lows made on a closing basis:
DJIA: 21,712.53 – a close below this point was been made on the March 12, 2020.
DJT: 8,636.79 – a close below this point was been made on March 9, 2020.
Adding in the S&P and Nasdaq for an extended Dow Theory, a bear market was confirmed:
S&P500: 2,346.58 – a close below this point was made on March 20, 2020.
Nasdaq: 7,292.22 – a close below this point was made on the March 12, 2020.
At this time, to shift Dow Theory from viewing a bear market to confirmation of a new bull market would require new highs made on a closing basis:
DJIA: 29,568.57 – while DJIA made a new high above this point, it has still not closed above this point. Dow theory requires a close.
DJT: 11,623.58 – closed above on 7th October 2020.
Adding in the S&P and Nasdaq for an extended Dow Theory, confirmation of a bull market would require new highs made on a closing basis:
S&P500: 3,393.52 – closed above on 21st August 2020.
Nasdaq: 9,838.37 – closed above on June 8, 2020.
GOLD
Price remains range bound at the end of this week.
Classic technical analysis still supports the alternate wave counts, but they will remain alternates until price adds reasonable confidence.
Summary: The strength of downwards movement strongly favours the alternate Elliott wave counts. They may have a higher probability now than the main wave counts. A new low below 1,849.22 would see the main wave counts become alternates, or possibly discarded.
The first wave count is bearish for the bigger picture, and it has a main and an alternate daily chart. The main daily chart expects upwards movement. The alternate daily chart expects a multi-year bear market may be in its early stages to end below 1,046. The first short-term target is at 1,709. The first confidence point for this alternate remains at 1,849.22.
The second wave count is bullish for the bigger picture, and it has a main and an alternate daily chart. The main daily chart expects upwards movement (short term, both first and second wave counts have main daily charts which have the same expectation). The alternate daily chart expects a multi-month to multi-year bear market that may be in its early stages to possibly end about either 1,722.96 or 1,508.27.
Grand SuperCycle analysis is here.
Last analysis of monthly charts is here with video here.
FIRST ELLIOTT WAVE COUNT
WEEKLY CHART
Click chart to enlarge.
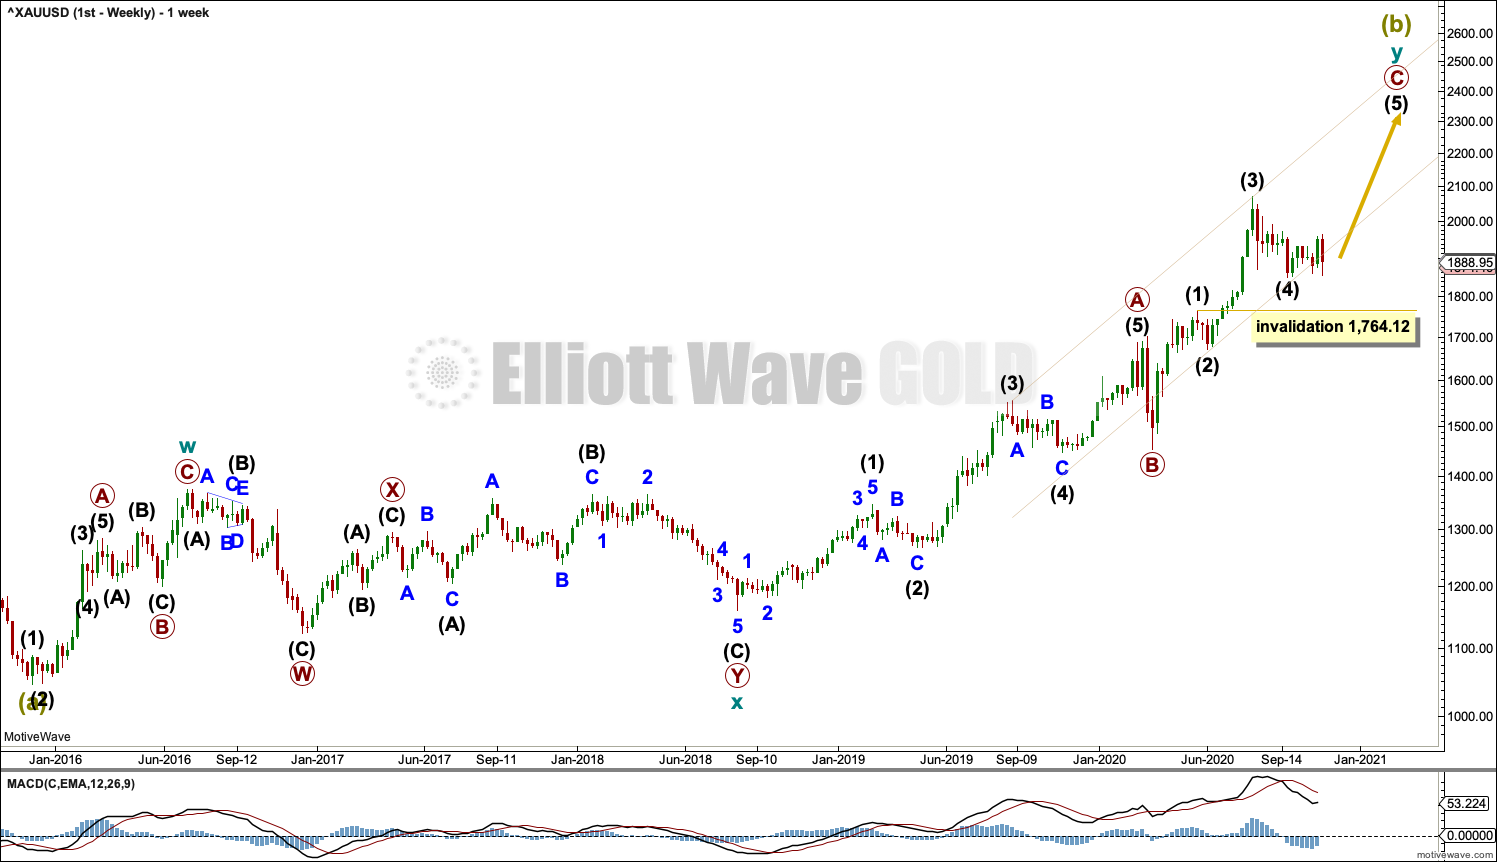
The bigger picture for this first Elliott wave count sees Gold as still within a bear market, in a three steps back pattern that is labelled Grand Super Cycle wave IV on monthly charts. Grand Super Cycle wave IV may be subdividing as an expanded flat pattern. The common range for Super Cycle wave (b) within a flat is from 1 to 1.38 times the length of Super cycle wave (a), giving a range from 1,920.18 to 2,252.27. The target would see Super Cycle wave (b) end within this most common range.
Super Cycle wave (b) within Grand Super Cycle wave IV may be an incomplete double zigzag. When Super Cycle wave (b) may be complete, then this wave count expects Super Cycle wave (c) to begin and to move price below the end of Super Cycle wave (a) at 1,046.27.
The first zigzag in the double is labelled cycle wave w. The double is joined by a three in the opposite direction, a combination labelled cycle wave x. The second zigzag in the double is labelled cycle wave y.
The purpose of the second zigzag in a double is to deepen the correction. Cycle wave y has achieved this purpose.
Primary wave C within cycle wave y may be subdividing as an impulse, which is the most common structure for C waves. Intermediate waves (1) through to (4) within primary wave C may be complete. If it continues any lower, then intermediate wave (4) may not move into intermediate wave (1) price territory below 1,764.12.
A best fit channel is drawn about primary wave C to contain as much of this movement as possible. Copy this channel over to daily charts.
We should always assume the trend remains the same until proven otherwise. At this stage, Gold is in a bull market.
DAILY CHART
Click chart to enlarge.
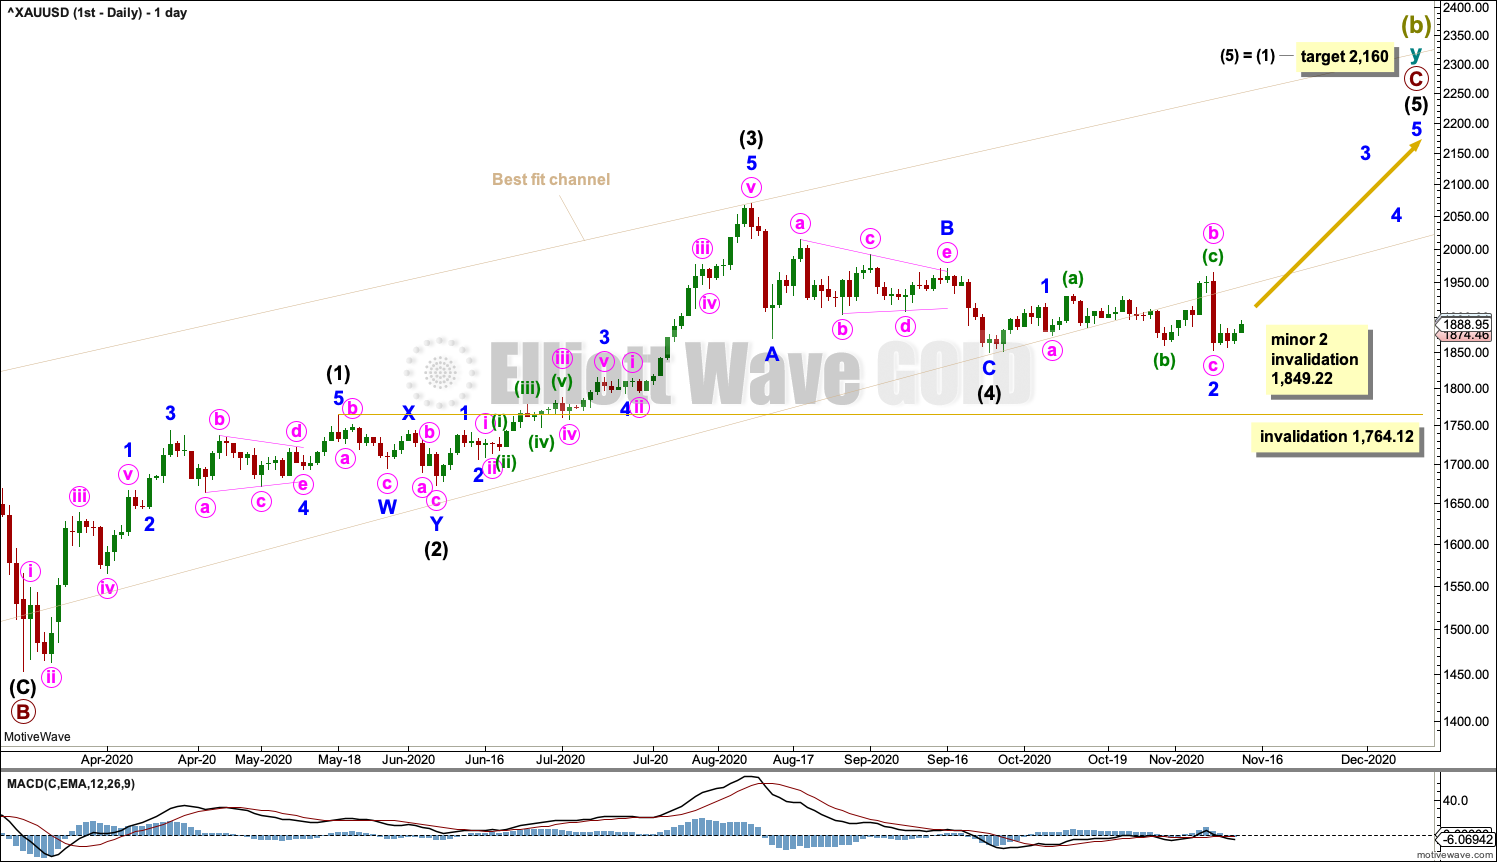
The daily chart shows detail of primary wave C as an incomplete impulse.
Intermediate waves (1) through to (4) within primary wave C may be complete. Intermediate wave (4) may be a complete zigzag.
The wide beige channel is copied over from the weekly chart. Price has now breached the channel. This channel breach favours the alternate wave count below.
If it continues lower, then intermediate wave (4) may not move into intermediate wave (1) price territory below 1,764.12.
If intermediate wave (4) is over as labelled, then within intermediate wave (5) minor wave 2 may not move beyond the start of minor wave1 below 1,849.22. For this reason, 1,849.22 remains an important confidence point for the alternate wave counts. A new low below 1,849.22 would see the main and alternate wave counts swapped over and possibly this wave count discarded.
A target is calculated for intermediate wave (5) that expects it to exhibit the most common Fibonacci ratio to intermediate wave (1).
Intermediate wave (5) must subdivide as a five wave motive structure at minor degree. So far minor wave 1 may be complete, and minor wave 2 may have completed as an expanded flat.
ALTERNATE DAILY CHART
Click chart to enlarge.
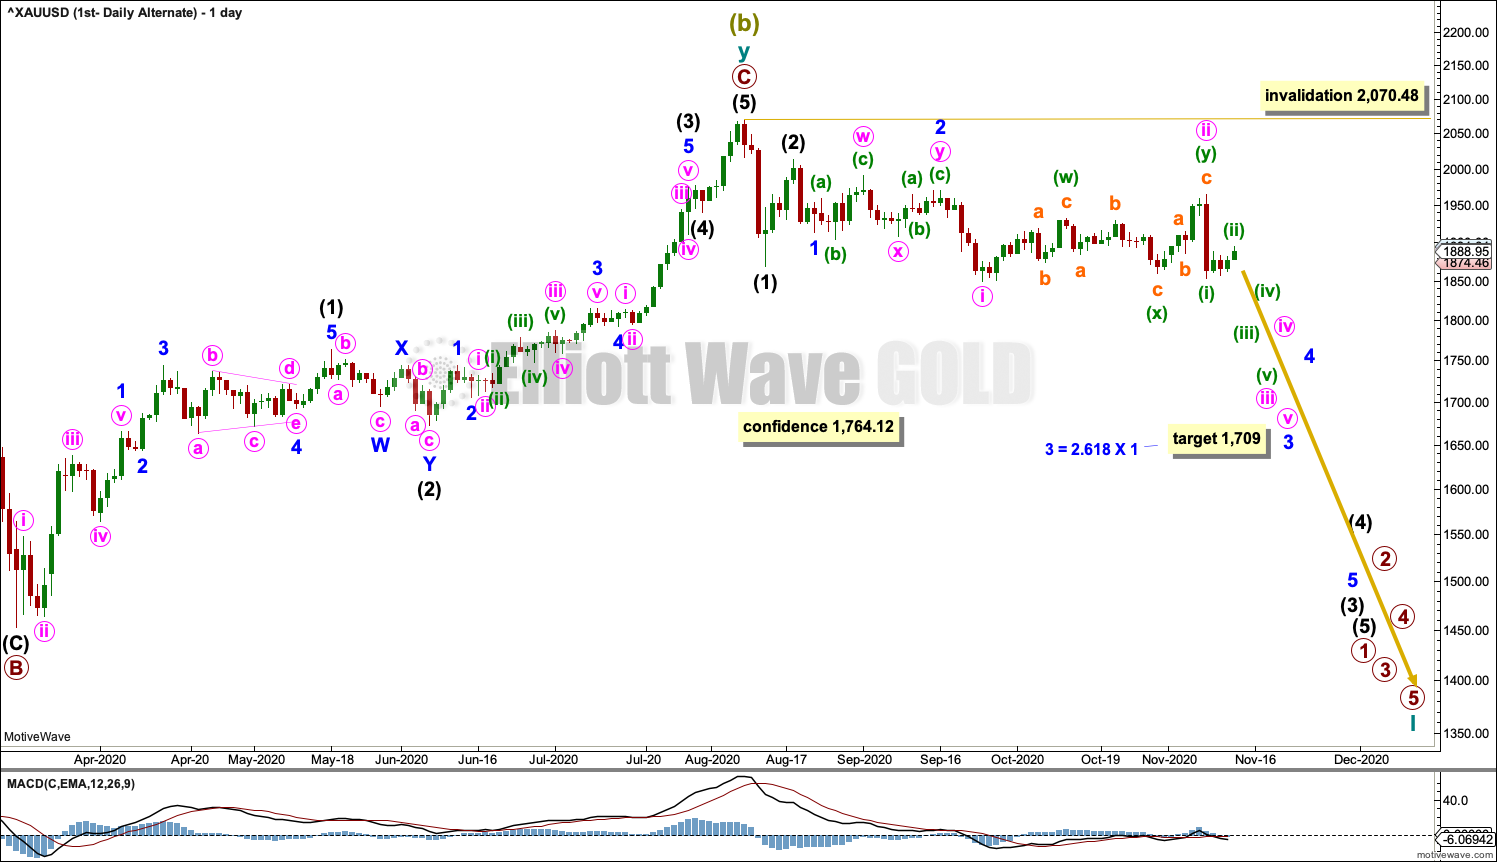
It is possible for this alternate wave count that a series of three first and second waves may be complete. A third wave down may now be developing strength.
Primary wave 2 within the new downwards trend may not move beyond the start of primary wave 1 above 2,070.48.
Minute wave ii may be a complete double zigzag.
Minute wave iii must move below the end of minute wave i at 1,849.22. It has not done this yet.
A new low below 1,849.22 would add initial confidence to this wave count. A new low below 1,764.12 would add reasonable confidence.
This wave count expects a further increase in downwards momentum. Either one or both of minuette wave (v) or minute wave v may end with a selling climax. Minuette wave (iv) and minute wave iv may be relatively brief and shallow.
SECOND ELLIOTT WAVE COUNT
WEEKLY CHART
Click chart to enlarge.
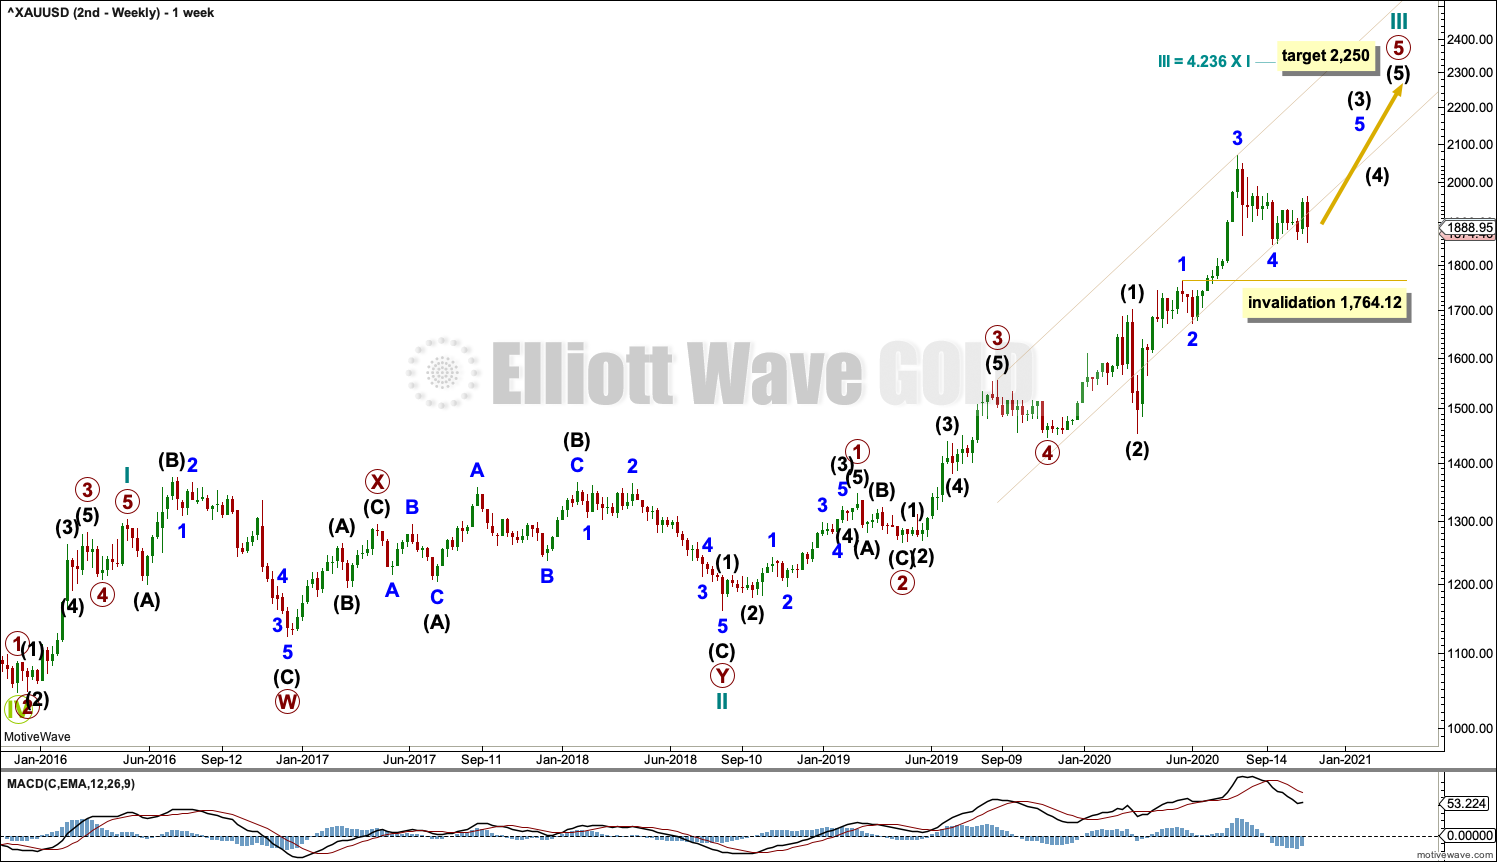
This wave count sees the the bear market complete at the last major low for Gold on 3 December 2015.
If Gold is in a new bull market, then it should begin with a five wave structure upwards on the weekly chart.
Cycle wave I fits as a five wave impulse with reasonably proportionate corrections for primary waves 2 and 4.
Cycle wave II fits as a double flat. However, within the first flat correction labelled primary wave W, this wave count needs to ignore what looks like an obvious triangle from July to September 2016 (this can be seen labelled as a triangle on the first wave count above). This movement must be labelled as a series of overlapping first and second waves. Ignoring this triangle reduces the probability of this wave count in Elliott wave terms.
Cycle wave III may be incomplete. Minor wave 4 within primary wave 5 may not move into minor wave 1 price territory below 1,764.12.
A best fit channel is drawn about cycle wave III in the same way as the channel as on the first wave count.
DAILY CHART
Click chart to enlarge.
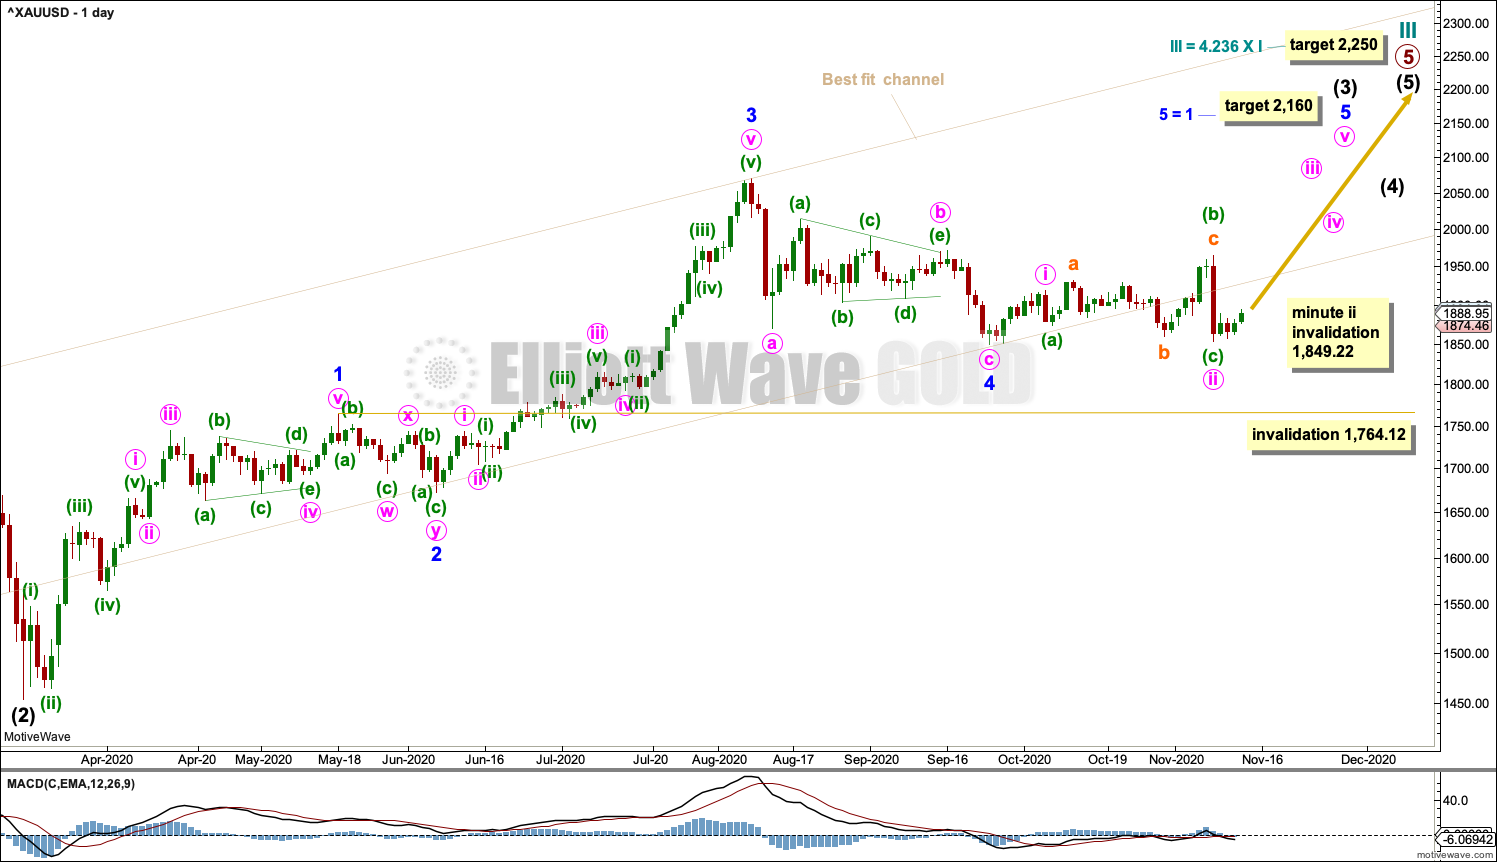
Cycle wave III may be incomplete. The daily chart focusses on primary wave 5 within cycle wave III.
Minor wave 4 may be a complete zigzag.
If minor wave 4 continues lower, then it may not move into minor wave 1 price territory below 1,764.12.
Minor wave 5 must subdivide as a five wave motive structure. Within minor wave 5: minute wave i may be complete and minute wave ii may be a complete expanded flat. If it continues lower, then minute wave ii may not move beyond the start of minute wave i below 1,849.22.
A new low below 1,849.22 would see the main and alternate wave counts swapped over.
ALTERNATE DAILY CHART
Click chart to enlarge.
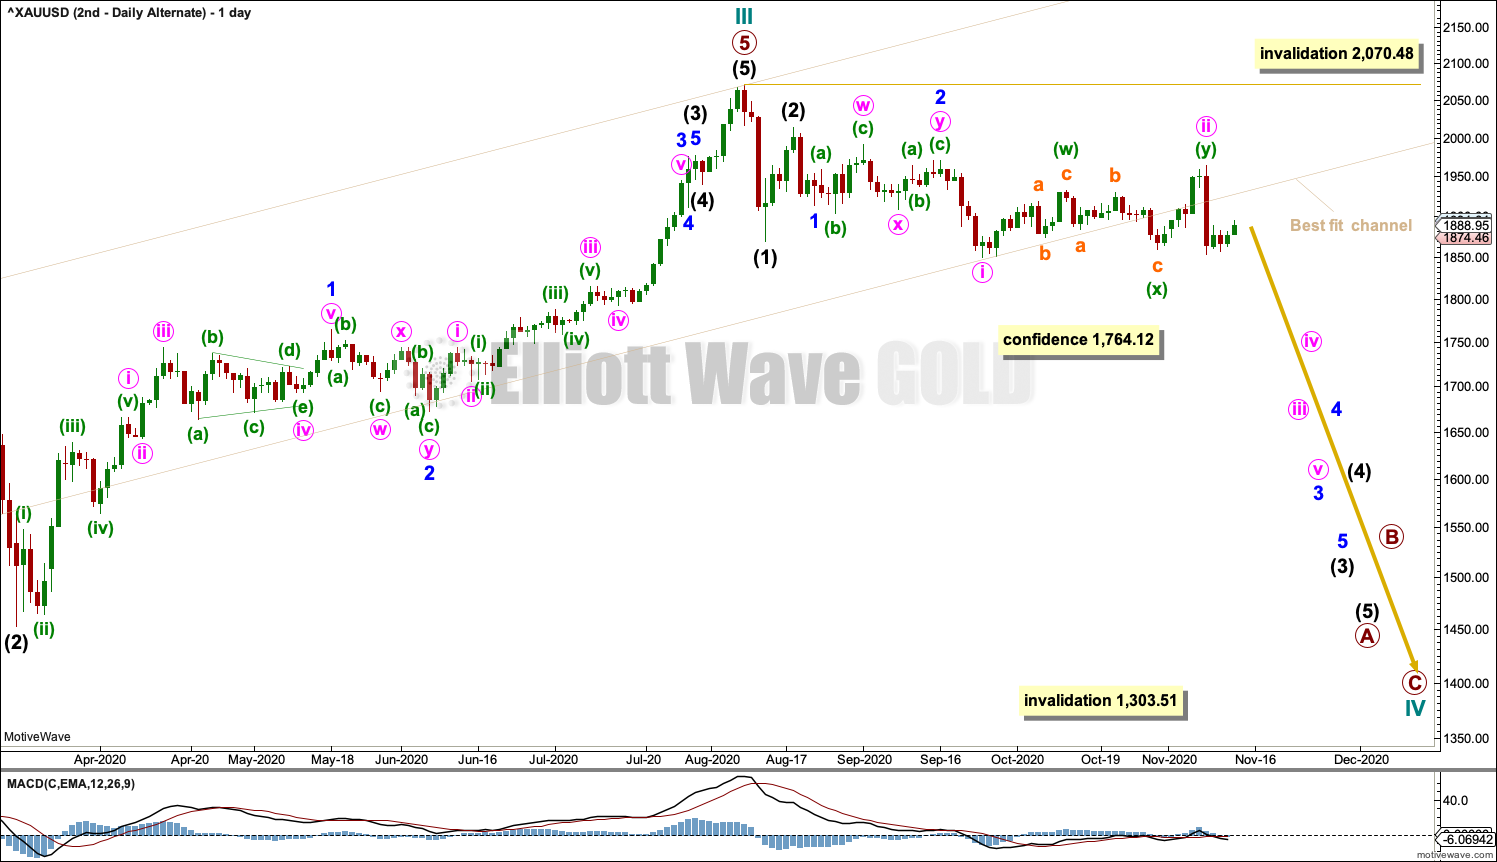
It is possible that cycle wave III is complete and cycle wave IV is in its very early stages. This alternate wave count sees the impulse upwards of primary wave 5 complete.
Cycle wave IV may subdivide as any one of more than 23 Elliott wave corrective structures. It would most likely subdivide as a zigzag. A new bearish trend at cycle degree should begin with a five wave structure downwards at the daily chart level; this would be incomplete. No second wave correction within this first five down may move beyond the start of its first wave above 2,070.48.
Targets for cycle wave IV at this stage may be calculated from Fibonacci ratios of cycle wave III. Cycle wave IV may end at either one of the 0.382 Fibonacci ratio at 1,722.96 or the 0.618 Fibonacci ratio at 1,508.27. Cycle wave IV may not move into cycle wave I price territory below 1,303.51 (this can be seen on the weekly chart).
TECHNICAL ANALYSIS
WEEKLY CHART
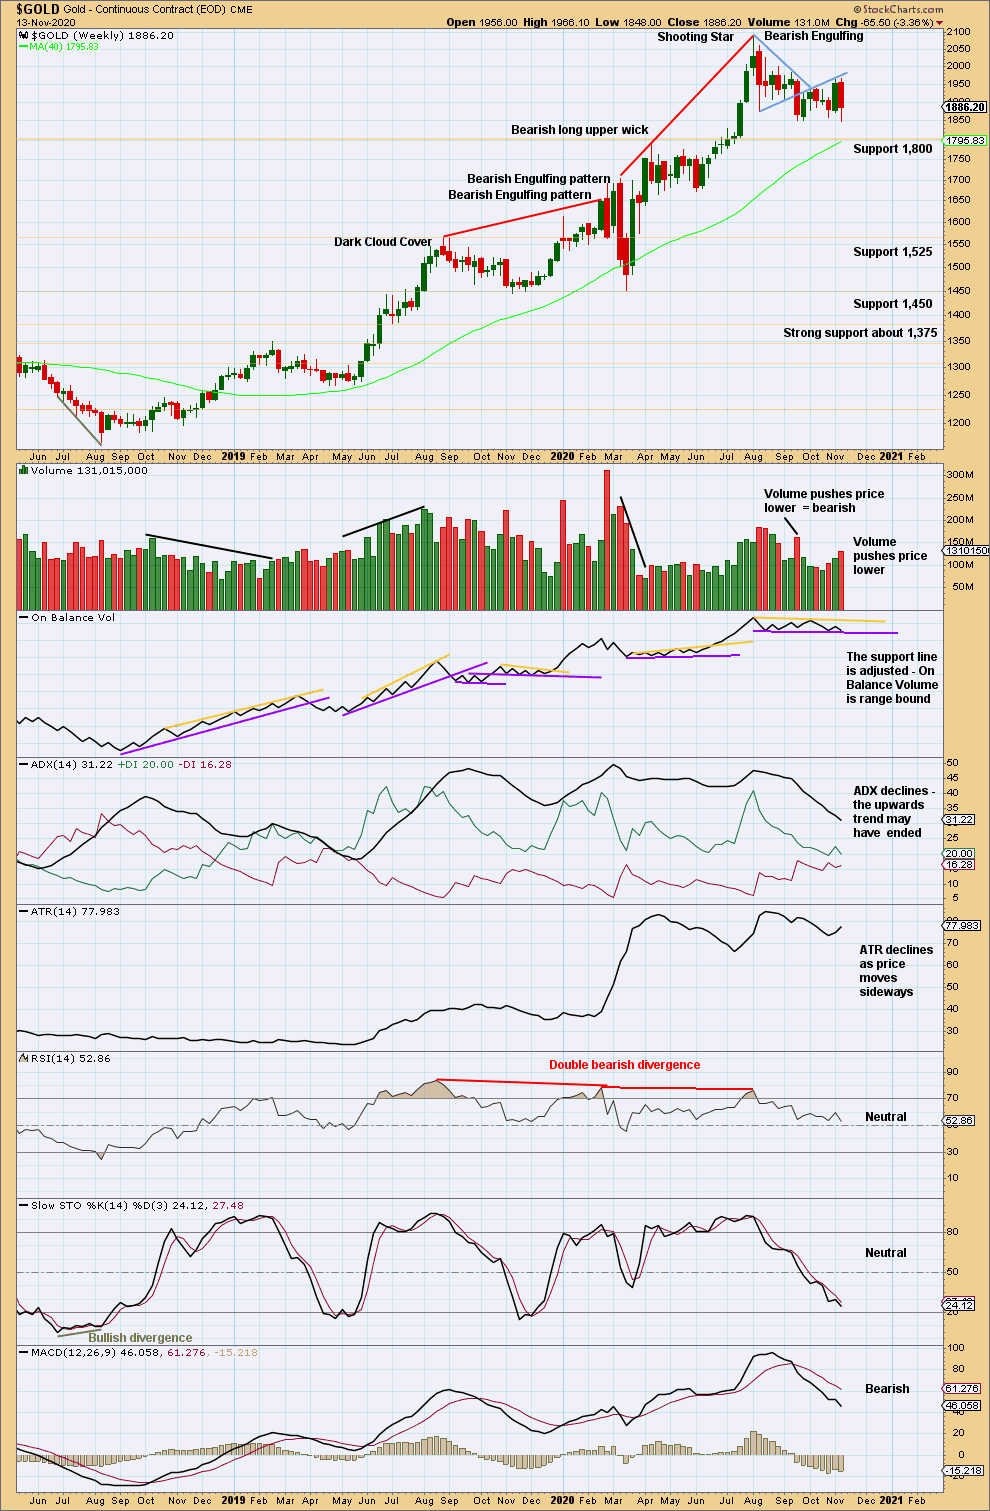
Click chart to enlarge. Chart courtesy of StockCharts.com.
At the last high were two bearish candlestick patterns with overbought RSI exhibiting double bearish divergence. It is possible there may have been a 180° trend change at the high. A new swing low below 1,671.70 would add confidence in that view.
Price and On Balance Volume are both range bound. A breakout is required for confidence in the next direction. Volume suggests it may more likely be downwards.
DAILY CHART
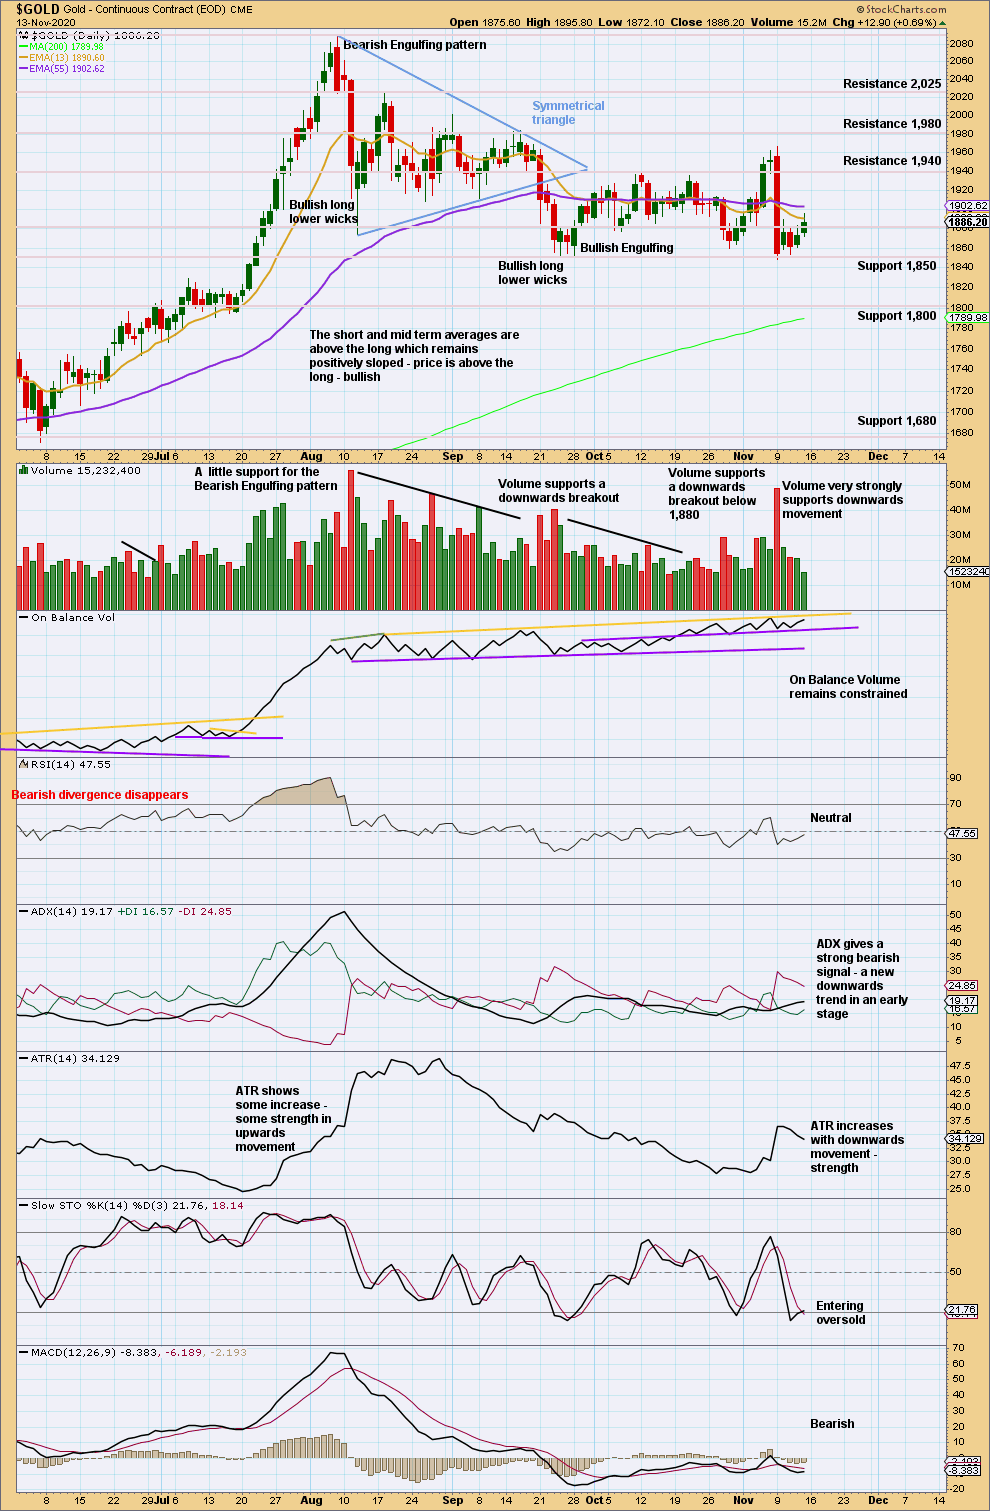
Click chart to enlarge. Chart courtesy of StockCharts.com.
An extremely strong downwards day has strong support from volume, increased ATR, a strong ADX bearish signal, and On Balance Volume turning down from resistance.
Price has not closed below support. A close below support is required for confidence that the consolidation is over and the next trend is underway.
GDX WEEKLY CHART
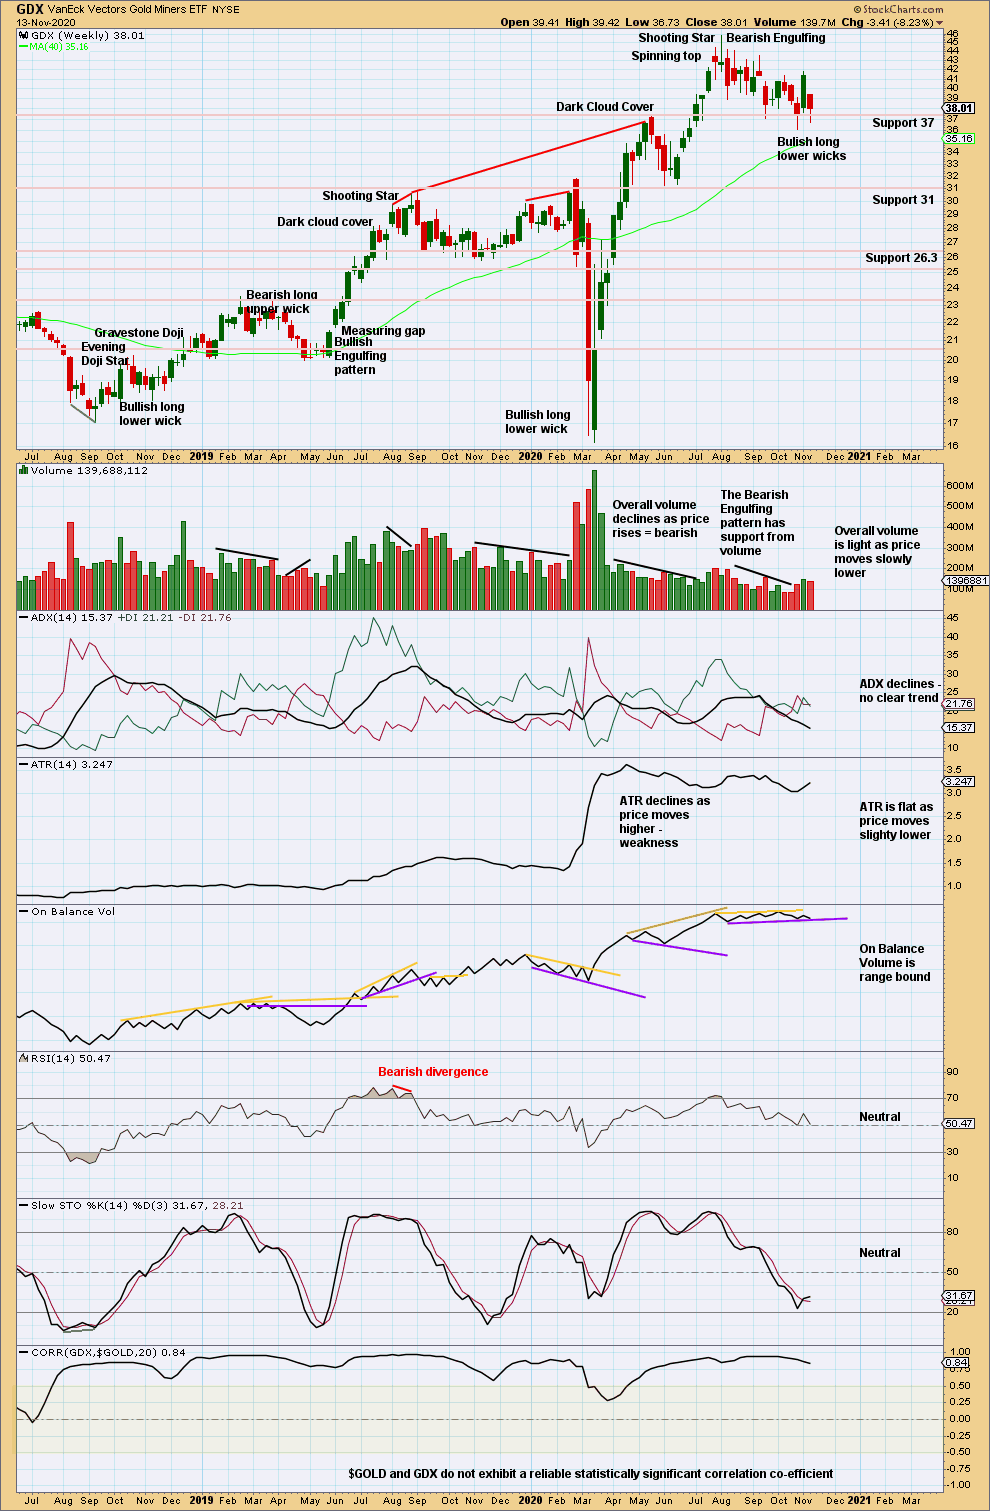
Click chart to enlarge. Chart courtesy of StockCharts.com.
The pullback may be over. An upwards trend may be ready to resume.
Price has not broken below support this week. Bullish lower wicks suggest upwards movement from here.
On Balance Volume is at support.
GDX DAILY CHART
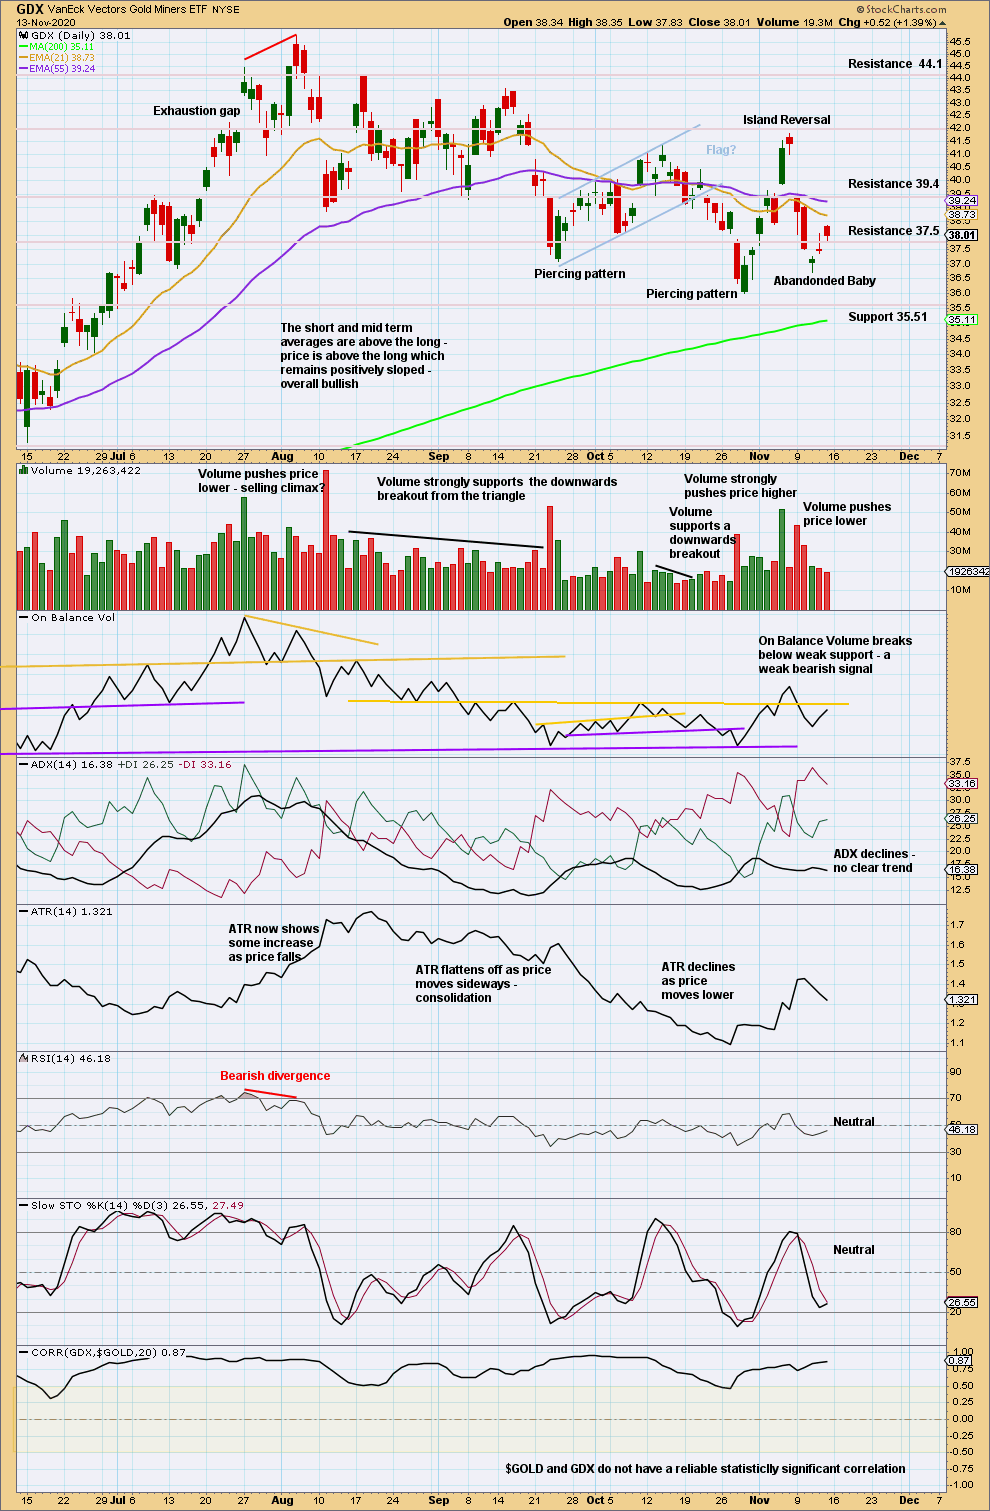
Click chart to enlarge. Chart courtesy of StockCharts.com.
An Abandoned Baby forms, but it is in the context of a wide ranging consolidation, so the strength of this bullish signal is weakened.
Price is swinging from resistance to support and back again, with resistance about 41.80 and support about 36. A breakout of this consolidation zone is required for confidence in the next trend.
A downwards swing may be close to ending. Price is near support. Stochastics is near oversold. An upwards swing to resistance may have begun.
US OIL
Upwards movement did not make a new swing high but did move beyond the invalidation point on daily charts.
The bigger picture remains the same.
Summary: Downwards movement may overall continue lower. In a downwards trend bounces may be opportunities.
A multi-week pullback is expected to end about 23.05. It is possible the pullback may be deeper than this though; the first major correction within a new trend for Oil tends to be very deep.
When this pullback may be complete, then an upwards trend should resume with increased strength.
Oil may have found a major sustainable low in April 2020.
ELLIOTT WAVE COUNT
MONTHLY CHART
Click chart to enlarge.
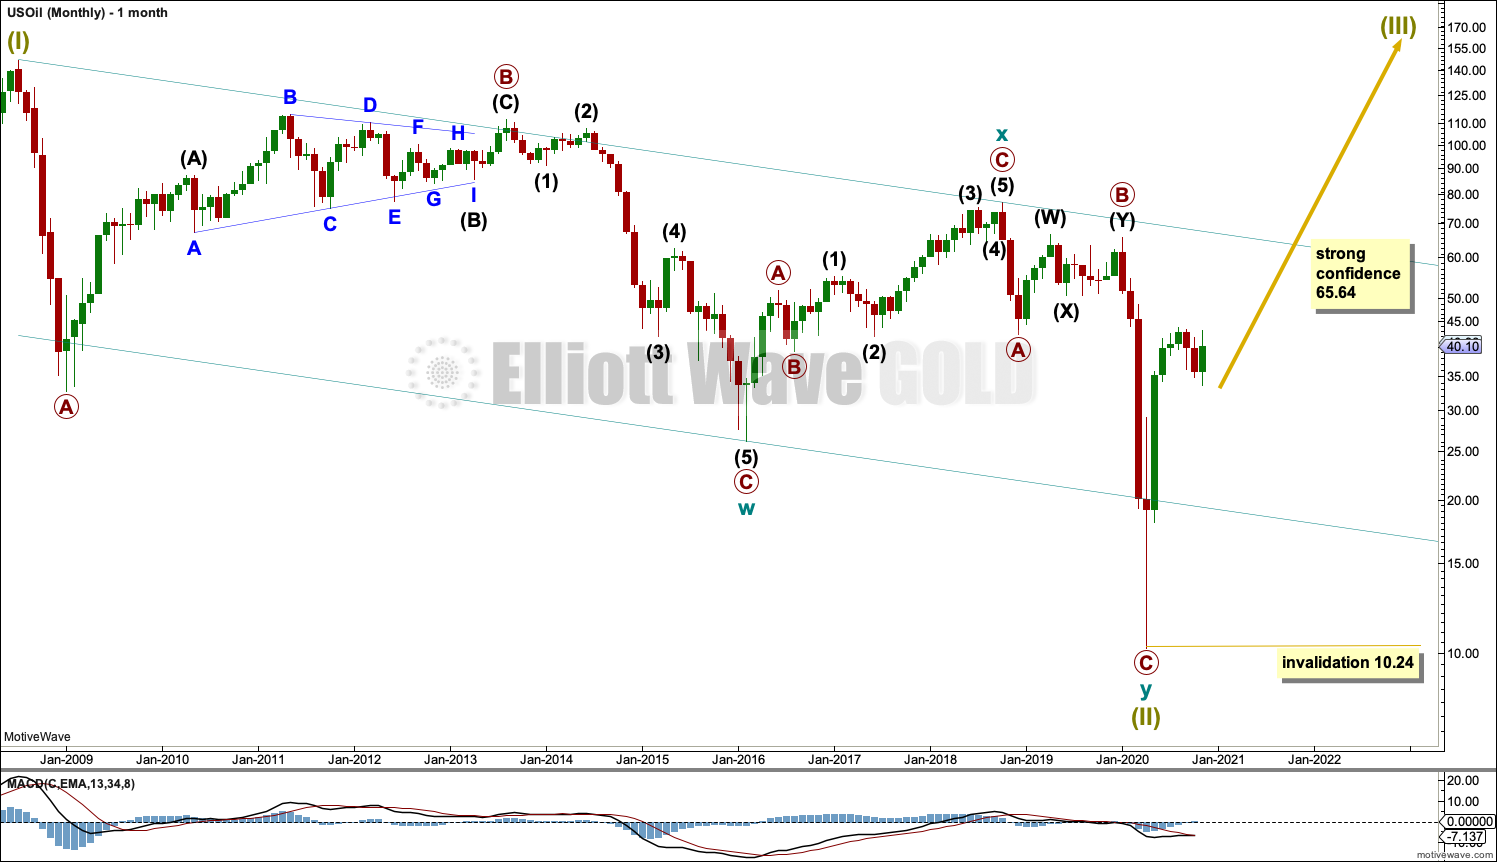
The basic Elliott wave structure is five steps forward and three steps back. This Elliott wave count expects that US Oil has completed a three steps back pattern, which began in July 2008. The Elliott wave count expects that the bear market for US Oil may now be over.
A channel is drawn about Super Cycle wave (II): draw the first trend line from the start of cycle wave w to the end of cycle wave x, then place a parallel copy on the end of cycle wave w. Price has bounced up off the channel. This trend line is breached, which is a typical look for the end of a movement for a commodity.
The upper edge of the channel may provide resistance.
Following five waves up and three steps back should be another five steps up; this is labelled Super Cycle wave (III), which may only have just begun. Super Cycle wave (III) may last a generation and must make a new high above the end of Super Cycle wave (I) at 146.73.
Super Cycle wave (III) may only subdivide as a five wave impulse. New trends for Oil usually start out very slowly with short first waves and deep time consuming second wave corrections. Basing action over a few years may now have begun.
WEEKLY CHART
Click chart to enlarge.
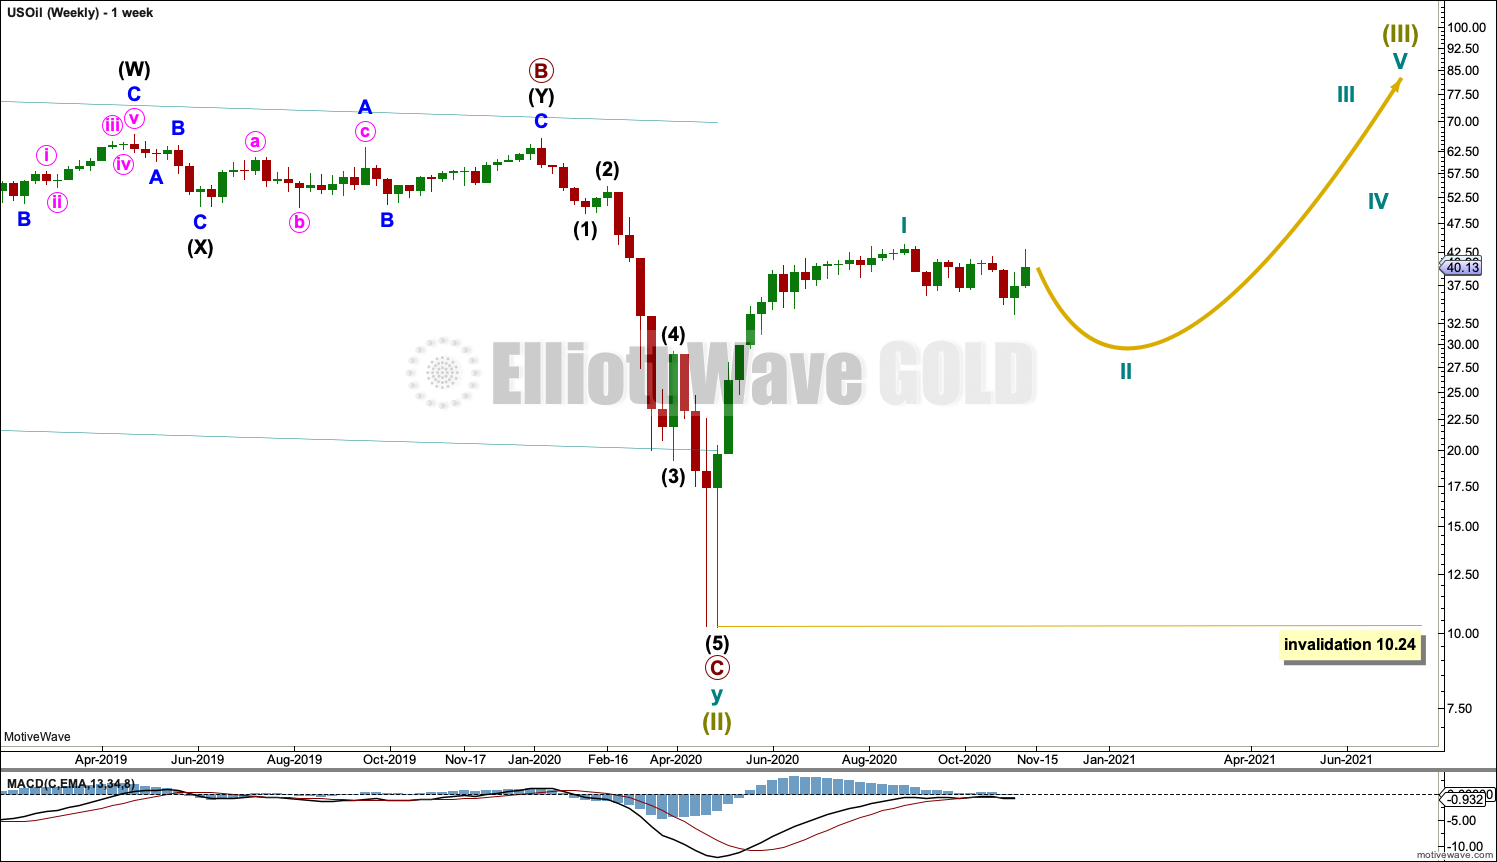
Super Cycle wave (III) must subdivide as an impulse. Cycle wave I within the impulse may be complete. Cycle wave II may not move beyond the start of cycle wave I below 10.24.
DAILY CHART
Click chart to enlarge.
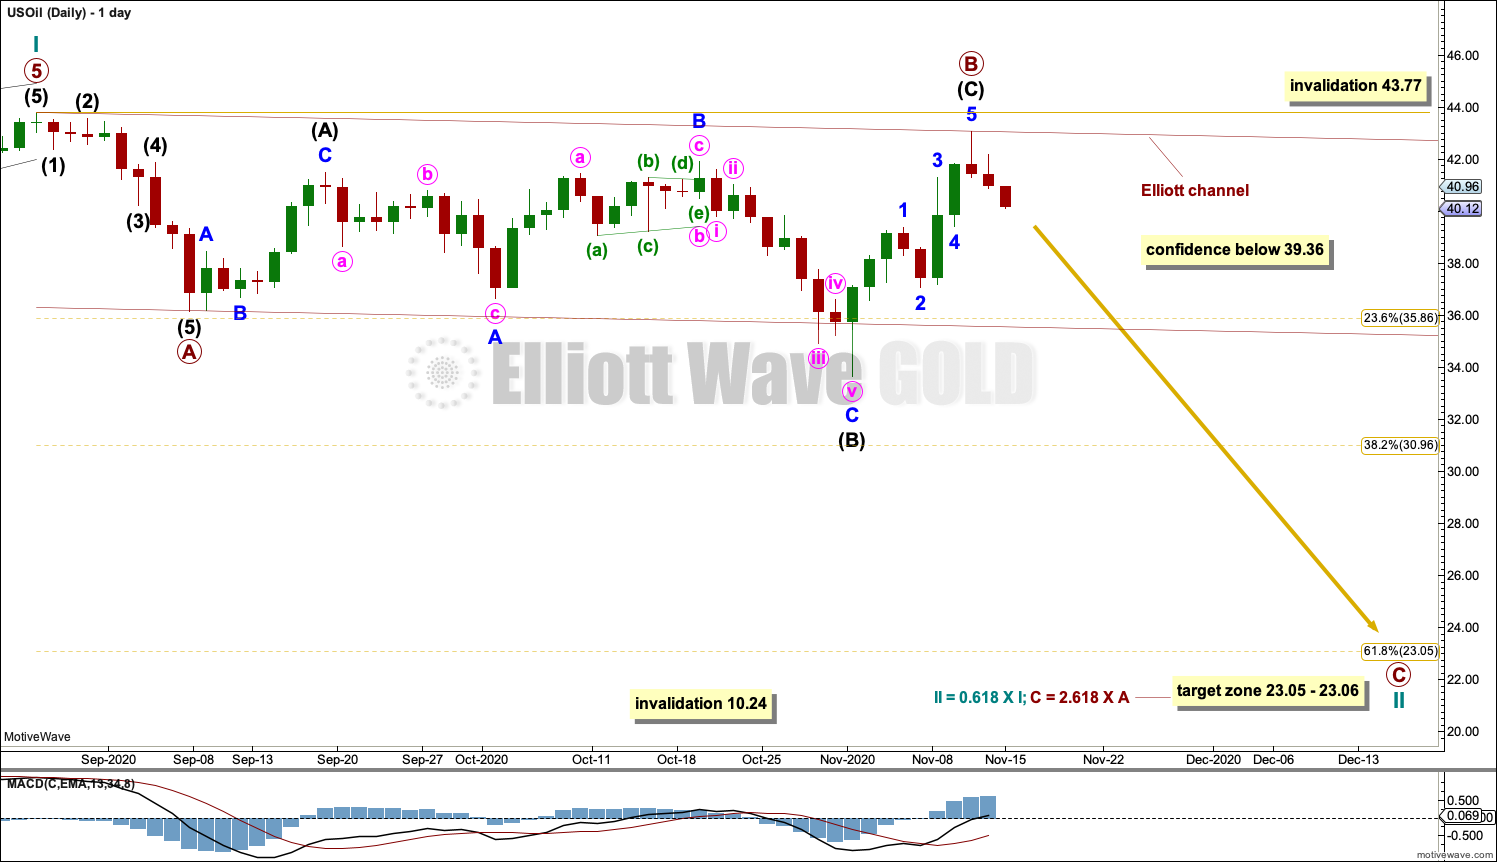
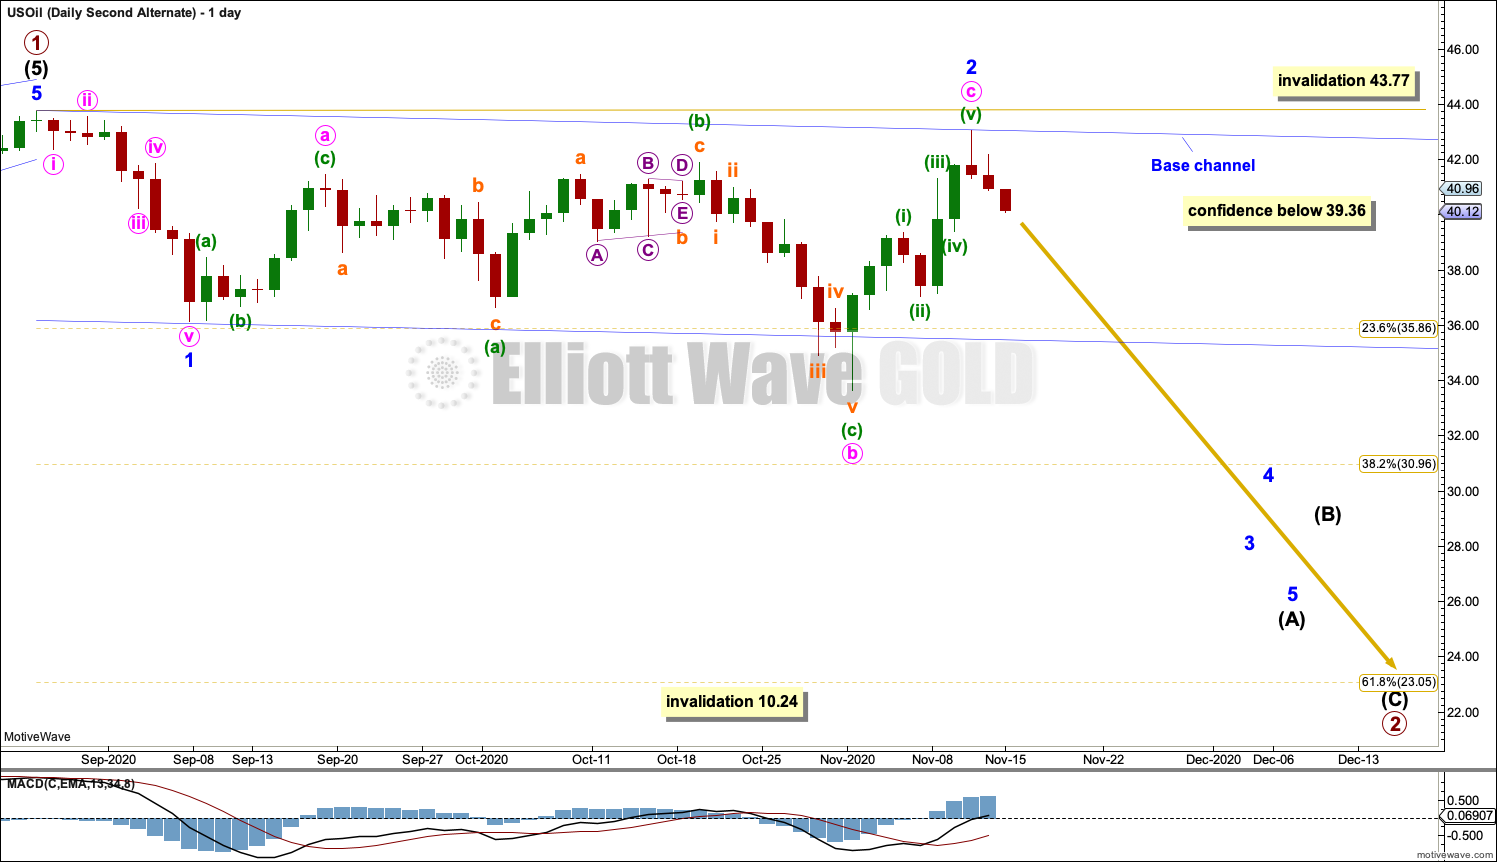
Cycle wave II may subdivide as any corrective Elliott wave structure except a triangle. At this stage, cycle wave II may be an incomplete zigzag that may end close to the 0.618 Fibonaccci ratio.
Primary wave B may have continued further this week as an expanded flat. Within the expanded flat: Intermediate wave (B) is a 1.46 length of intermediate wave (A), which is longer than the maximum common length of up to 1.38 but within an allowable guideline of up to 2, and intermediate wave (C) has moved above the end of intermediate wave (A), avoiding a truncation. Intermediate wave (C) is 0.75 longer than 1.618 times the length of intermediate wave (A).
Within intermediate wave (C): If the structure is not complete (as labelled), then minor wave 4 may not move into minor wave 1 price territory below 39.36. A new low below 39.36 could not be a fourth wave correction within intermediate wave (C), so at that stage intermediate wave (C) should be over. A new low now below 39.36 would for this reason add confidence that primary wave B is over and primary wave C is underway.
If primary wave B continues any higher, then it may mot move beyond the start of primary wave A above 43.77.
Primary wave C downwards may have just begun at this week’s high. Primary wave C must subdivide as a five wave motive structure.
Draw a channel about cycle wave II using Elliott’s technique for a correction: draw the first trend line from the start of primary wave A to the end of primary wave B, then place a parallel copy on the end of primary wave A. The upper edge may provide resistance for bounces along the way down. If price breaches the lower edge of this channel, then the first alternate wave count below may be preferred, although C waves may sometimes behave like third waves and breach channels.
Cycle wave II may not move beyond the start of cycle wave I below 10.24.
FIRST ALTERNATE DAILY CHART
Click chart to enlarge.
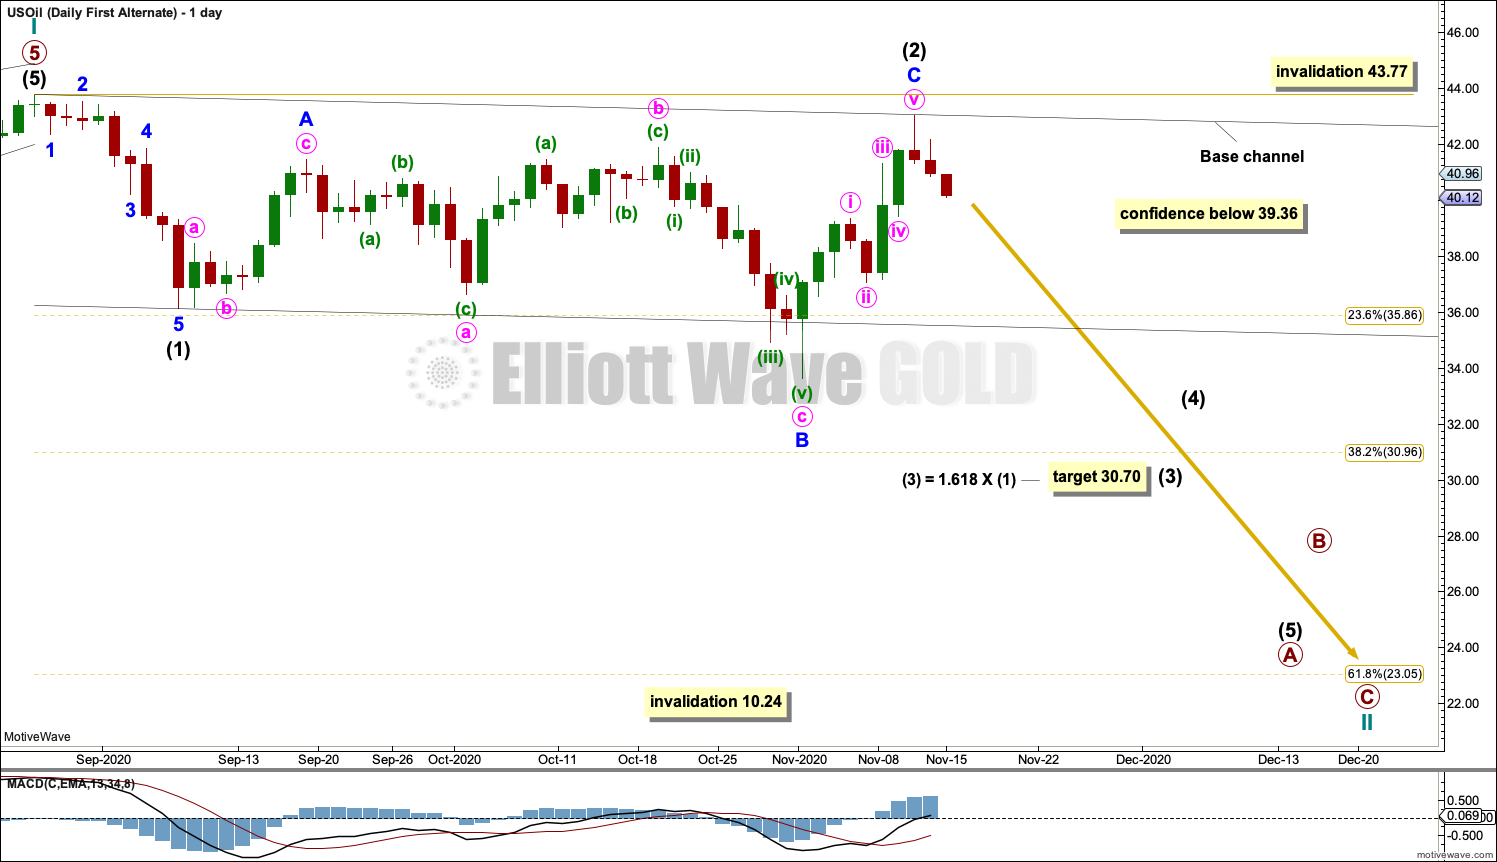
This first alternate wave count moves the degree of labelling within cycle wave II down one degree.
Cycle wave II may be subdividing as a zigzag. Primary wave A within cycle wave II may be an incomplete impulse.
Intermediate wave (2) may be a complete expanded flat.
Intermediate wave (3) within primary wave A may have begun at this week’s high. Intermediate wave (3) may only subdivide as an impulse. If it continues higher, then intermediate wave (2) may not move beyond the start of intermediate wave (1) above 43.77.
39.36 may be used in the same way as described for the main daily wave count.
A target is calculated for intermediate wave (3) that expects a common Fibonacci ratio to intermediate wave (1).
Draw a base channel about intermediate waves (1) and (2): draw the first trend line from the start of intermediate wave (1) to the end of intermediate wave (2), then place a parallel copy on the end of intermediate wave (1). The upper edge of the base channel may provide resistance for bounces along the way down. The lower edge of the base channel should be breached by the momentum of intermediate wave (3), and then it may provide resistance.
The 0.618 Fibonacci ratio of cycle wave I at 23.05 is a preferred target, but it is possible that cycle wave II may be deeper than this.
Although this wave count is named an alternate, it has about an even probability with the main wave count above.
SECOND ALTERNATE DAILY CHART
Click chart to enlarge.
It is also possible that the degree of labelling at the daily chart level may need to be changed back down one degree. It may be that only primary wave 1 is complete within cycle wave I and the current pullback may be primary wave 2.
Primary wave 2 may last several weeks to a few months.
TECHNICAL ANALYSIS
WEEKLY CHART
Click chart to enlarge. Chart courtesy of StockCharts.com.
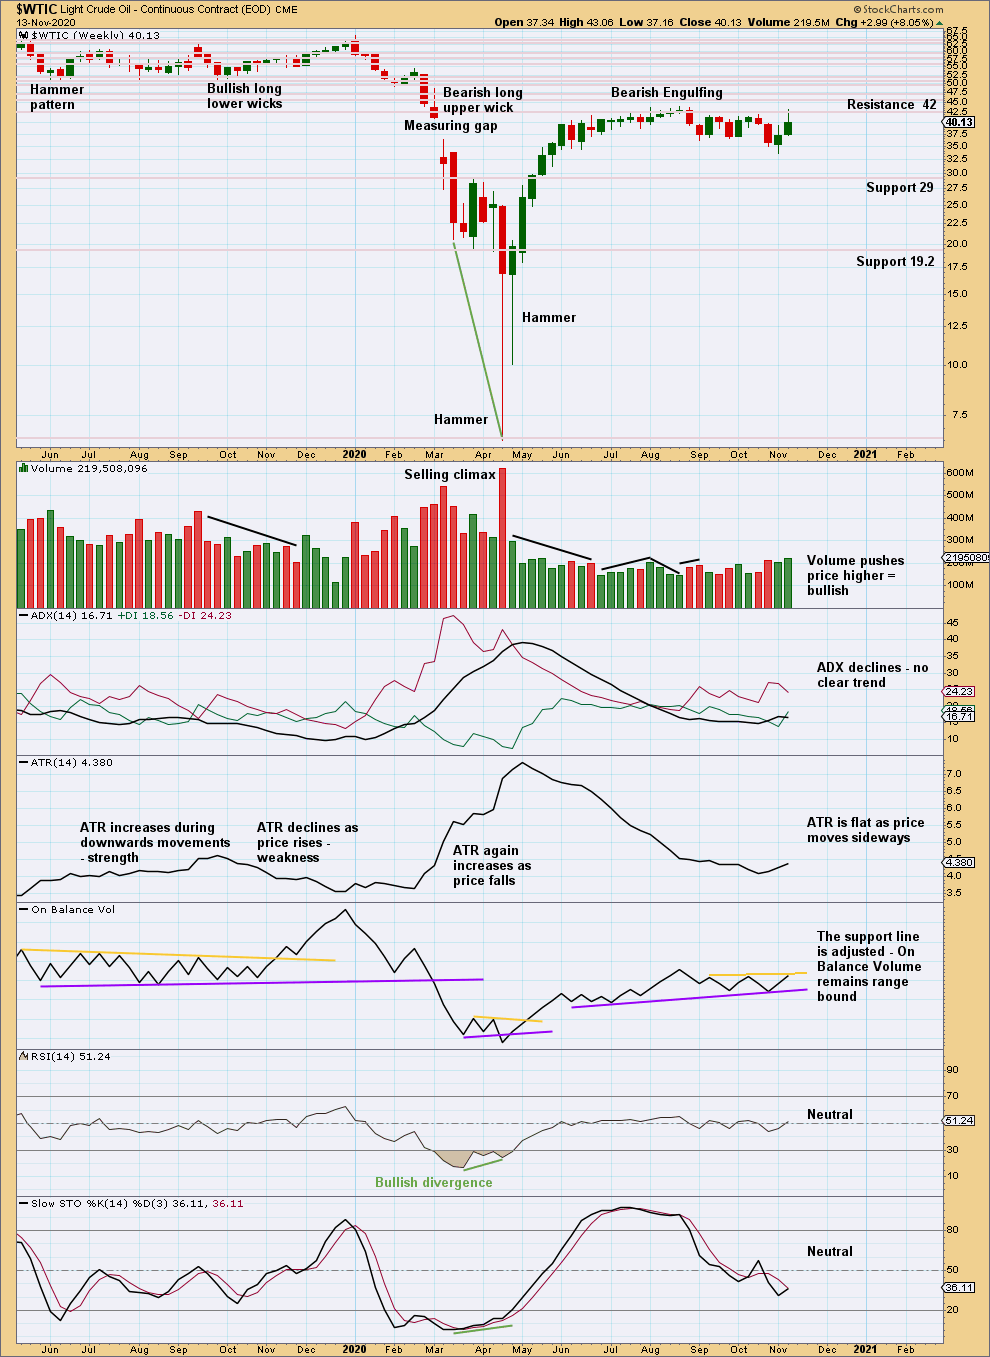
Price is back to within the prior consolidation zone.
On Balance Volume is also range bound.
The short-term volume profile is bullish. But the upper wick on this weekly candlestick is bearish, and price has reacted down from resistance, which remains intact.
DAILY CHART
Click chart to enlarge. Chart courtesy of StockCharts.com.
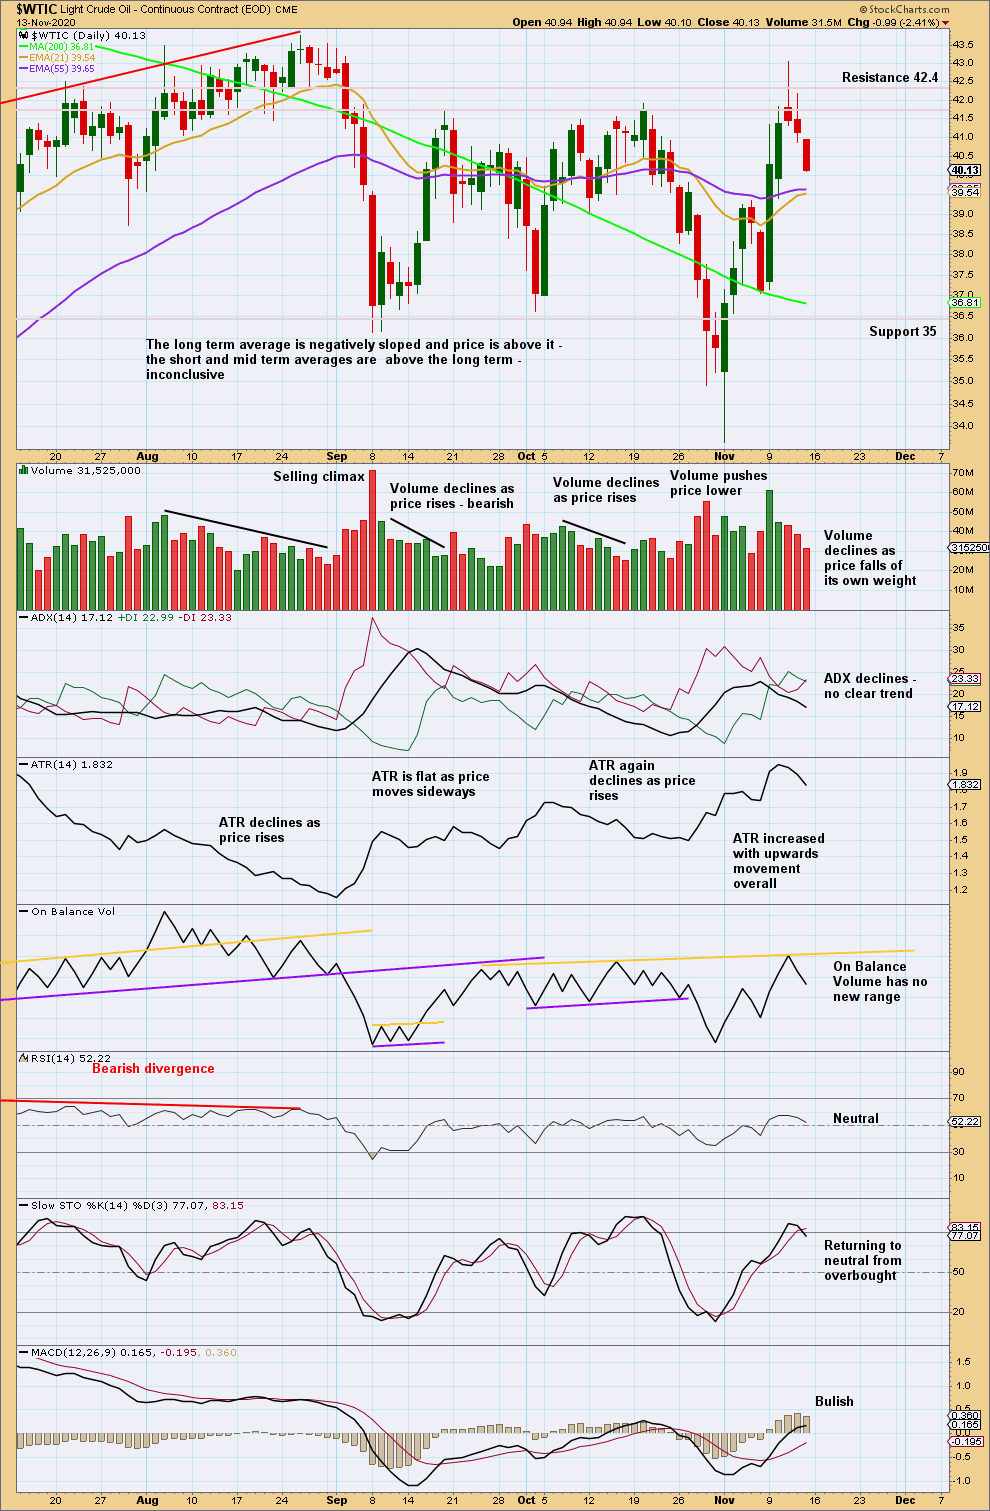
Price has been swinging from resistance to support and back again, with resistance about 41.6 – 42.4 and support about 35, with overshoots. An upwards swing may have just ended; price reached resistance, and Stochastics reached overbought. Now price is turning down. A downwards swing to support is a reasonable expectation here.
—
Always practice good risk management as the most important aspect of trading. Always trade with stops and invest only 1-5% of equity on any one trade. Failure to manage risk is the most common mistake new traders make.