
Lara’s Weekly: Elliott Wave and Technical Analysis of S&P500 and Gold and US Oil | Charts – November 27, 2020

S&P 500
A quiet end to the holiday week sees price move a little higher as the main Elliott wave count expected.
Summary: The wave count expects the low of the 30th of October to not be breached. A new mid-term target is at 3,785. The next target is at 4,606. The invalidation point is at 3,233.94.
The alternate is discarded.
The biggest picture, Grand Super Cycle analysis, is here.
Last monthly charts are here. Video is here.
ELLIOTT WAVE COUNT
WEEKLY CHART
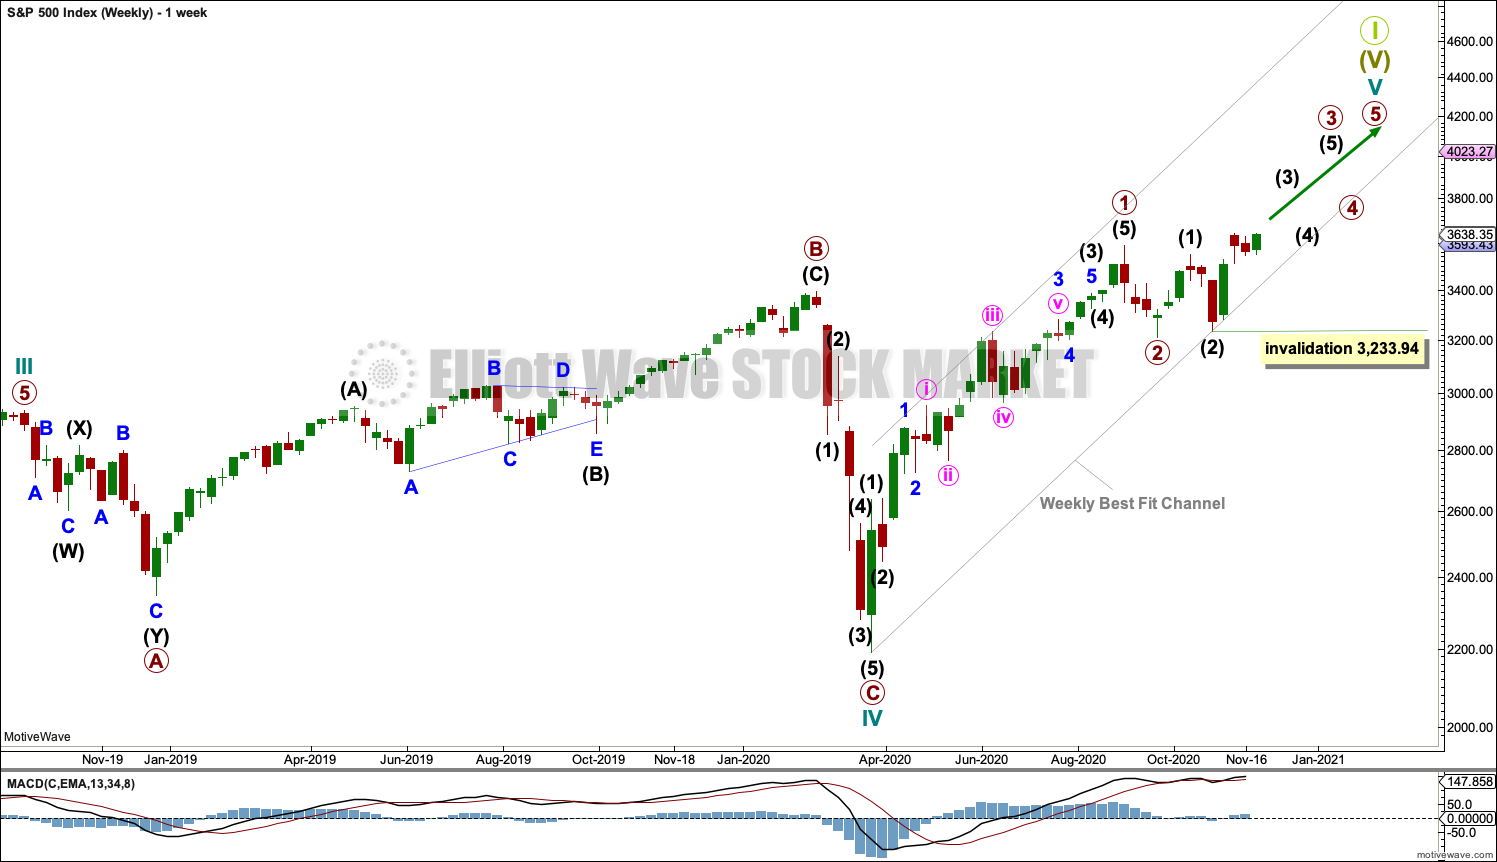
Click chart to enlarge.
Cycle wave V may last from one to several years. So far it is in its eighth month.
This wave count may allow time for the AD line to diverge from price as price makes final highs before the end of the bull market. The AD line most commonly diverges a minimum of 4 months prior to the end of a bull market.
Cycle wave V would most likely subdivide as an impulse. But if overlapping develops, then an ending diagonal should be considered. This chart considers the more common impulse.
Primary waves 1 and 2 may be complete.
Primary wave 3 may only subdivide as an impulse.
There is already a Fibonacci ratio between cycle waves I and III within Super Cycle wave (V). The S&P500 often exhibits a Fibonacci ratio between two of its actionary waves but rarely between all three; it is less likely that cycle wave V would exhibit a Fibonacci ratio. The target for Super Cycle wave (V) to end would best be calculated at primary degree, but that cannot be done until all of primary waves 1, 2, 3 and 4 are complete.
DAILY CHART
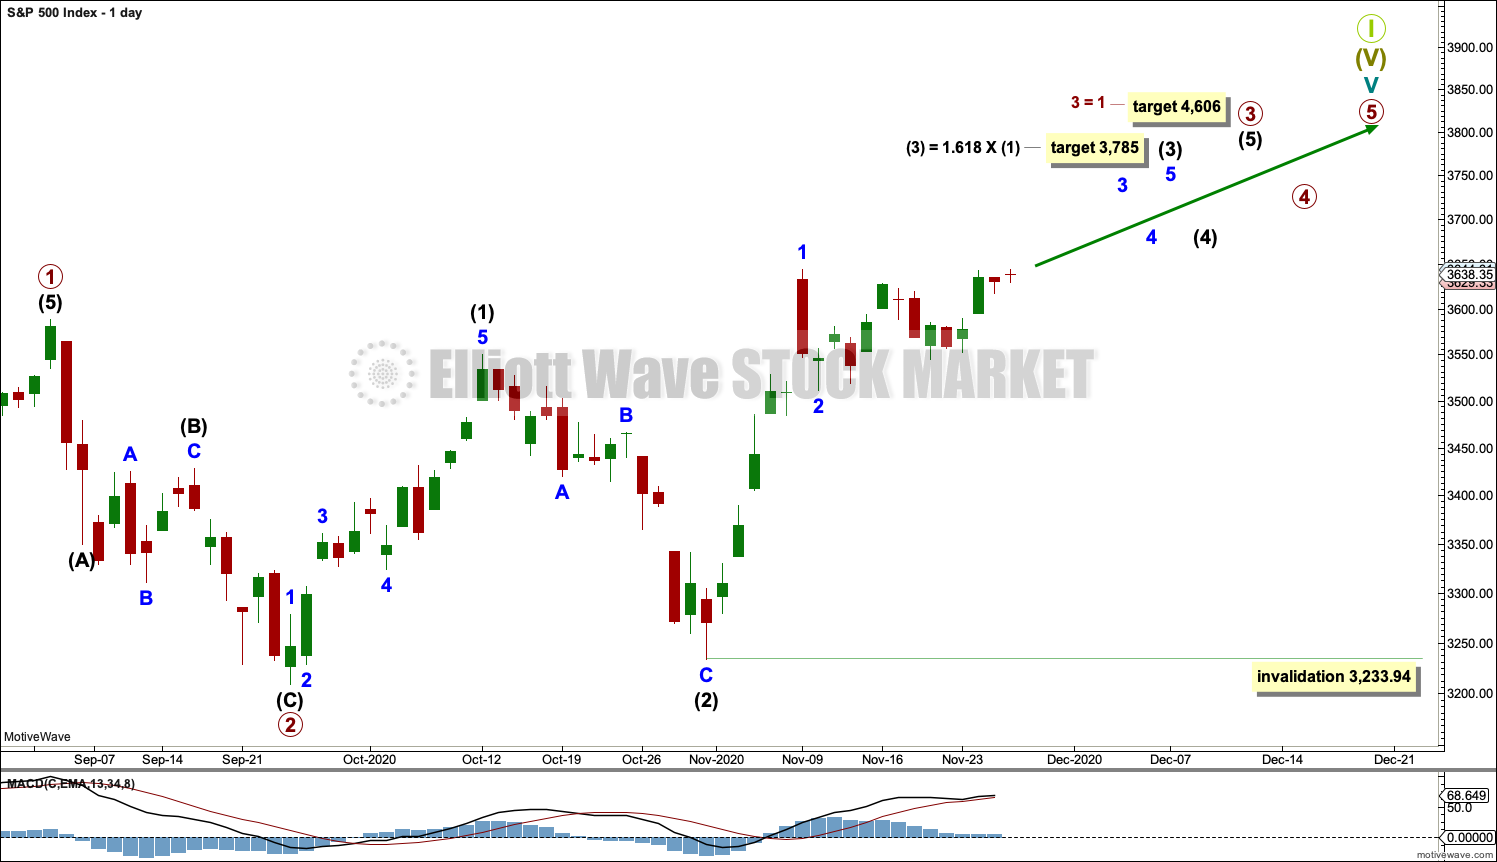
Click chart to enlarge.
Primary waves 1 and 2 may both be complete. Primary wave 3 may now be underway.
Primary wave 3 may only subdivide as an impulse. Within primary wave 3: Intermediate waves (1) and (2) may both be complete, and intermediate wave (3) may now be underway and may only subdivide as an impulse. A target is calculated for intermediate wave (3).
No second wave correction within intermediate wave (3) may move beyond the start of its first wave below 3,233.94.
Primary wave 1 looks extended. The target for primary wave 3 expects it to also be extended.
This wave count now expects that a third wave at three degrees (minor, intermediate and primary) has begun. An increase in upwards momentum is expected if this wave count is correct. Each third wave at minor, intermediate and primary degree must move above its corresponding first wave. Thereafter, each successive fourth wave must remain above its corresponding first wave price territory. What this means for trading is any positions entered within a first wave price territory may be held for a longer term throughout a fourth wave correction and then to capture profit from a fifth wave.
When third waves extend they do so in price as well as time. Extended waves usually exhibit corrections within them that are more time consuming than those within waves that are not extended.
TECHNICAL ANALYSIS
WEEKLY CHART
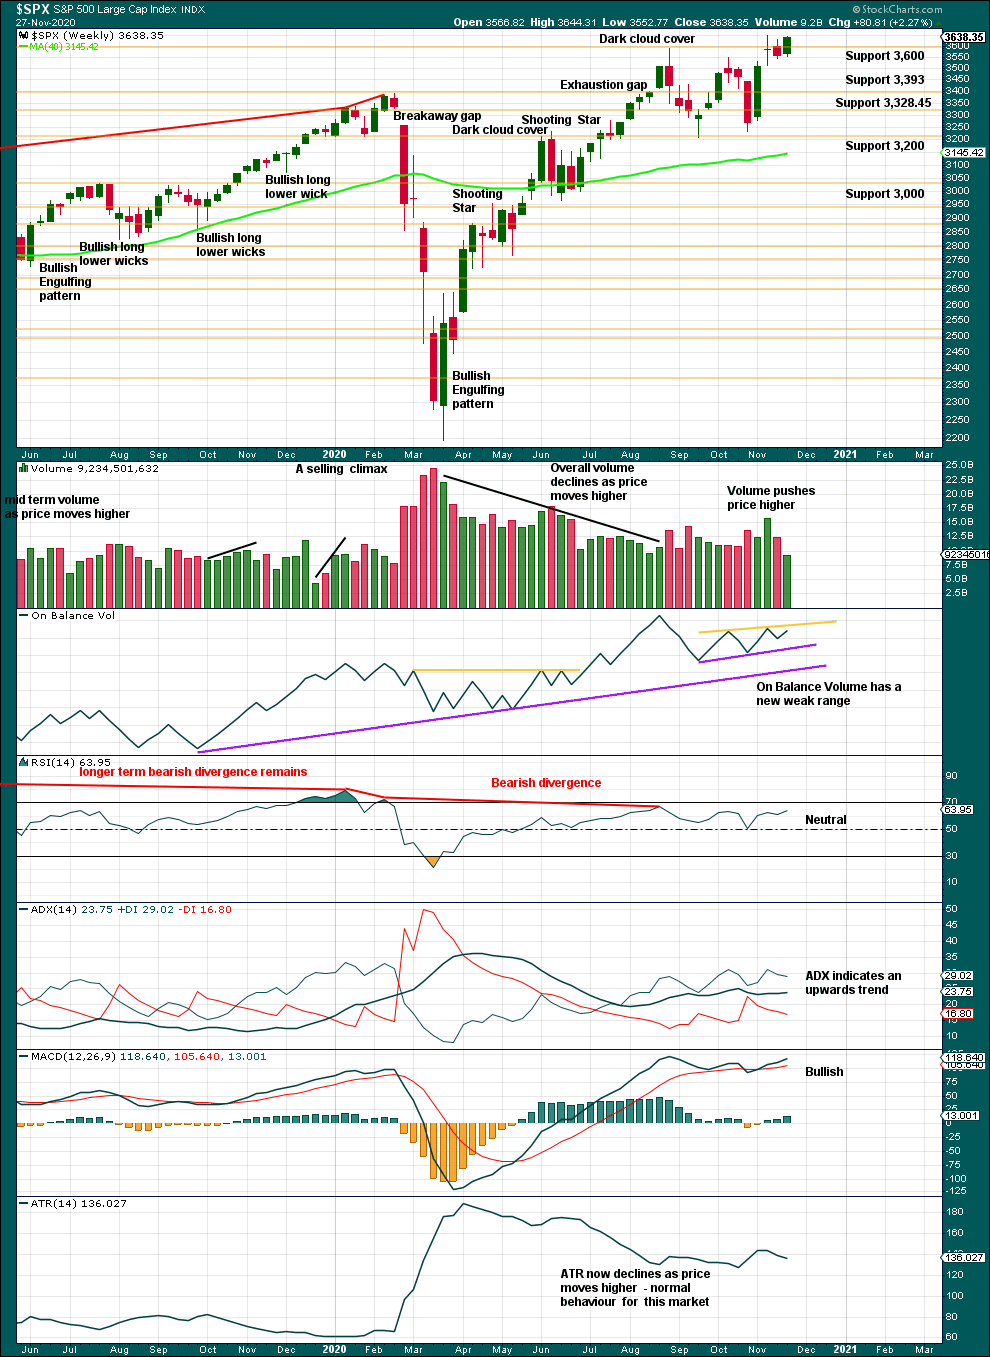
Click chart to enlarge. Chart courtesy of StockCharts.com.
This chart is bullish and supports the Elliott wave count. All of volume, On Balance Volume, ADX and MACD are bullish. There is no bearish candlestick reversal pattern. Conditions are not extreme. There is room for this upwards trend to continue.
DAILY CHART
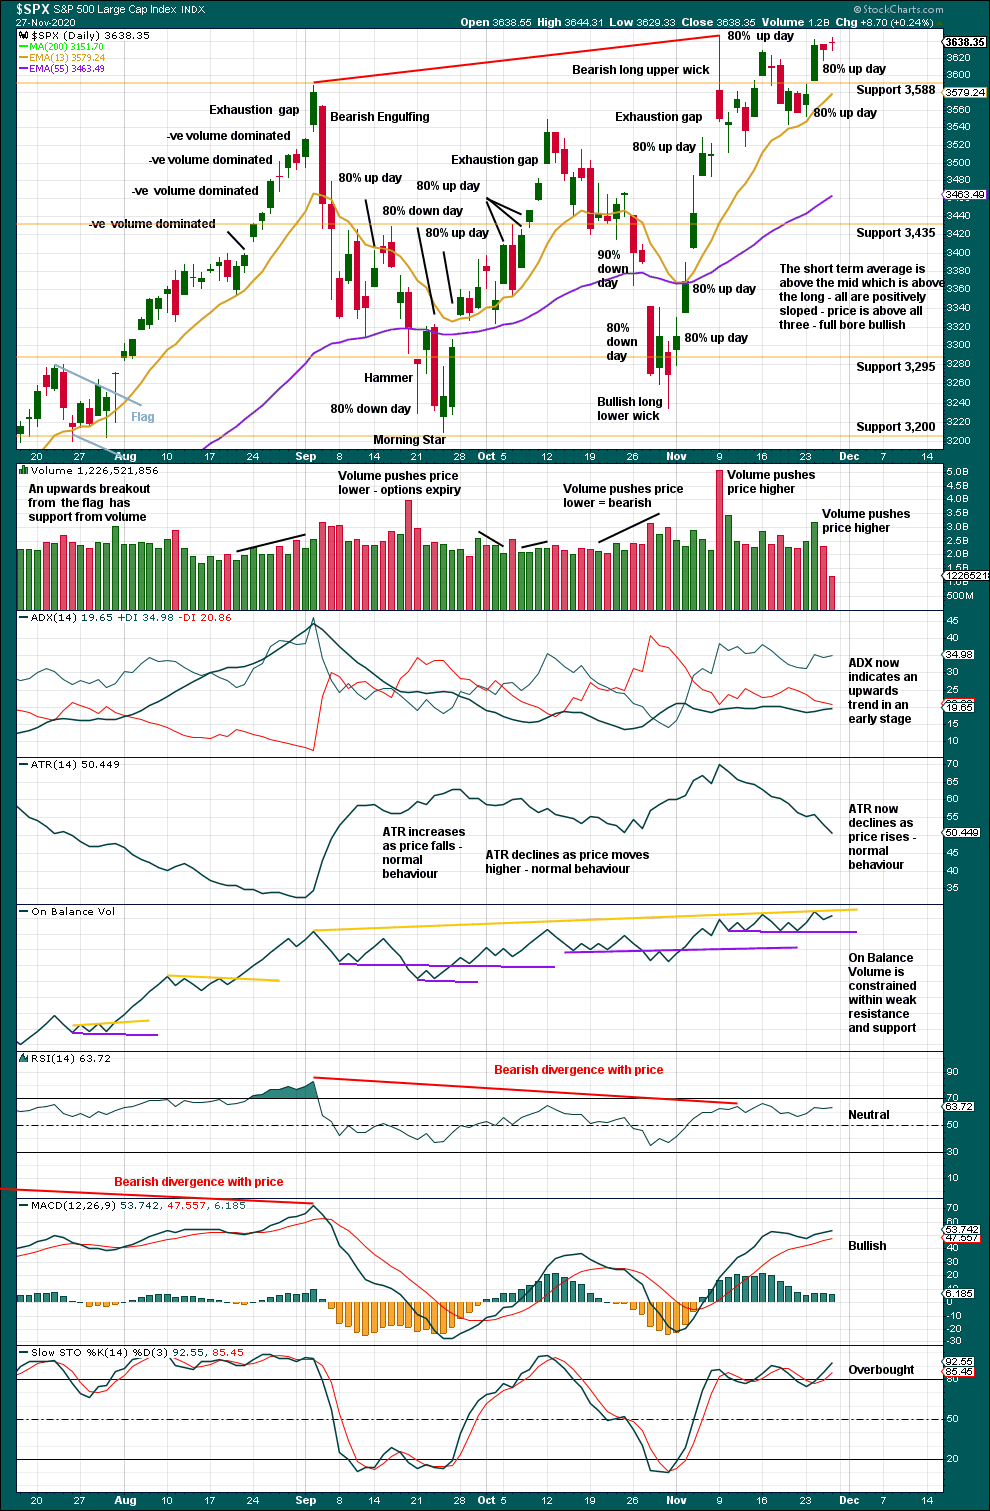
Click chart to enlarge. Chart courtesy of StockCharts.com.
There is an upwards trend. When this market trends, then Stochastics may remain overbought for extended periods of time while price moves a considerable distance.
Overall, this chart is bullish and still supports the Elliott wave count. There is a series of higher highs and lower lows from the low on the 24th of September.
Two back to back 80% up days support the main Elliott wave count.
Neither ADX nor RSI are yet extreme. There is room for this upwards trend to continue.
BREADTH – AD LINE
WEEKLY CHART
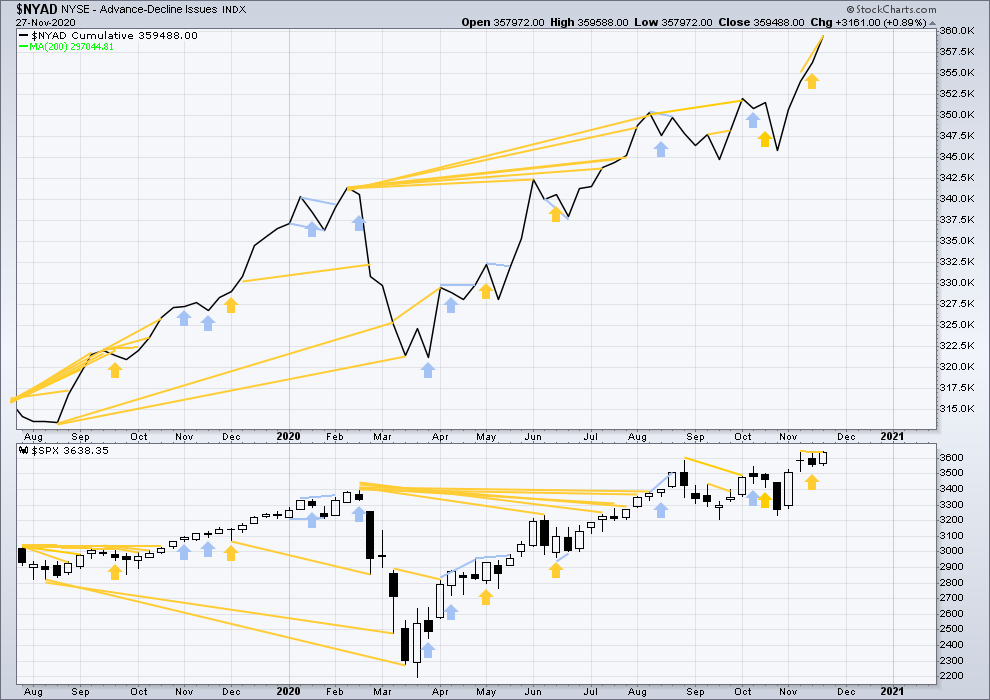
Click chart to enlarge. Chart courtesy of StockCharts.com. So that colour blind members are included, bearish signals will be noted with blue and bullish signals with yellow.
Breadth should be read as a leading indicator.
Lowry’s Operating Companies Only AD line has made a new all time high on the 24th of November. This is a strong bullish signal and supports the main Elliott wave count.
Large caps all time high: 3,645.99 on November 9, 2020.
Mid caps all time high: 2,223.52 on November 24, 2020.
Small caps all time high: 1,100.58 on August 27, 2018.
It is now mid and small cap stocks that are leading the current rise in the last two weeks. This is a feature of an early phase of a new bull market, so it is a very bullish signal.
This week the AD line has made a new all time high, but price has not. This divergence is a strong bullish signal that supports the Elliott wave count.
DAILY CHART
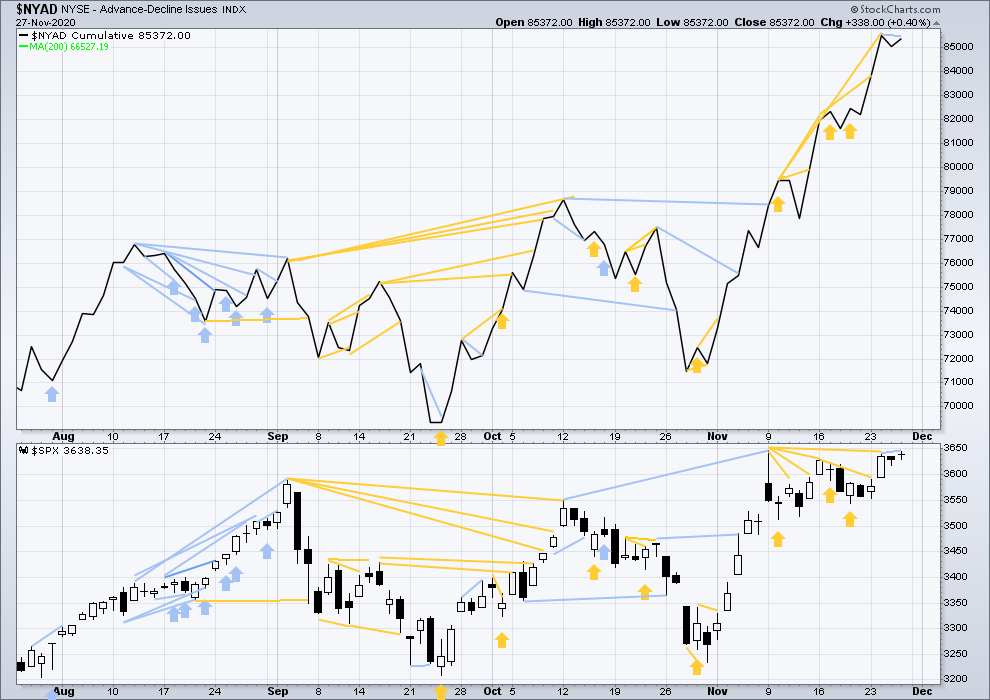
Click chart to enlarge. Chart courtesy of StockCharts.com. So that colour blind members are included, bearish signals will be noted with blue and bullish signals with yellow.
On Friday price made a new short-term high, but the AD line did not. This divergence is very short term, and it is weak.
VOLATILITY – INVERTED VIX CHART
WEEKLY CHART
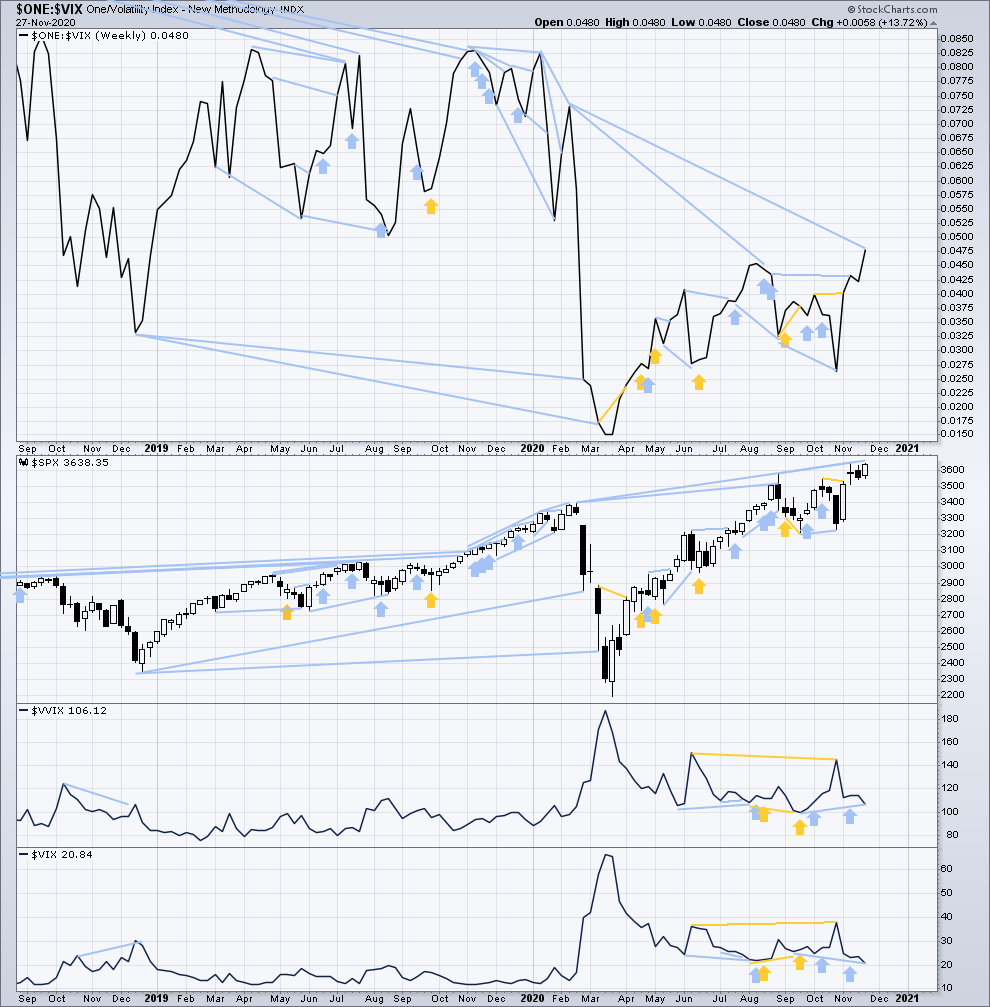
Click chart to enlarge. Chart courtesy of StockCharts.com. So that colour blind members are included, bearish signals will be noted with blue and bullish signals with yellow.
Inverted VIX remains well below all time highs. The all time high for inverted VIX was in the week beginning October 30, 2017. There is over 3 years of bearish divergence between price and inverted VIX. There is all of long, mid and short-term bearish divergence. This bearish divergence may develop further before the bull market ends. It may be a very early indicator of an upcoming bear market, but it is not proving to be useful in timing.
This week price and inverted VIX have both moved higher. There is no new short-term divergence.
Comparing VIX and VVIX: This week both VIX and VVIX have moved lower. VIX has made a new swing low below the low of the week beginning 21st of September, but VVIX has not. VVIX remains slightly elevated. This divergence is bearish for price as a volatility of VIX is normally associated with bearish movements in price.
DAILY CHART
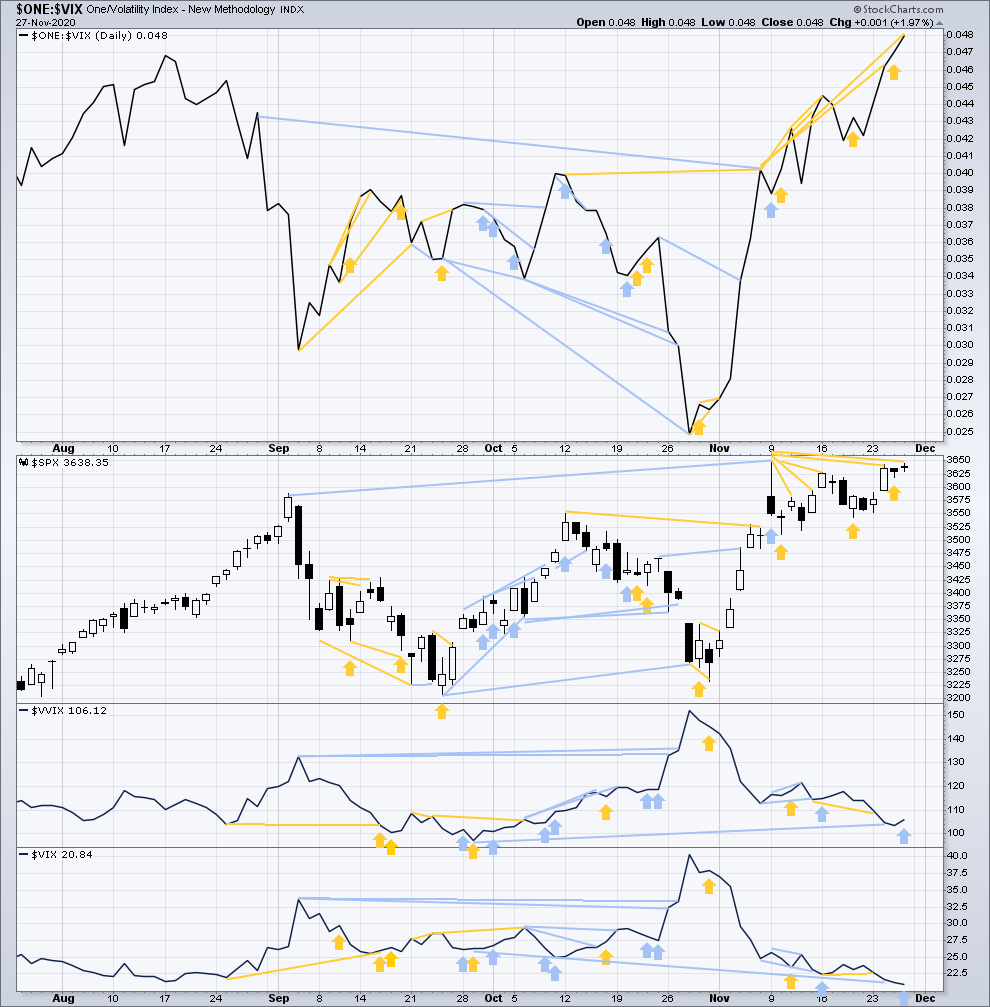
Click chart to enlarge. Chart courtesy of StockCharts.com. So that colour blind members are included, bearish signals will be noted with blue and bullish signals with yellow.
On Friday inverted VIX has made a new short-term swing high, but price has not. This divergence is bullish for price and adds to a cluster of short-term bullish divergence.
Comparing VIX and VVIX at the daily chart level: On Friday VIX has moved lower while price has moved higher, a normal relationship between the two. However, VVIX has moved higher. With volatility of VIX increasing on Friday, this is bearish for price for the very short term.
DOW THEORY
Dow Theory confirms a new bull market with new highs made on a closing basis:
DJIA: 29,568.57 – closed above on 16th November 2020.
DJT: 11,623.58 – closed above on 7th October 2020.
Adding in the S&P and Nasdaq for an extended Dow Theory, confirmation of a bull market would require new highs made on a closing basis:
S&P500: 3,393.52 – closed above on 21st August 2020.
Nasdaq: 9,838.37 – closed above on June 8, 2020.
GOLD
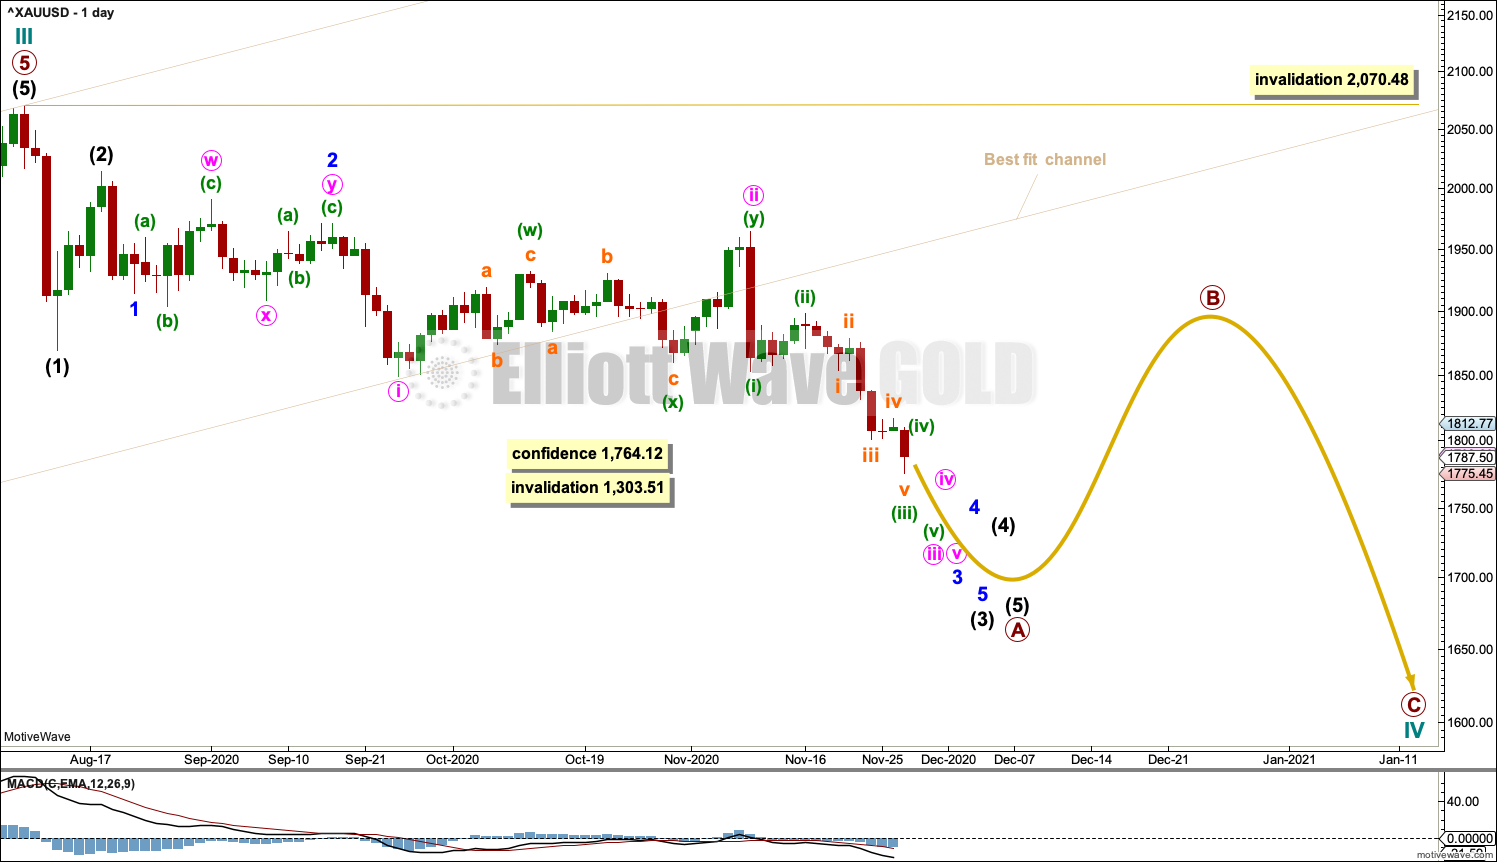
The main Elliott wave counts expected price to continue lower, which is exactly what is happening. The alternate Elliott wave count has a diminishing probability; the invalidation point for it is now very close.
Summary: The first wave count is bearish for the bigger picture, and it has a main and an alternate daily chart. The main daily chart expects a multi-year bear market may be in its early stages to end below 1,046. Short-term targets are at 1,772 then 1,767 and then at 1,709. A long term target is at 657. The alternate daily chart has a low probability and would be invalidated below 1,764.12.
The second wave count is bullish for the bigger picture. It expects a multi-month to multi-year pullback or consolidation (within a larger bull market) may be in its early stages to possibly end about either 1,722.96 or 1,508.27.
Grand SuperCycle analysis is here.
Last analysis of monthly charts is here.
FIRST ELLIOTT WAVE COUNT
WEEKLY CHART
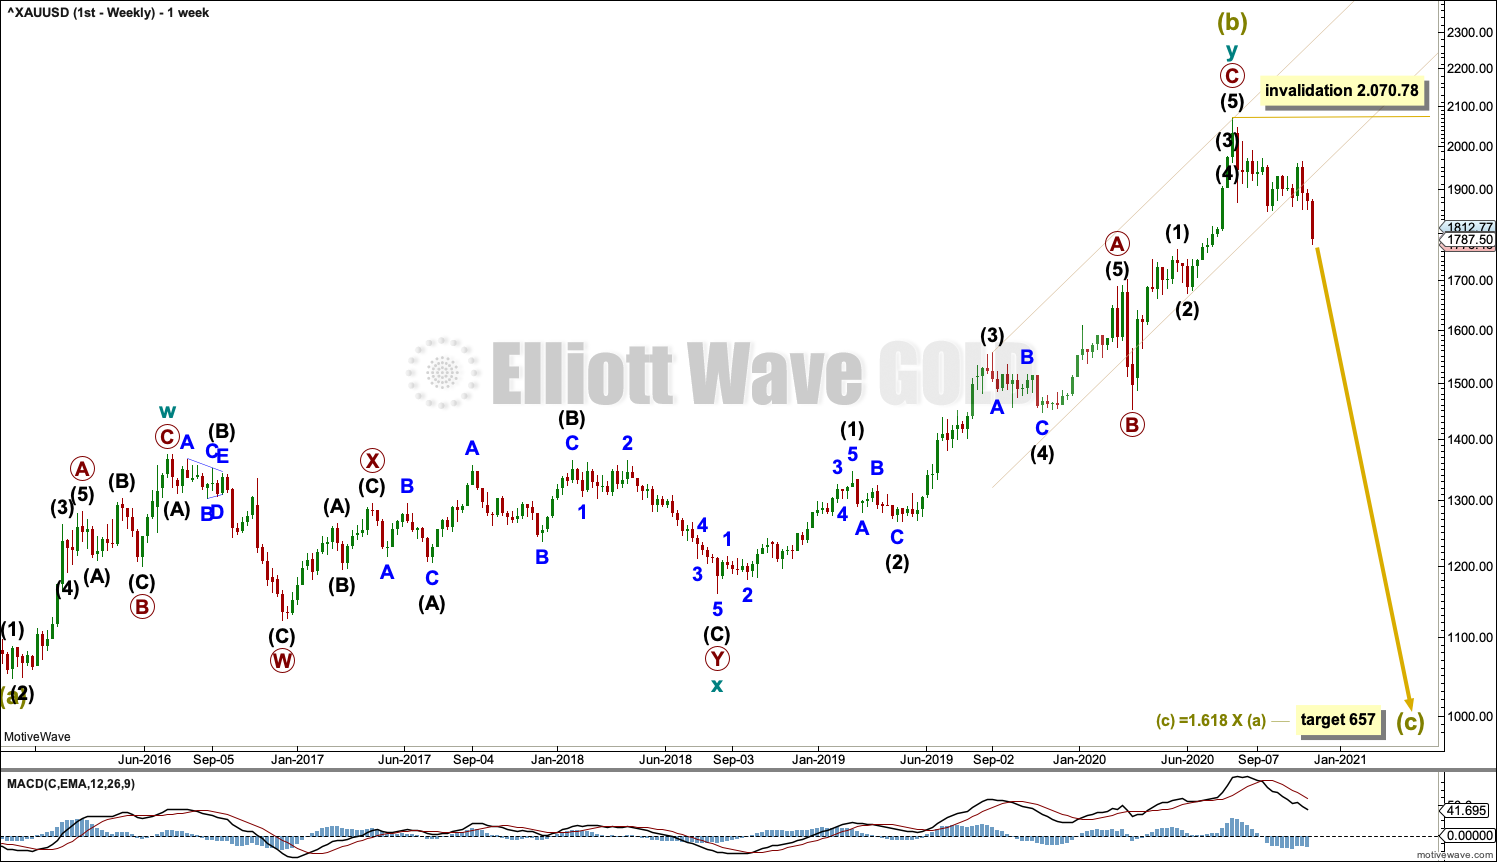
Click chart to enlarge.
The bigger picture for this first Elliott wave count sees Gold as still within a bear market, in a three steps back pattern that is labelled Grand Super Cycle wave IV on monthly charts. Grand Super Cycle wave IV may be subdividing as an expanded flat pattern.
Super Cycle wave (b) within Grand Super Cycle wave IV may be a complete double zigzag. This wave count expects Super Cycle wave (c) to begin and to move price below the end of Super Cycle wave (a) at 1,046.27. The target calculated expects a common Fibonacci ratio for Super Cycle wave (c).
The first zigzag in the double is labelled cycle wave w. The double is joined by a three in the opposite direction, a combination labelled cycle wave x. The second zigzag in the double is labelled cycle wave y.
The purpose of the second zigzag in a double is to deepen the correction. Cycle wave y has achieved this purpose.
A best fit channel is drawn about primary wave C to contain as much of this movement as possible. Copy this channel over to daily charts. This channel is now clearly breached, which suggests the upwards wave labelled cycle wave y may be over.
DAILY CHART
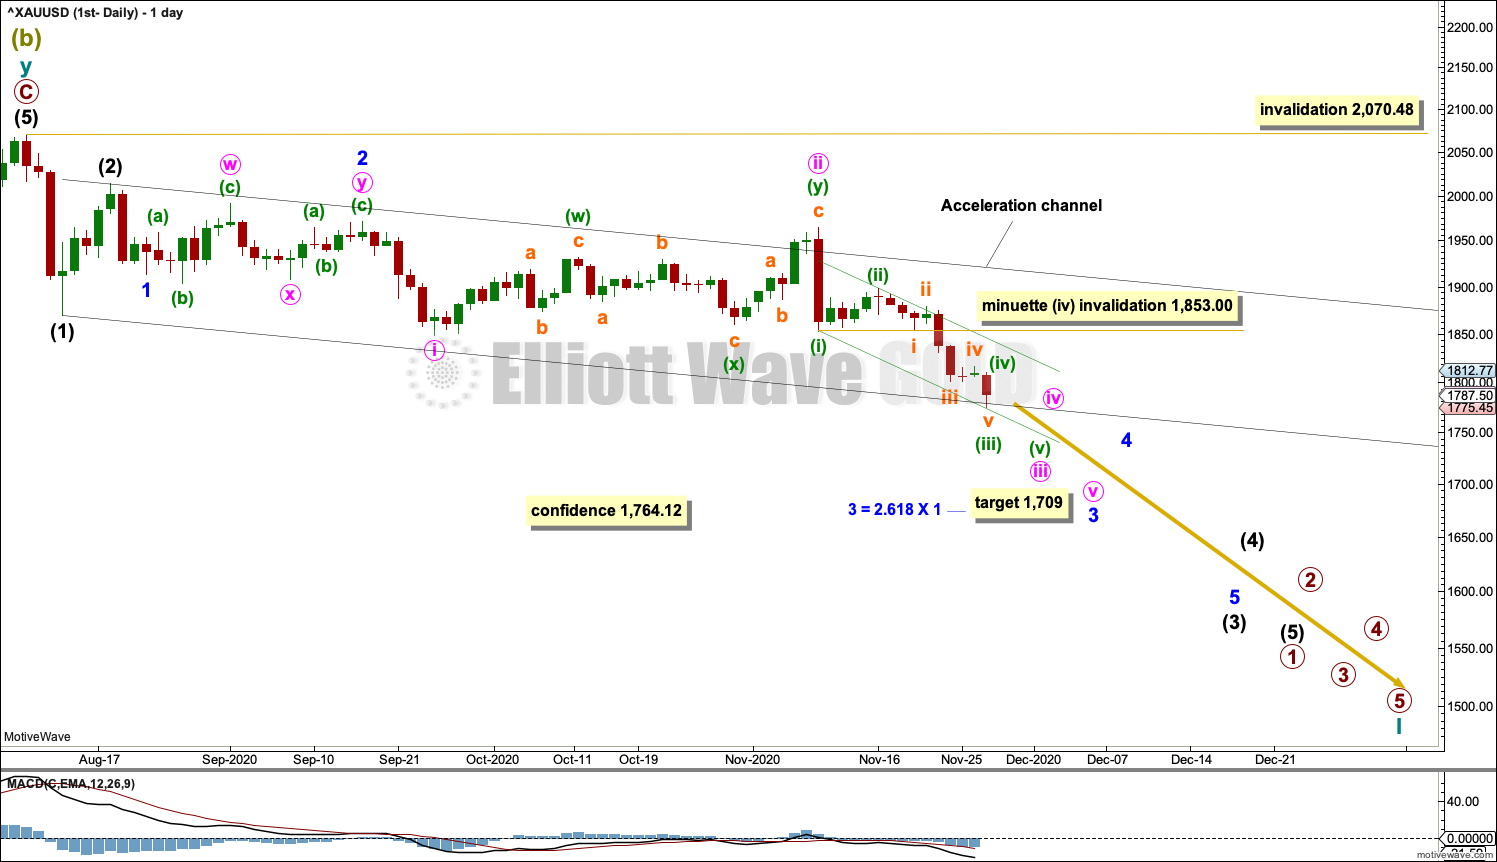
Click chart to enlarge.
Within a new bear market, primary wave 1 may be an incomplete five wave impulse.
Primary wave 2 within the new downwards trend may not move beyond the start of primary wave 1 above 2,070.48.
Within primary wave 1, the middle portion may have passed. Gold typically exhibits extended and strong fifth waves; this tendency is especially prevalent for fifth waves to end third wave impulses one degree higher. One or more of minuette wave (v), minute wave v and minor wave 5 may exhibit this tendency; there may be one or more selling climaxes along the way down.
Draw an acceleration channel about downwards movement and keep redrawing the channel as price continues lower. Draw the first trend line from the end of intermediate wave (1) to the last low, then place a parallel copy on the end of intermediate wave (2). When intermediate wave (3) may be complete, then this channel would be drawn using Elliott’s technique about primary wave 1.
Draw a small Elliott channel about the middle of the third wave. Draw the first trend line from the end of minuette wave (i) to the last low, which may be minuette wave (iii), then place a parallel copy on the high of minuette wave (ii). The upper edge of this channel may provide resistance for a bounce for minuette wave (iv). If minuette wave (v) exhibits strength, then it may breach the lower edge of the channel.
A new low below 1,764.12 would add reasonable confidence to this wave count.
Subminuette wave iv, minuette wave (iv), minute wave iv and minor wave 4 may be relatively brief and shallow.
ALTERNATE DAILY CHART
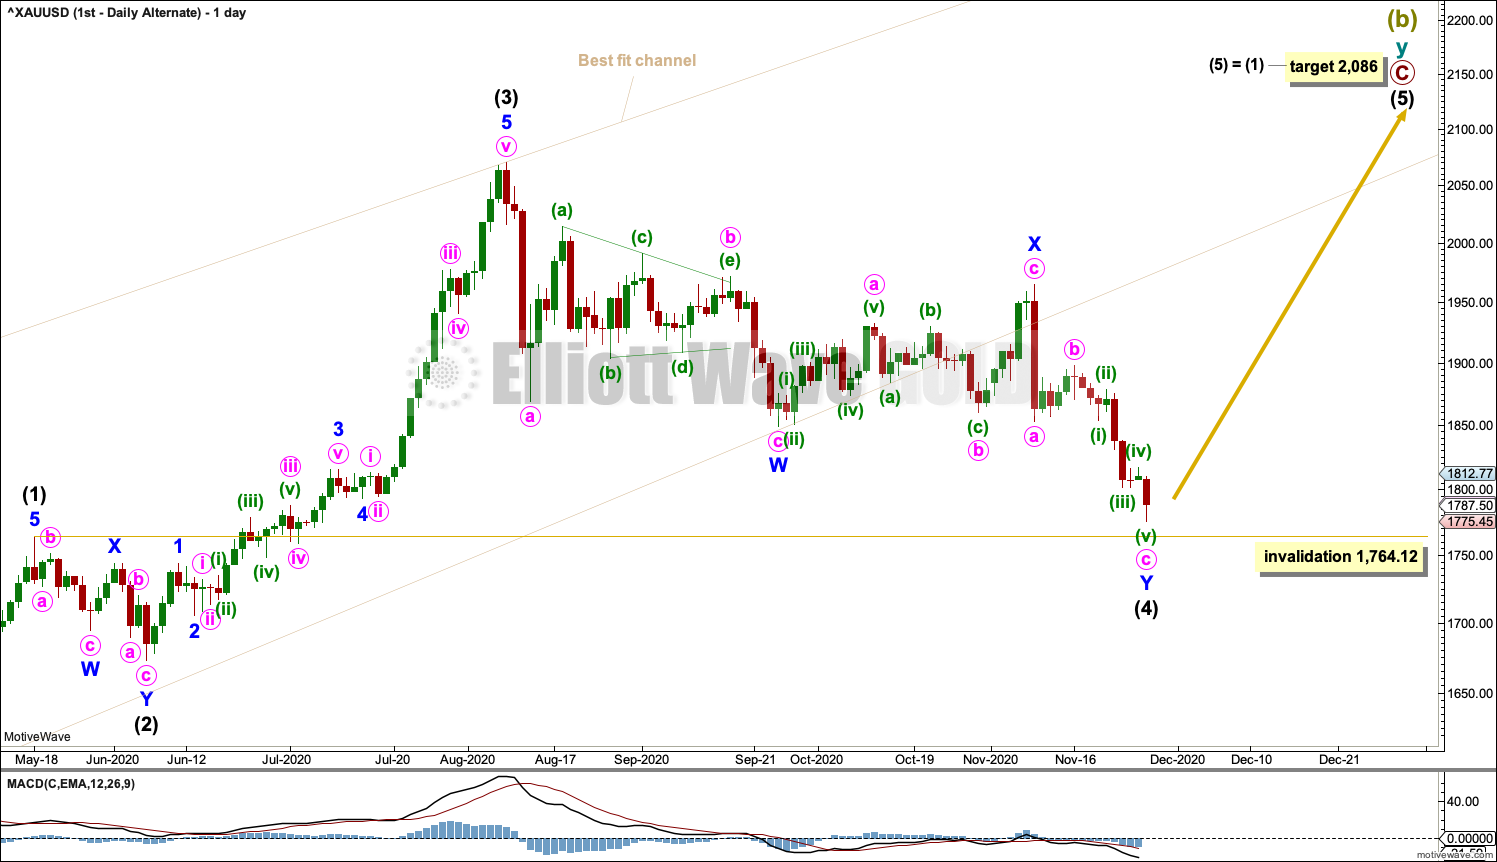
Click chart to enlarge.
Primary wave C may be incomplete.
Intermediate wave (4) may have continued lower as a double zigzag. Intermediate wave (4) is now grossly disproportionate to intermediate wave (2); intermediate wave (2) lasted 14 sessions, whereas intermediate wave (4) so far has lasted 80 sessions. This disproportion gives the wave count the wrong look and reduces its probability further.
The wide beige channel is copied over from the weekly chart. Price has now breached the channel. This channel breach favours the main wave count.
Intermediate wave (4) may not move into intermediate wave (1) price territory below 1,764.12. This is the final price point which would invalidate this wave count.
SECOND ELLIOTT WAVE COUNT
WEEKLY CHART
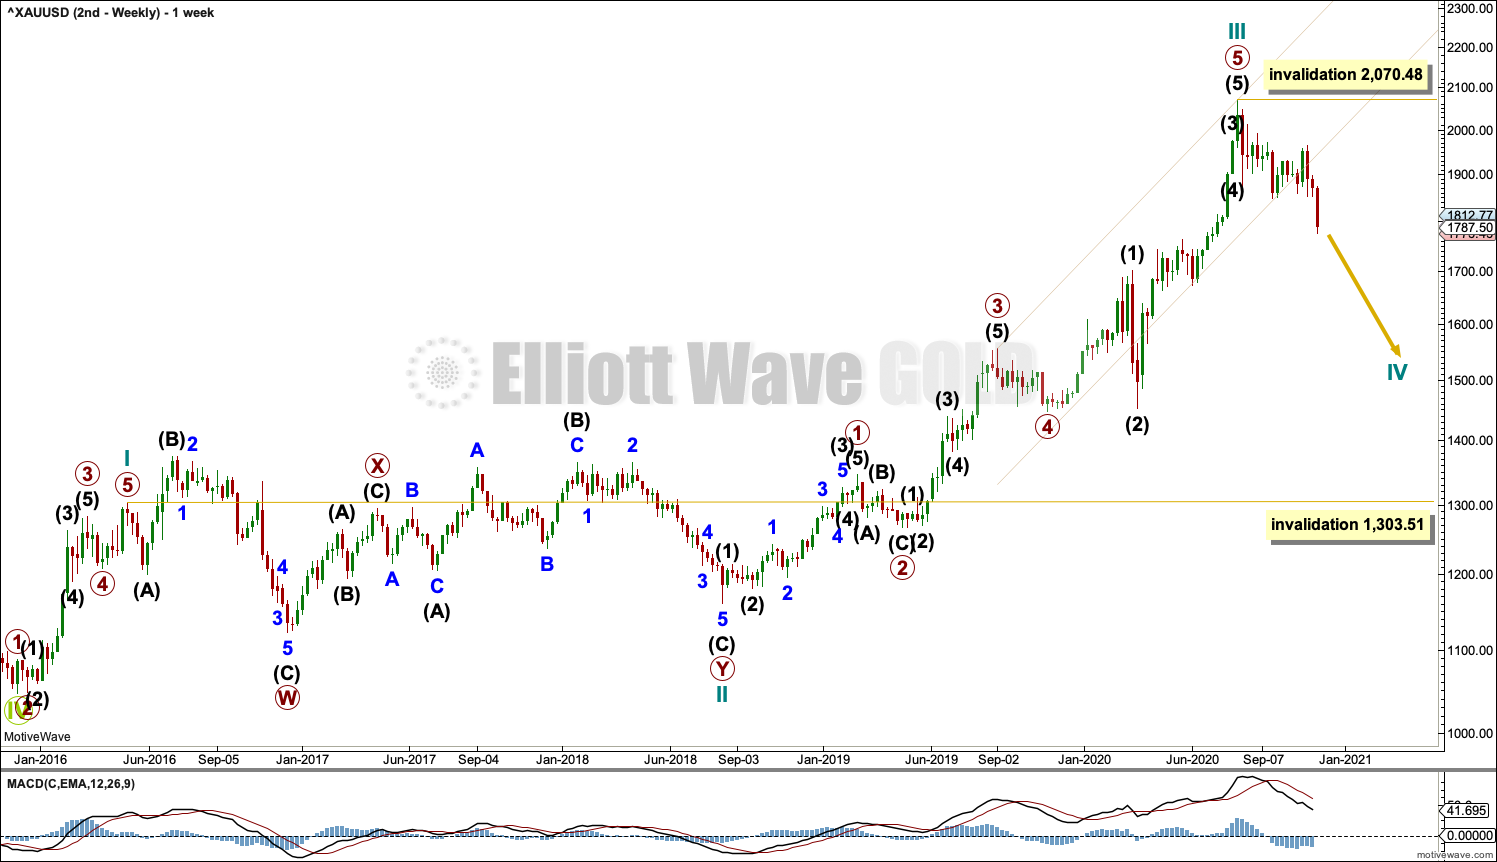
Click chart to enlarge.
This wave count sees the the bear market complete at the last major low for Gold on 3 December 2015.
If Gold is in a new bull market, then it should begin with a five wave structure upwards on the weekly chart.
Cycle wave I fits as a five wave impulse with reasonably proportionate corrections for primary waves 2 and 4.
Cycle wave II fits as a double flat. However, within the first flat correction labelled primary wave W, this wave count needs to ignore what looks like an obvious triangle from July to September 2016 (this can be seen labelled as a triangle on the first wave count above). This movement must be labelled as a series of overlapping first and second waves. Ignoring this triangle reduces the probability of this wave count in Elliott wave terms.
Cycle wave III may be complete.
A best fit channel is drawn about cycle wave III in the same way as the channel as on the first wave count.
DAILY CHART
Click chart to enlarge.
Cycle wave III may be complete, and cycle wave IV may be underway.
Cycle wave IV may subdivide as any one of more than 23 Elliott wave corrective structures. It would most likely subdivide as a zigzag. A new bearish trend at cycle degree should begin with a five wave structure downwards at the daily chart level; this would be incomplete. No second wave correction within this first five down may move beyond the start of its first wave above 2,070.48.
Targets for cycle wave IV at this stage may be calculated from Fibonacci ratios of cycle wave III. Cycle wave IV may end at either one of the 0.382 Fibonacci ratio at 1,722.96 or the 0.618 Fibonacci ratio at 1,508.27. Cycle wave IV may not move into cycle wave I price territory below 1,303.51 (this can be seen on the weekly chart).
TECHNICAL ANALYSIS
WEEKLY CHART
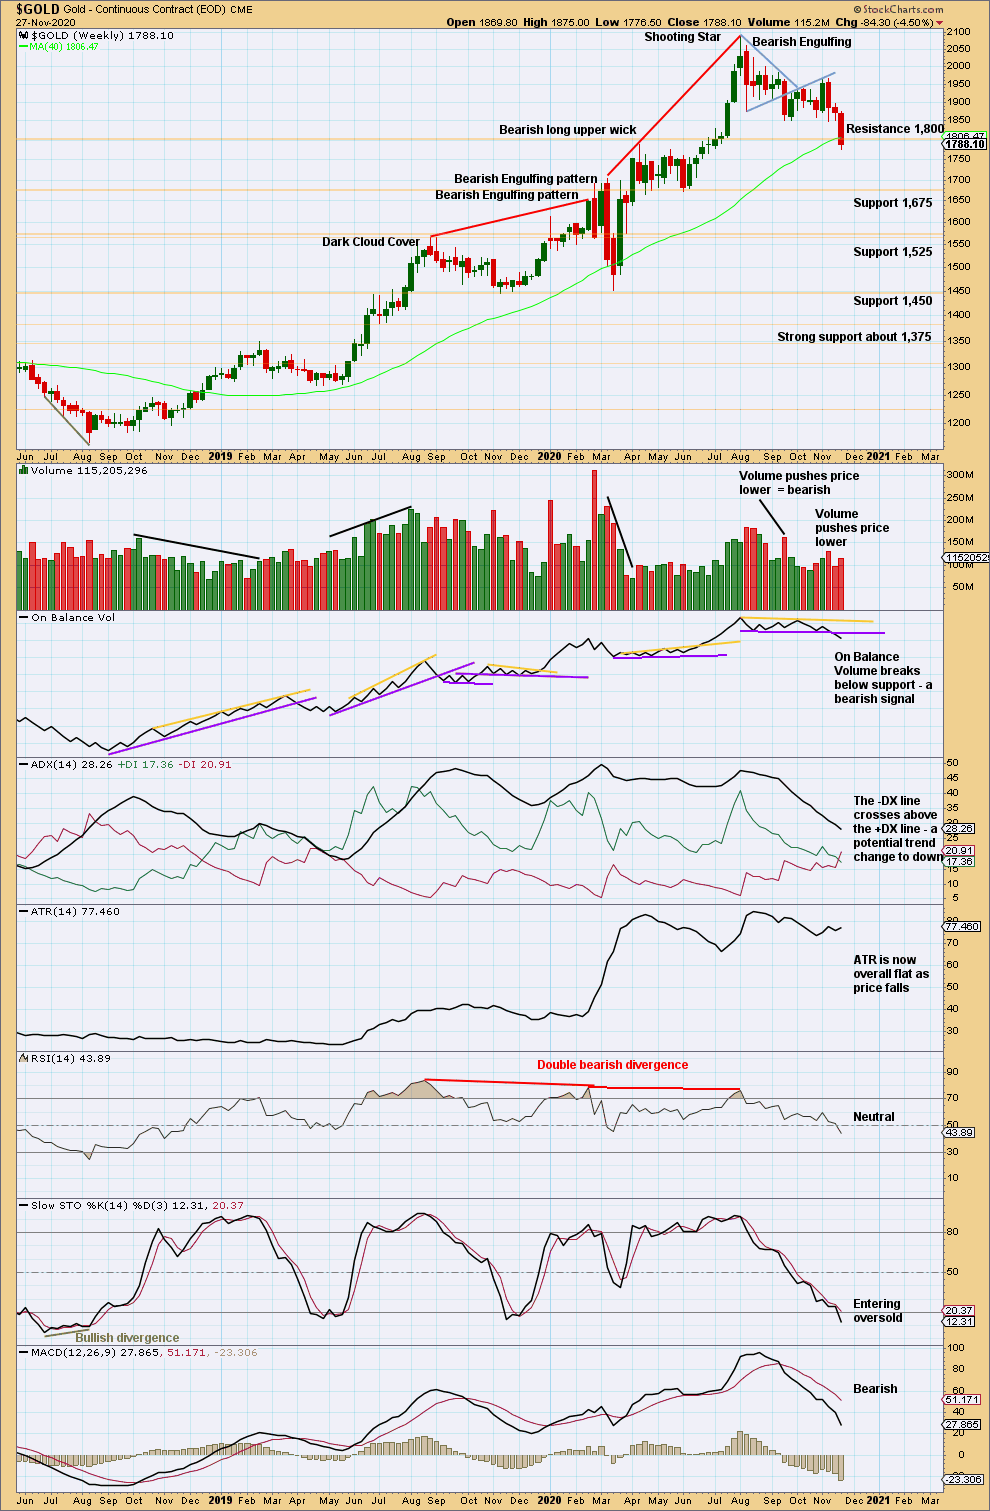
Click chart to enlarge. Chart courtesy of StockCharts.com.
At the last high were two bearish candlestick patterns with overbought RSI exhibiting double bearish divergence. It is possible there may have been a 180° trend change at the high. A new swing low below 1,671.70 would add confidence in that view.
This week price has effected a downwards breakout below support (at about 1,800) which may now provide resistance. The breakout has support from volume at the weekly chart level, which is impressive. This chart supports the main Elliott wave counts, both first and second.
DAILY CHART
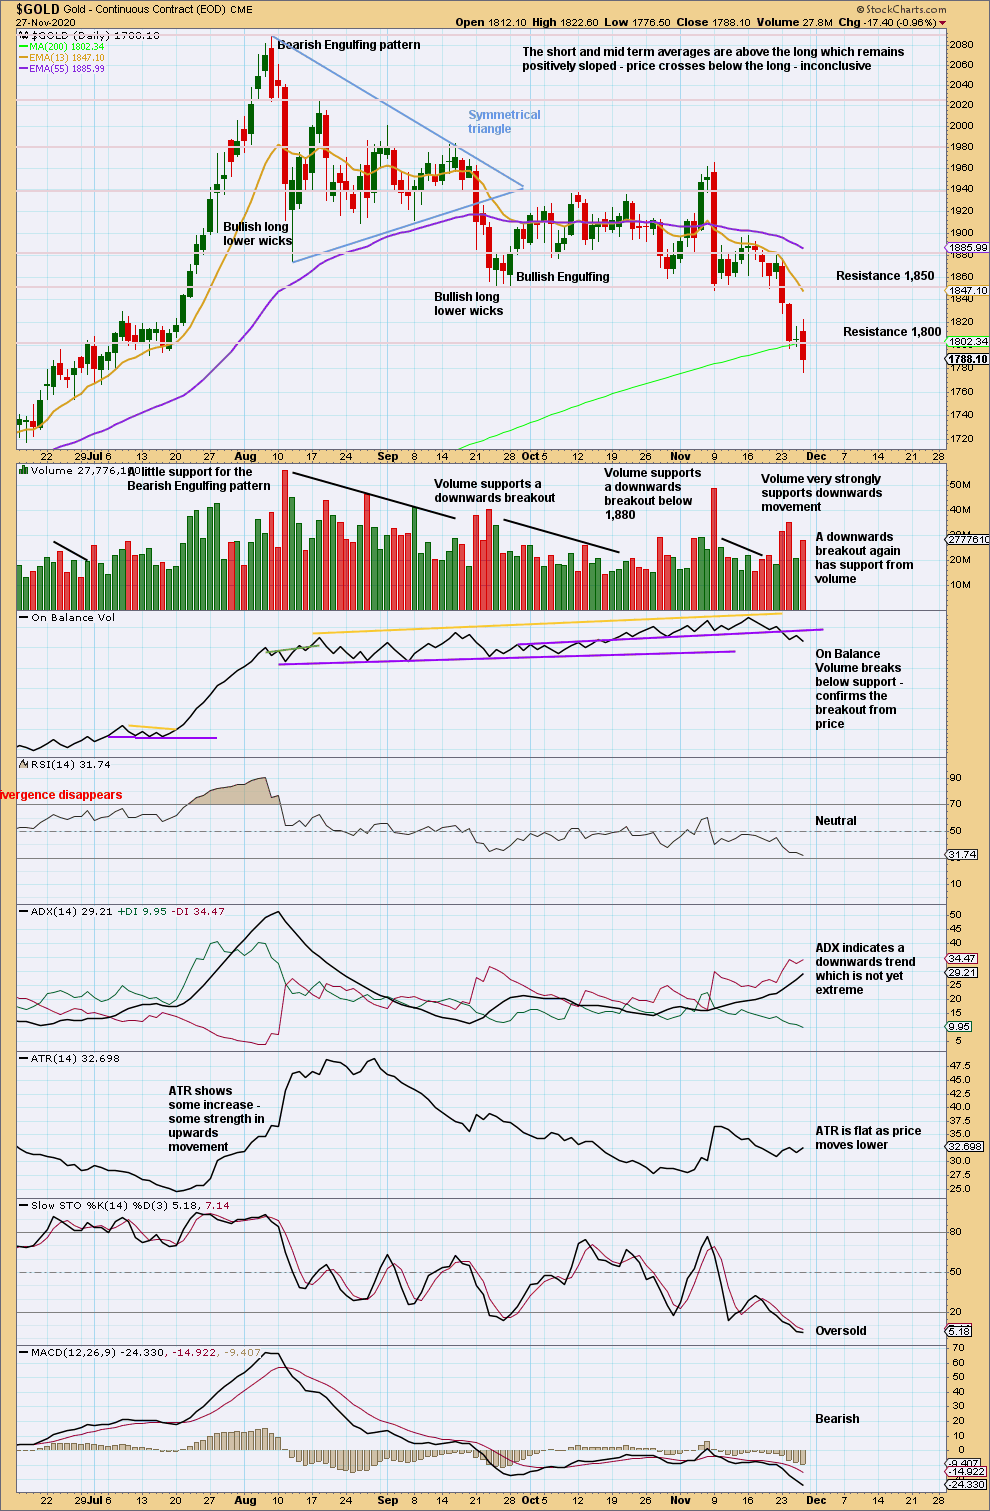
Click chart to enlarge. Chart courtesy of StockCharts.com.
Next support below is at 1,670 to 1,675.
Stochastics may remain extreme for reasonable periods of time when Gold trends. When ADX and RSI both reach extreme, and thereafter RSI exhibits bullish divergence, then a low may be in place. While neither ADX nor RSI are yet extreme, there is room for this downwards trend to continue.
This chart supports the main Elliott wave counts.
GDX WEEKLY CHART
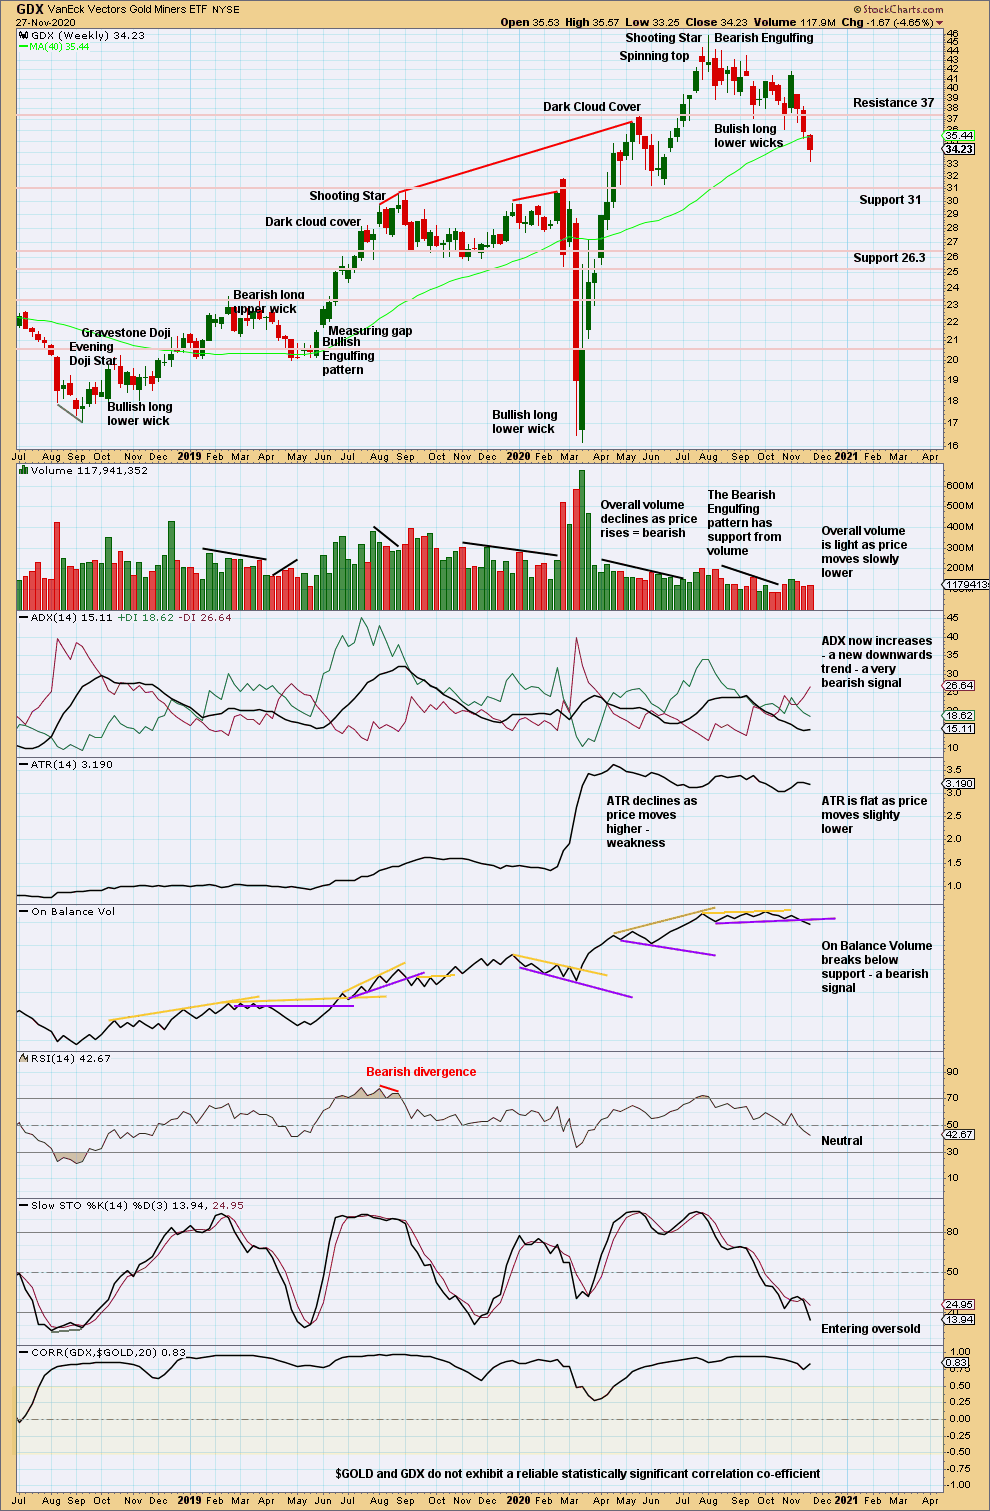
Click chart to enlarge. Chart courtesy of StockCharts.com.
ADX gives a strong bearish signal this week.
Look out for bounces along the way down in this new trend about identified horizontal support lines on the chart.
GDX DAILY CHART
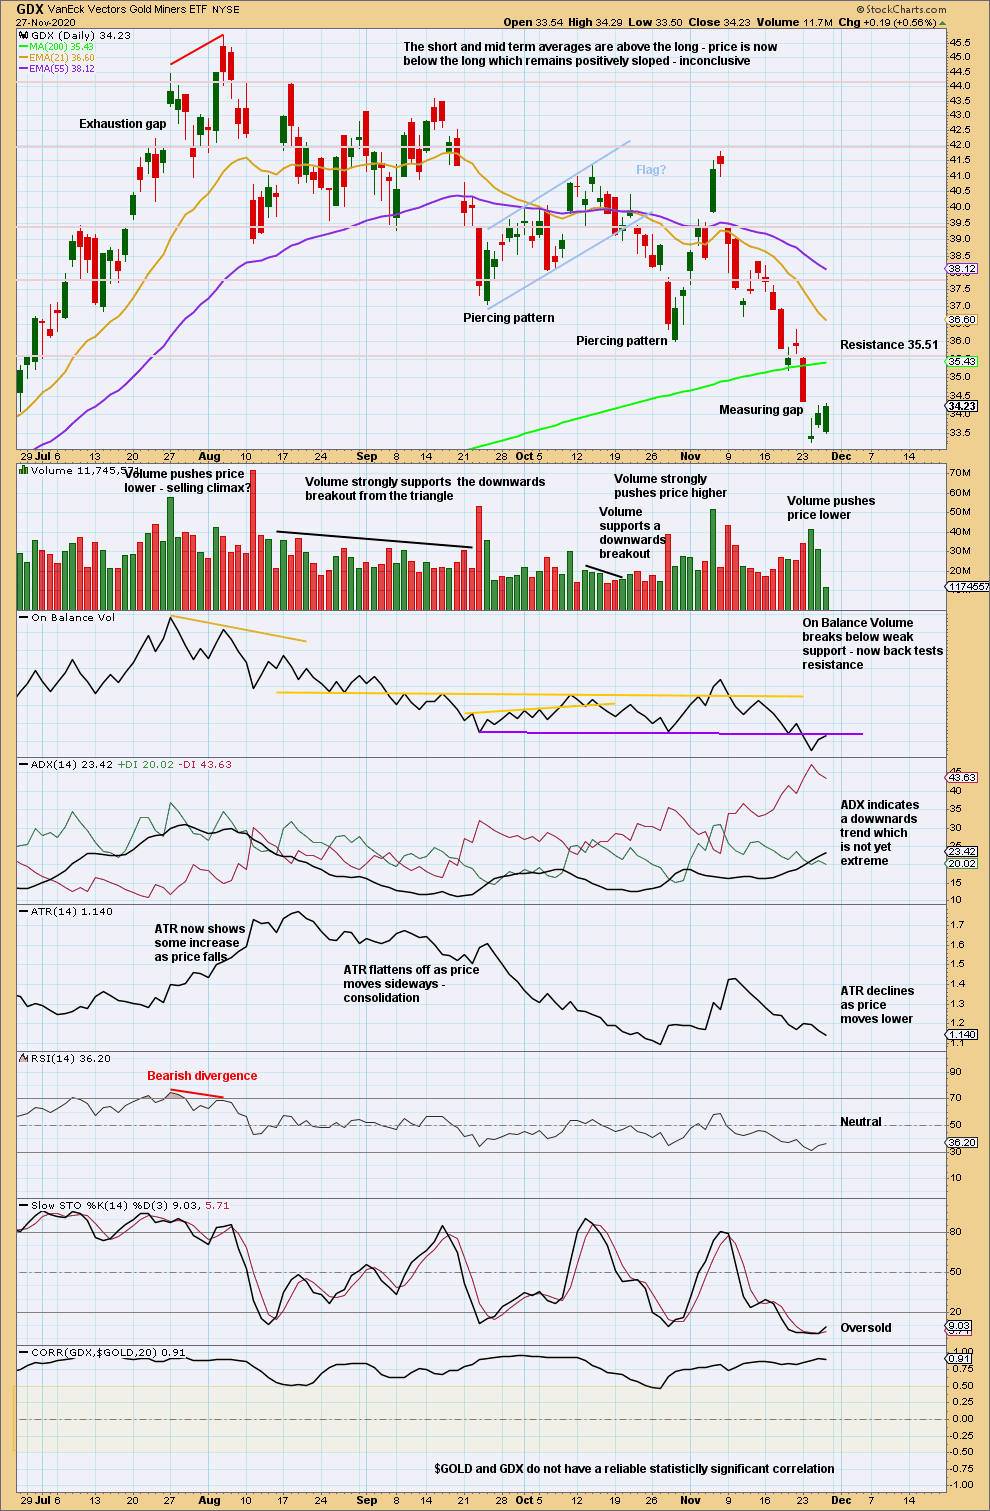
Click chart to enlarge. Chart courtesy of StockCharts.com.
Next support on the weekly chart is at 31. The measuring gap gives a target at 31.88. The gap remains open, so the target remains valid. If the gap is closed, then it would be renamed an exhaustion gap and a deeper bounce or trend change may then be expected.
US OIL
This week’s upwards movement invalidated the daily Elliott wave counts, indicating the second wave may be over. Targets for a third wave are now calculated.
Summary: An upwards trend may resume with increased strength. Two targets for a third wave are first at 87.90 and thereafter at 121.43.
Oil may have found a major sustainable low in April 2020.
ELLIOTT WAVE COUNT
MONTHLY CHART
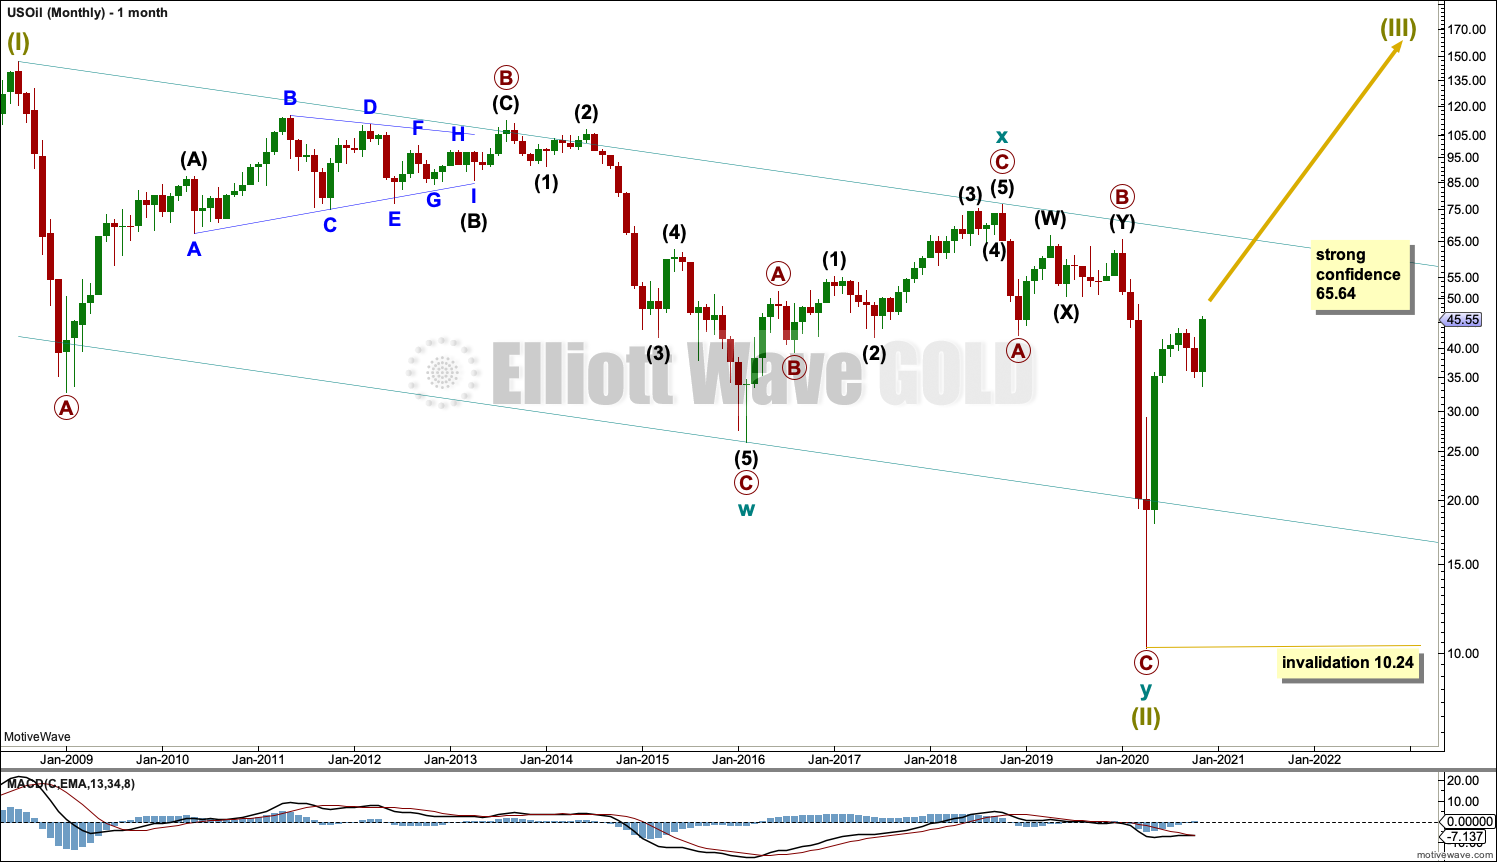
Click chart to enlarge.
The basic Elliott wave structure is five steps forward and three steps back. This Elliott wave count expects that US Oil has completed a three steps back pattern, which began in July 2008. The Elliott wave count expects that the bear market for US Oil may now be over.
A channel is drawn about Super Cycle wave (II): draw the first trend line from the start of cycle wave w to the end of cycle wave x, then place a parallel copy on the end of cycle wave w. Price has bounced up off the channel. This trend line is breached, which is a typical look for the end of a movement for a commodity.
The upper edge of the channel may provide resistance.
Following five waves up and three steps back should be another five steps up; this is labelled Super Cycle wave (III), which may only have just begun. Super Cycle wave (III) may last a generation and must make a new high above the end of Super Cycle wave (I) at 146.73.
Super Cycle wave (III) may only subdivide as a five wave impulse. New trends for Oil usually start out very slowly with short first waves and deep time consuming second wave corrections. However, while this is a common tendency, it is not always seen and may not have been seen in this instance. The first reasonably sized pullback may be over already.
WEEKLY CHART
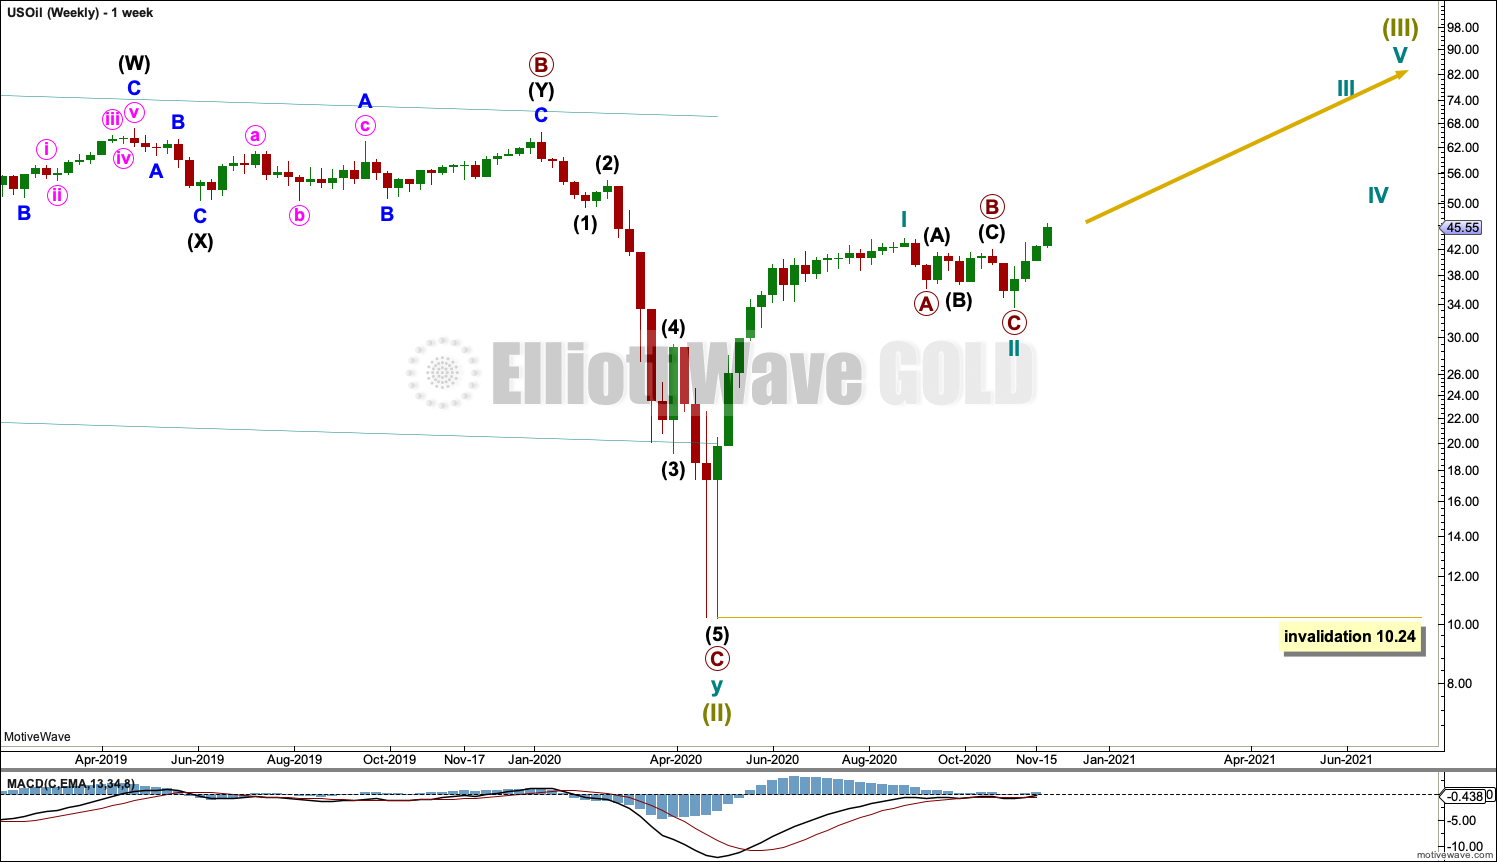
Click chart to enlarge.
Super Cycle wave (III) must subdivide as an impulse. Cycle wave I within the impulse may be complete. Cycle wave II may also now be complete, and cycle wave III upwards may now have begun. If cycle wave II continues lower, then it may not move beyond the start of cycle wave I below 10.24.
DAILY CHART
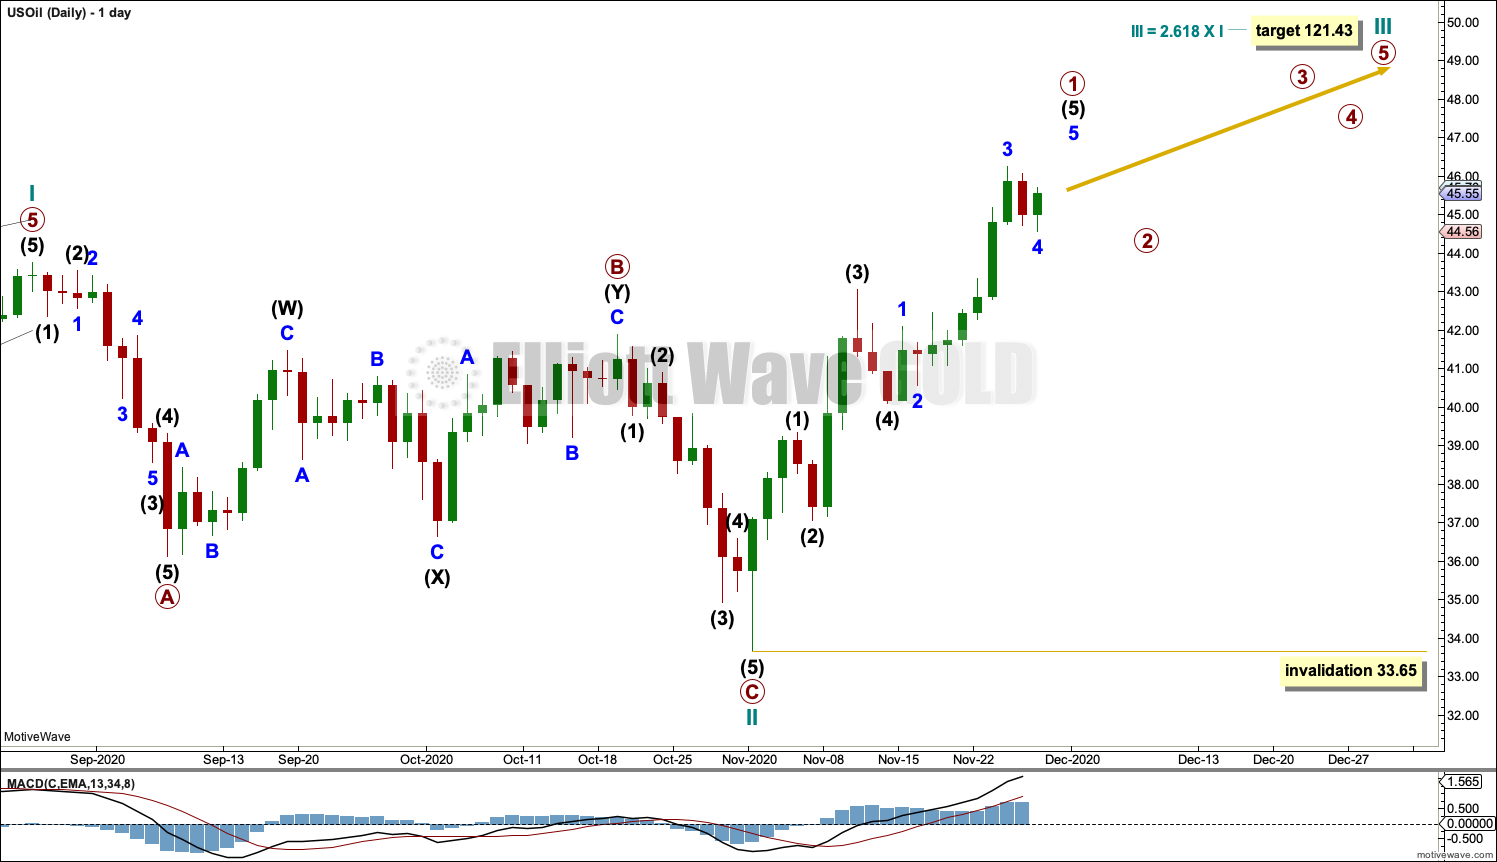
Click chart to enlarge.
Cycle wave II may be a complete zigzag and only 0.3 of cycle wave I in depth, which is possible. Classic technical analysis sees strength in upwards movement of this week, which supports this wave count.
Cycle wave III may only subdivide as an impulse. Within the impulse: Primary wave 1 may be almost complete, and primary wave 2 may not move beyond the start of primary wave 1 below 33.65.
FIRST ALTERNATE DAILY CHART
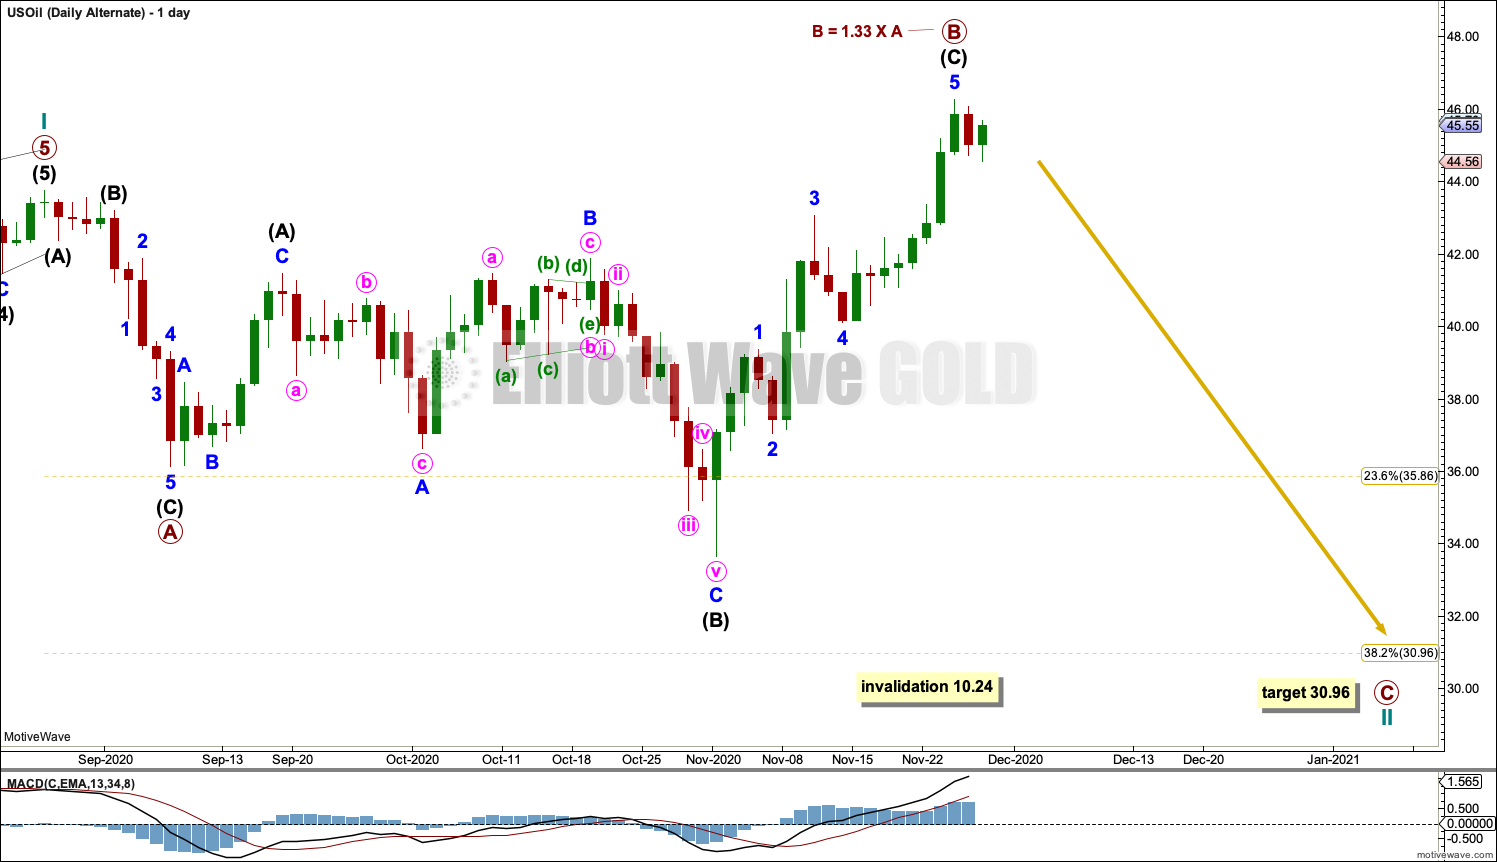
Click chart to enlarge.
This first alternate wave count moves the degree of labelling within cycle wave II down one degree.
Cycle wave II may be continuing further as an expanded flat. Primary wave B within the expanded flat is within the common range to primary wave A of 1 to 1.38.
Primary wave C for this wave count would be extremely likely to move at least slightly below the end of primary wave A at 36.13 to avoid a truncation. Cycle wave II may not move beyond the start of cycle wave I below 10.24.
SECOND ALTERNATE DAILY CHART
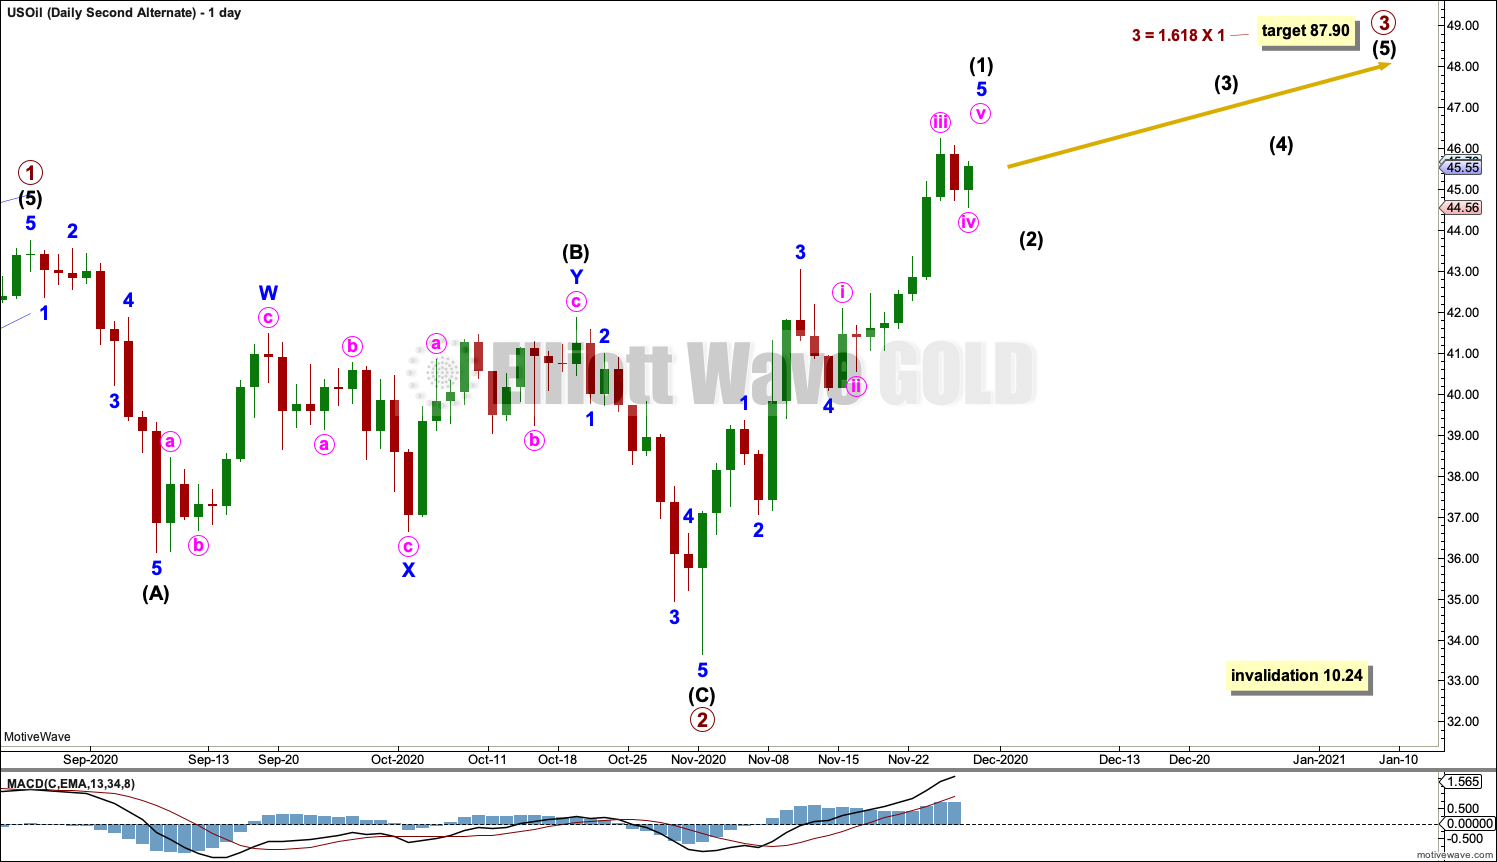
Click chart to enlarge.
It is also possible that the degree of labelling at the daily chart level may need to be changed back down one degree. It may be that only primary wave 1 is complete within cycle wave I and the pullback may be primary wave 2.
Primary wave 2 may be complete. A target is calculated for primary wave 3.
TECHNICAL ANALYSIS
WEEKLY CHART
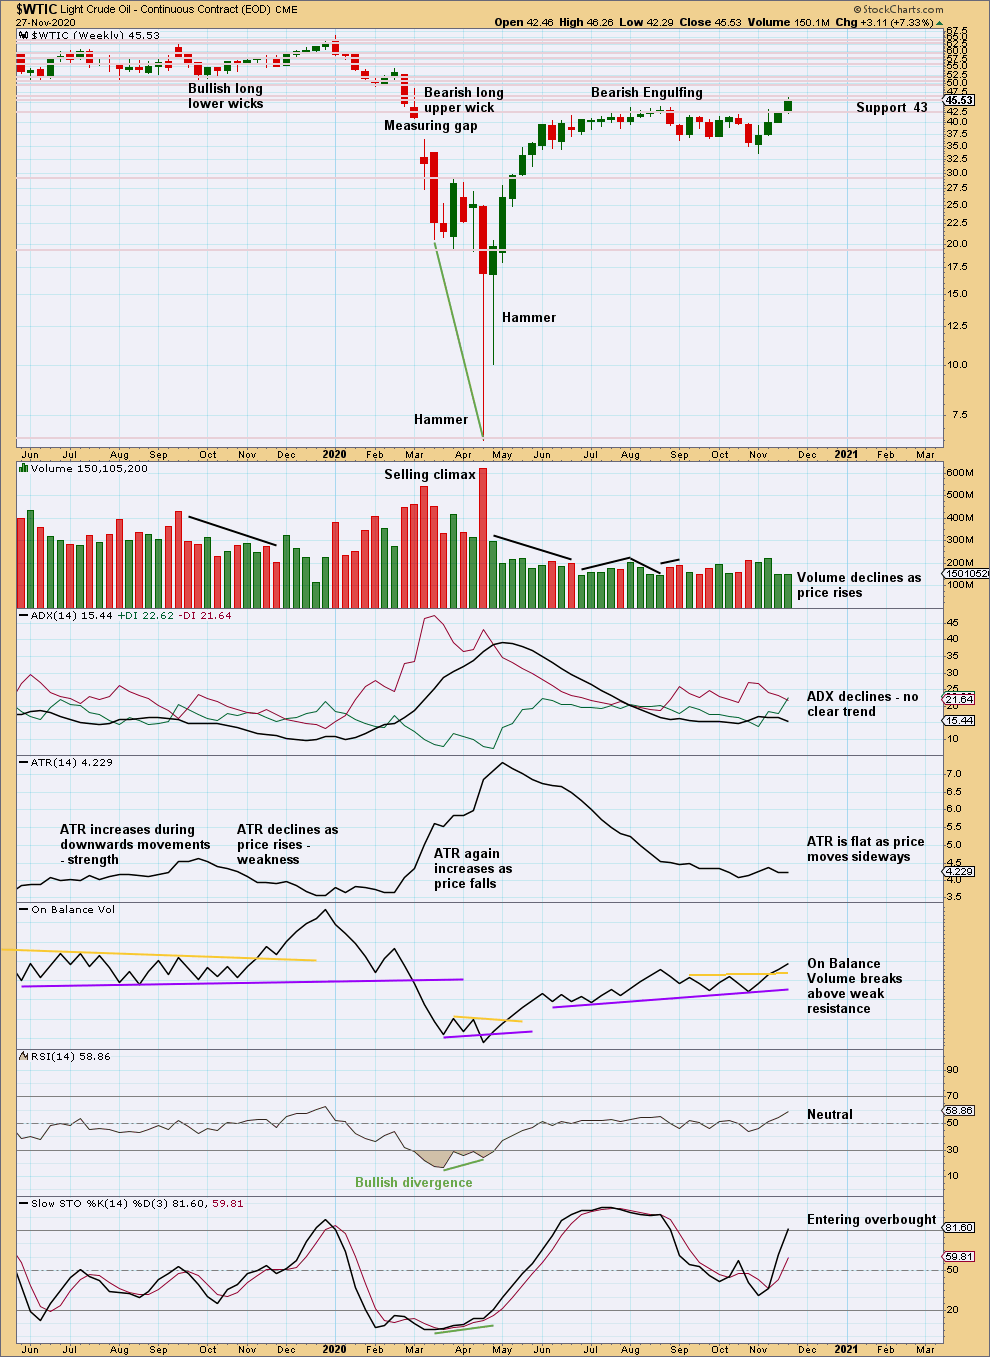
Click chart to enlarge. Chart courtesy of StockCharts.com.
Price is within a cluster of resistance and support; this may slow it down.
Volume has declined, but the volume profile may be light due to New York closed for Thanksgiving Day this week.
DAILY CHART
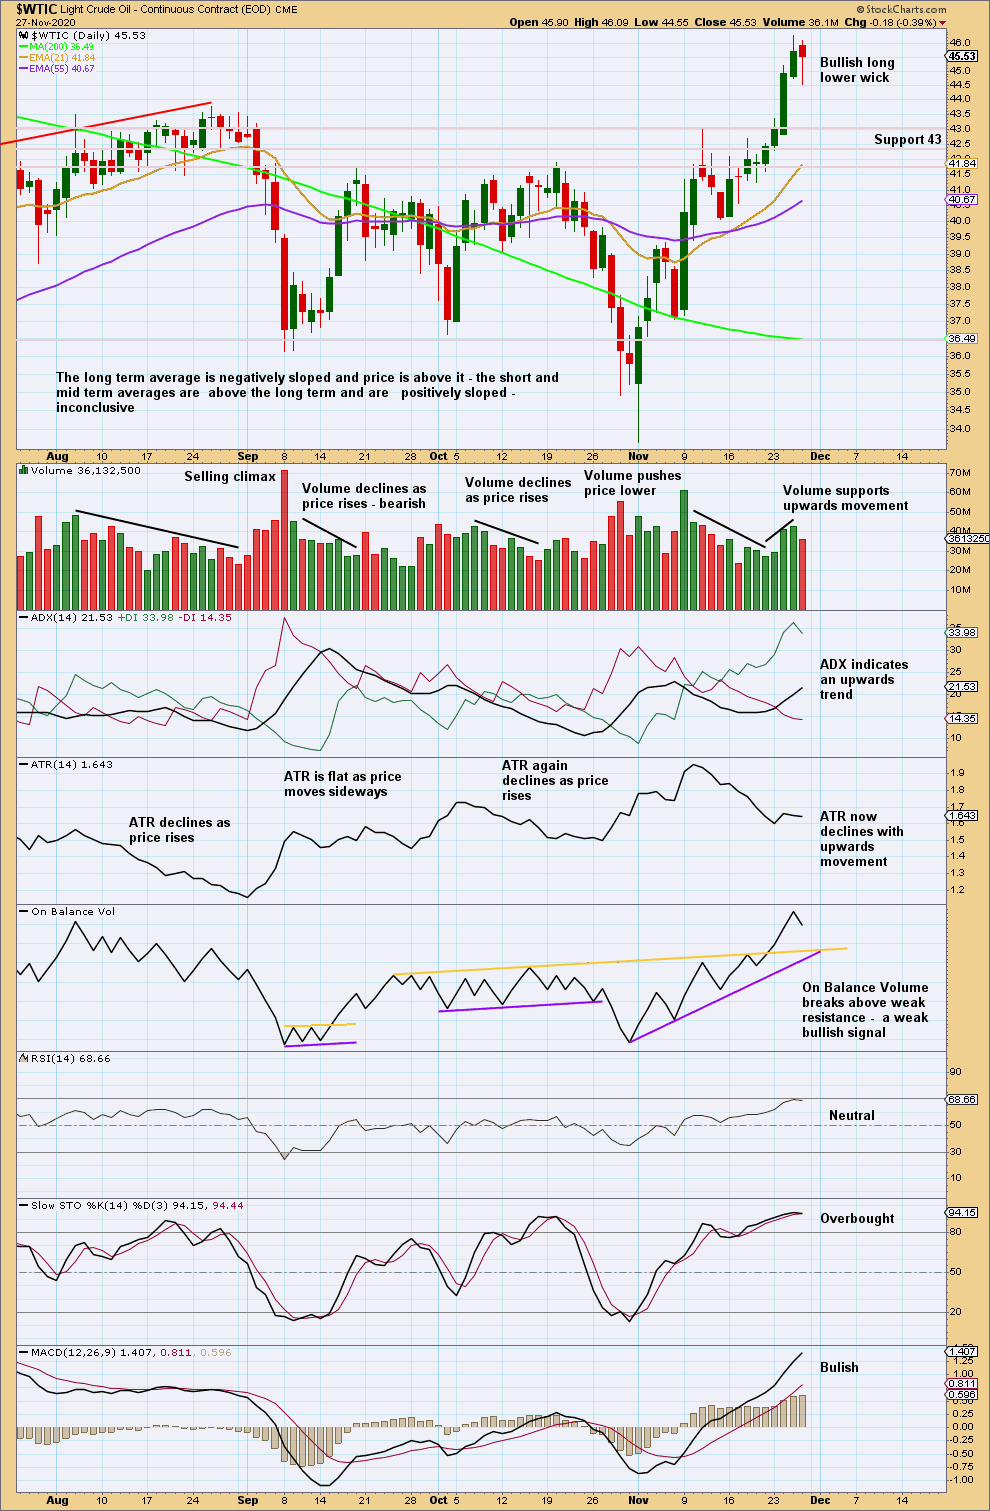
Click chart to enlarge. Chart courtesy of StockCharts.com.
At the daily chart level, there is support from volume for upwards movement.
RSI is not yet overbought. There is room for the upwards trend to continue.
—
Always practice good risk management as the most important aspect of trading. Always trade with stops and invest only 1-5% of equity on any one trade. Failure to manage risk is the most common mistake new traders make.