
US OIL: Elliott Wave and Technical Analysis | Charts – November 6, 2020
Downwards movement has continued as expected this week with a lower low and a lower high, but the week will close green with a strong bounce.
Summary: Downwards movement may overall continue lower. In a downwards trend bounces may be opportunities.
A multi-week pullback is expected to end about 23.05. It is possible the pullback may be deeper than this though; the first major correction within a new trend for Oil tends to be very deep.
When this pullback may be complete, then an upwards trend should resume with increased strength.
Oil may have found a major sustainable low in April 2020.
ELLIOTT WAVE COUNT
MONTHLY CHART
Click chart to enlarge.
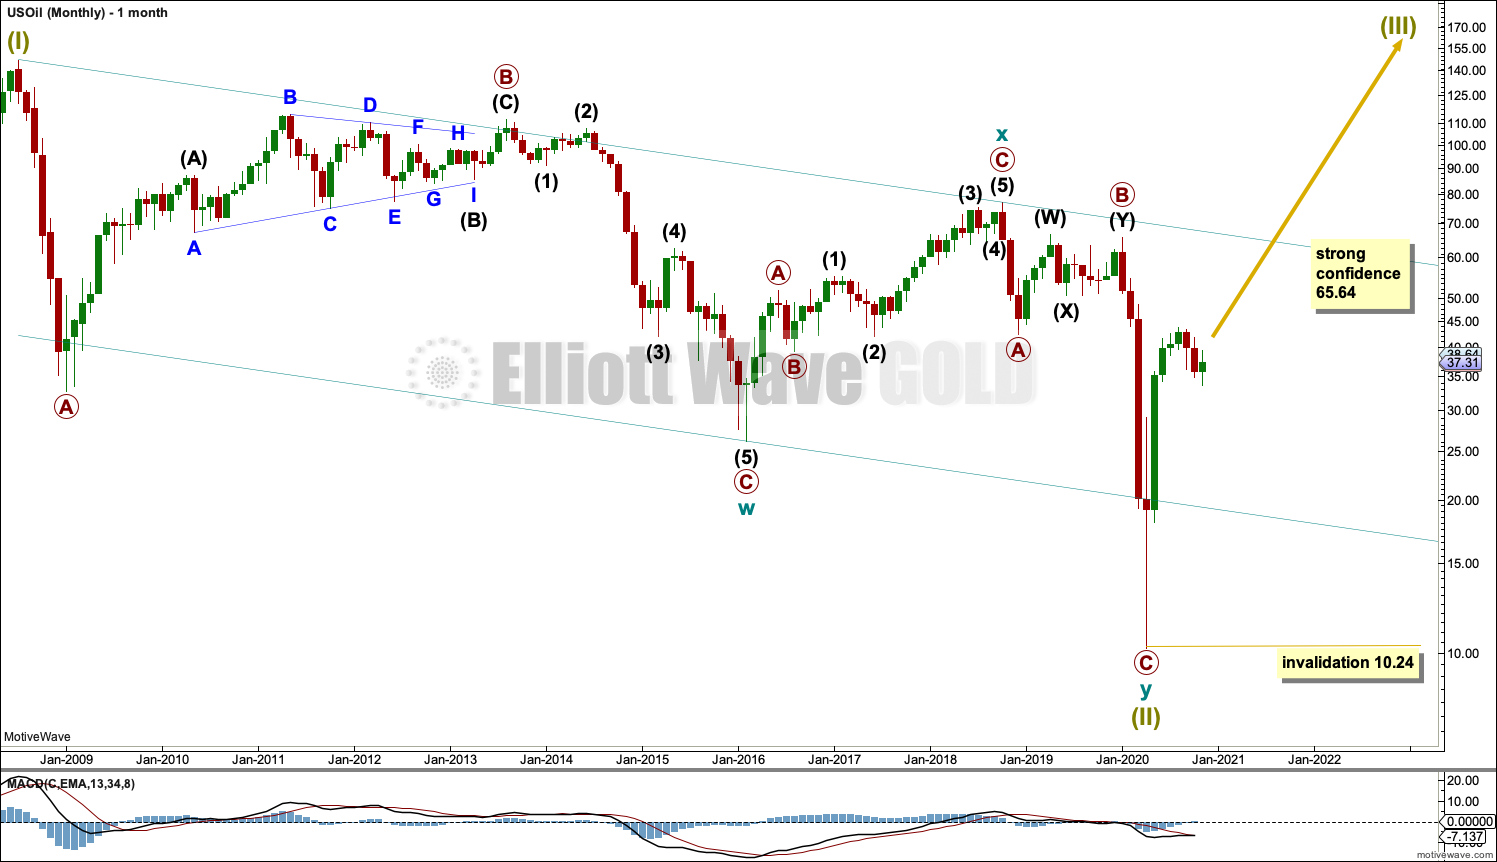
The basic Elliott wave structure is five steps forward and three steps back. This Elliott wave count expects that US Oil has completed a three steps back pattern, which began in July 2008. The Elliott wave count expects that the bear market for US Oil may now be over.
A channel is drawn about Super Cycle wave (II): draw the first trend line from the start of cycle wave w to the end of cycle wave x, then place a parallel copy on the end of cycle wave w. Price has bounced up off the channel. This trend line is breached, which is a typical look for the end of a movement for a commodity.
The upper edge of the channel may provide resistance.
Following five waves up and three steps back should be another five steps up; this is labelled Super Cycle wave (III), which may only have just begun. Super Cycle wave (III) may last a generation and must make a new high above the end of Super Cycle wave (I) at 146.73.
Super Cycle wave (III) may only subdivide as a five wave impulse. New trends for Oil usually start out very slowly with short first waves and deep time consuming second wave corrections. Basing action over a few years may now have begun.
WEEKLY CHART
Click chart to enlarge.
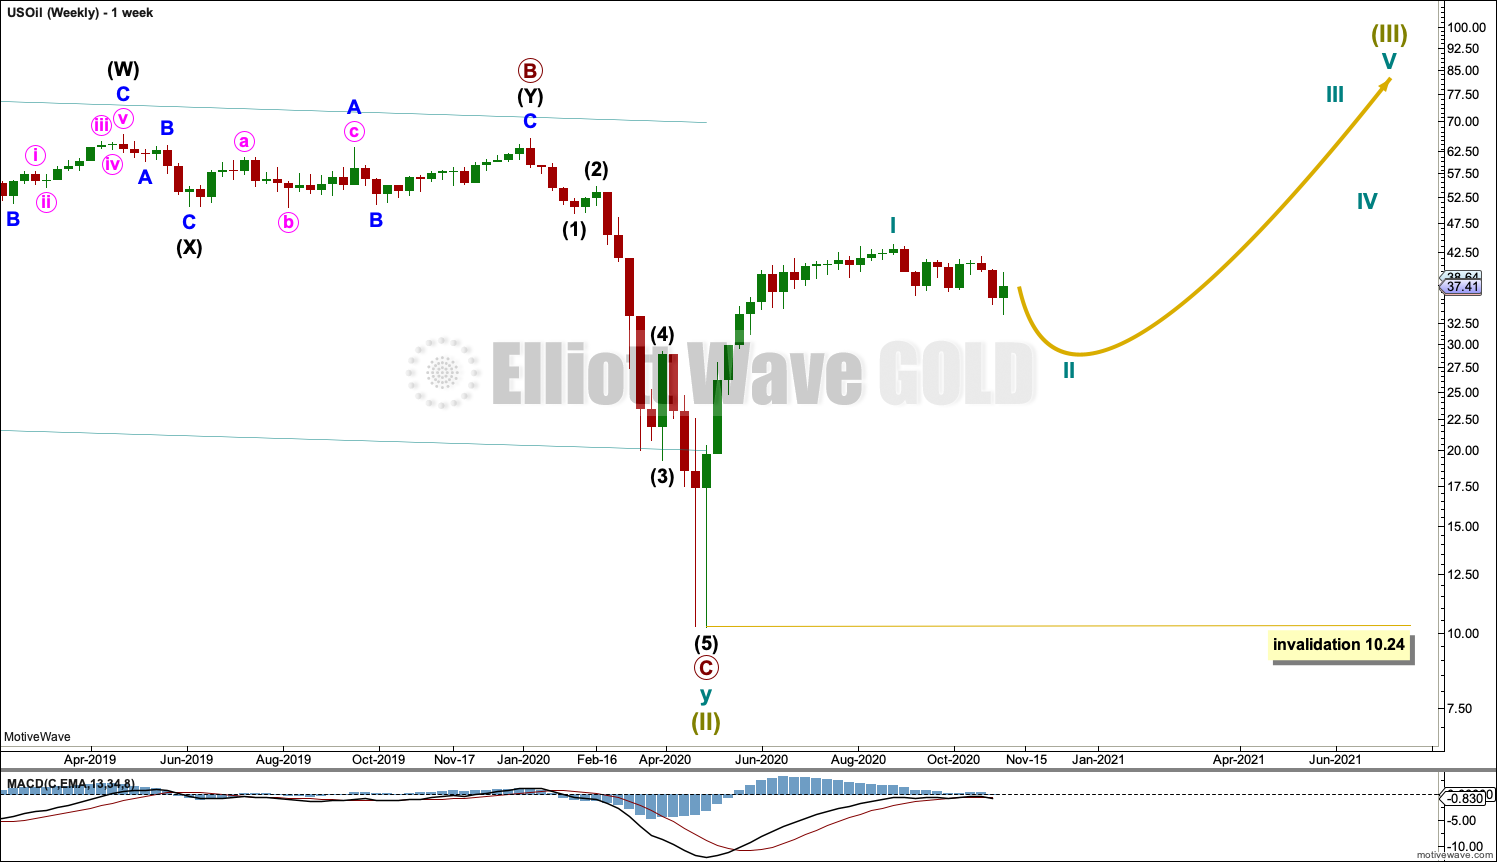
Super Cycle wave (III) must subdivide as an impulse. Cycle wave I within the impulse may be complete. Cycle wave II may not move beyond the start of cycle wave I below 10.24.
DAILY CHART
Click chart to enlarge.
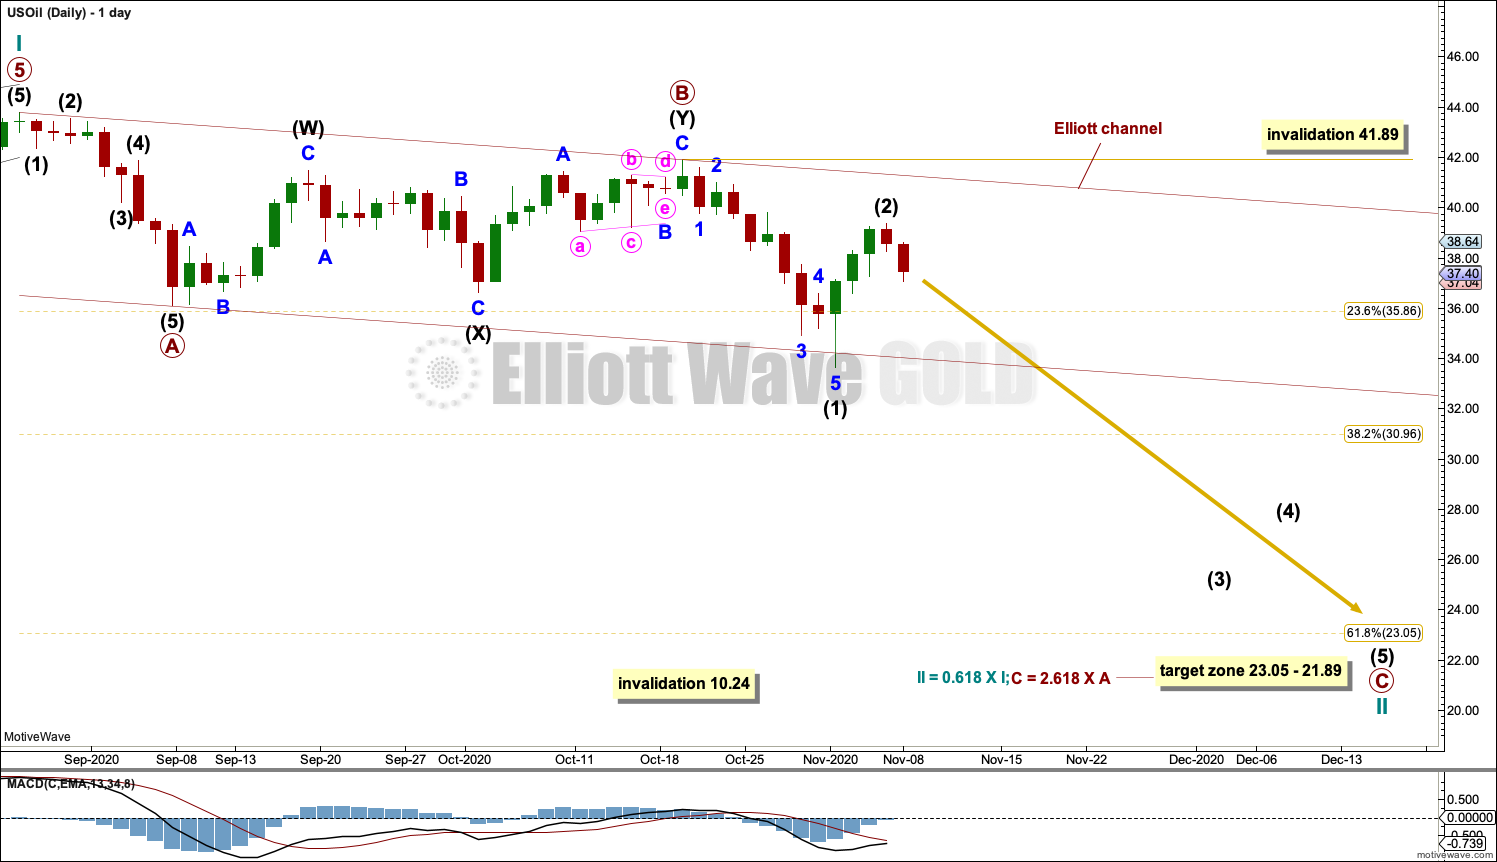
Cycle wave II may subdivide as any corrective Elliott wave structure except a triangle. At this stage, cycle wave II may be an incomplete zigzag that may end close to the 0.618 Fibonaccci ratio.
Primary wave B may be a completed double zigzag.
Primary wave C downwards may have begun. Primary wave C must subdivide as a five wave motive structure. Intermediate wave (2) within primary wave C may not move beyond the start of intermediate wave (1) above 41.89.
Draw a channel about cycle wave II using Elliott’s technique for a correction: draw the first trend line from the start of primary wave A to the end of primary wave B, then place a parallel copy on the end of primary wave A. The upper edge may provide resistance if intermediate wave (2) moves higher. If price breaches the lower edge of this channel, then the first alternate wave count below may be preferred, although C waves may sometimes behave like third waves and breach channels.
Cycle wave II may not move beyond the start of cycle wave I below 10.24.
FIRST ALTERNATE DAILY CHART
Click chart to enlarge.
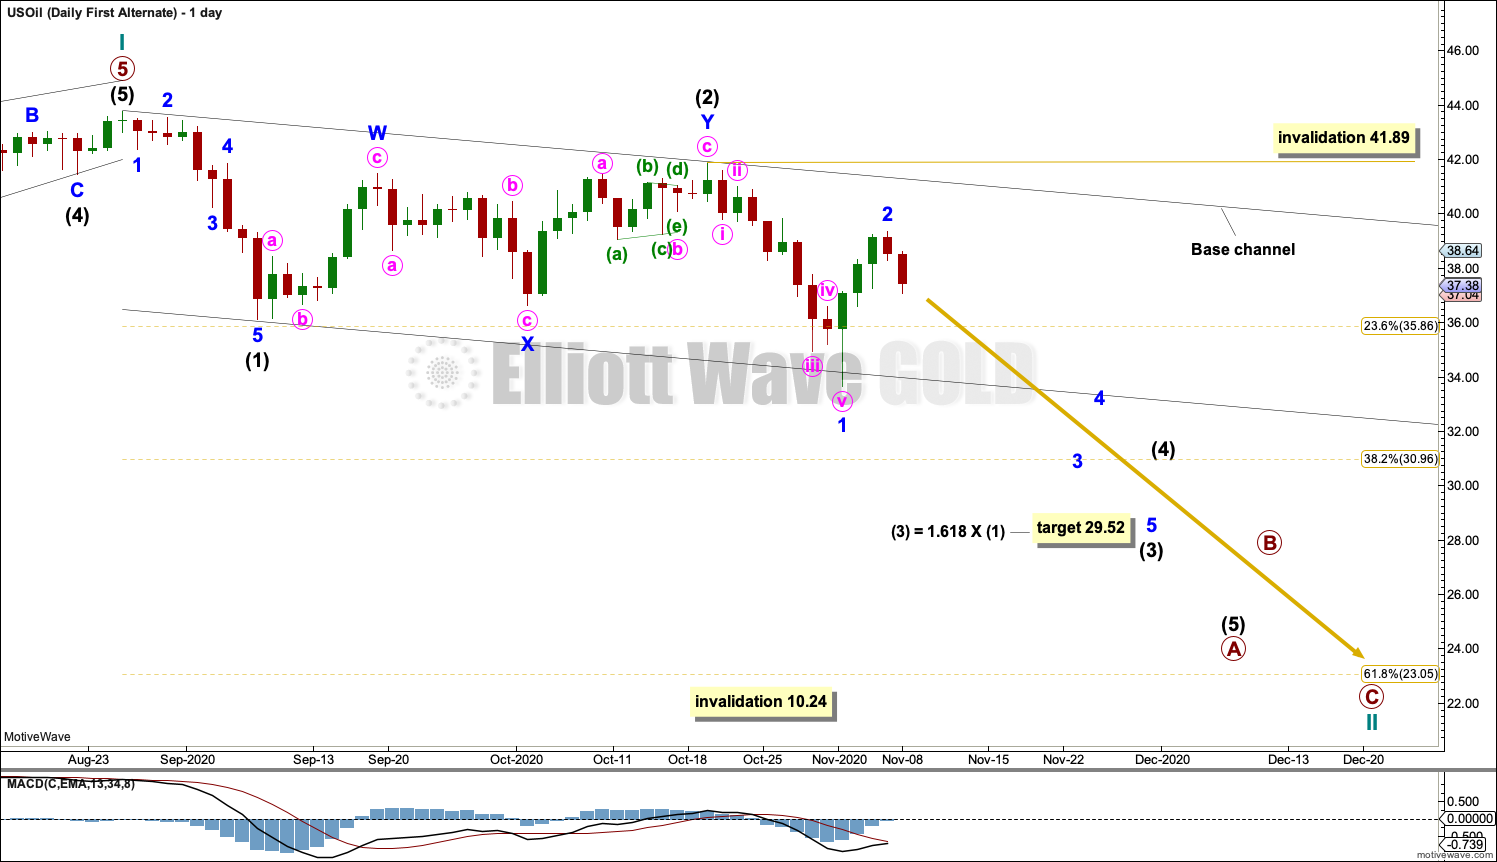
This first alternate wave count moves the degree of labelling within cycle wave II down one degree.
Cycle wave II may be subdividing as a zigzag. Primary wave A within cycle wave II may be an incomplete impulse.
Intermediate wave (2) may be a complete double zigzag.
Intermediate wave (3) within primary wave A may have begun. Intermediate wave (3) may only subdivide as an impulse. If it continues higher, then minor wave 2 within intermediate wave (3) may not move beyond the start of minor wave 1 above 41.89.
A target is calculated for intermediate wave (3) that expects a common Fibonacci ratio to intermediate wave (1).
Draw a base channel about intermediate waves (1) and (2): draw the first trend line from the start of intermediate wave (1) to the end of intermediate wave (2), then place a parallel copy on the end of intermediate wave (1). The upper edge of the base channel may provide resistance for bounces along the way down. The lower edge of the base channel should be breached by the momentum of intermediate wave (3), and then it may provide resistance.
The 0.618 Fibonacci ratio of cycle wave I at 23.05 is a preferred target, but it is possible that cycle wave II may be deeper than this.
Although this wave count is named an alternate, it has about an even probability with the main wave count above.
SECOND ALTERNATE DAILY CHART
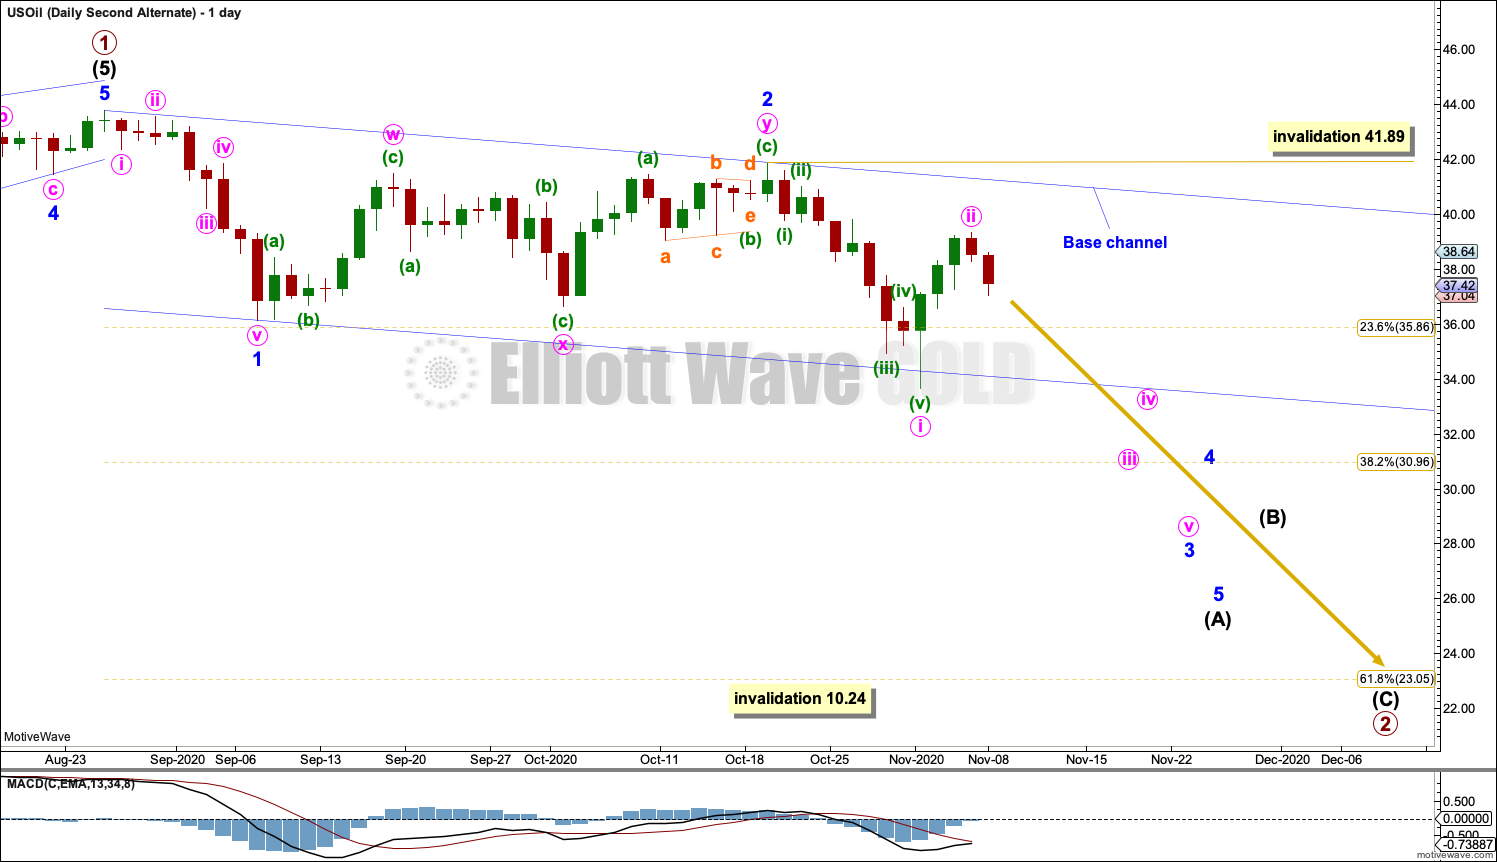
Click chart to enlarge.
It is also possible that the degree of labelling at the daily chart level may need to be changed back down one degree. It may be that only primary wave 1 is complete within cycle wave I and the current pullback may be primary wave 2.
Primary wave 2 may last several weeks to a few months.
TECHNICAL ANALYSIS
WEEKLY CHART
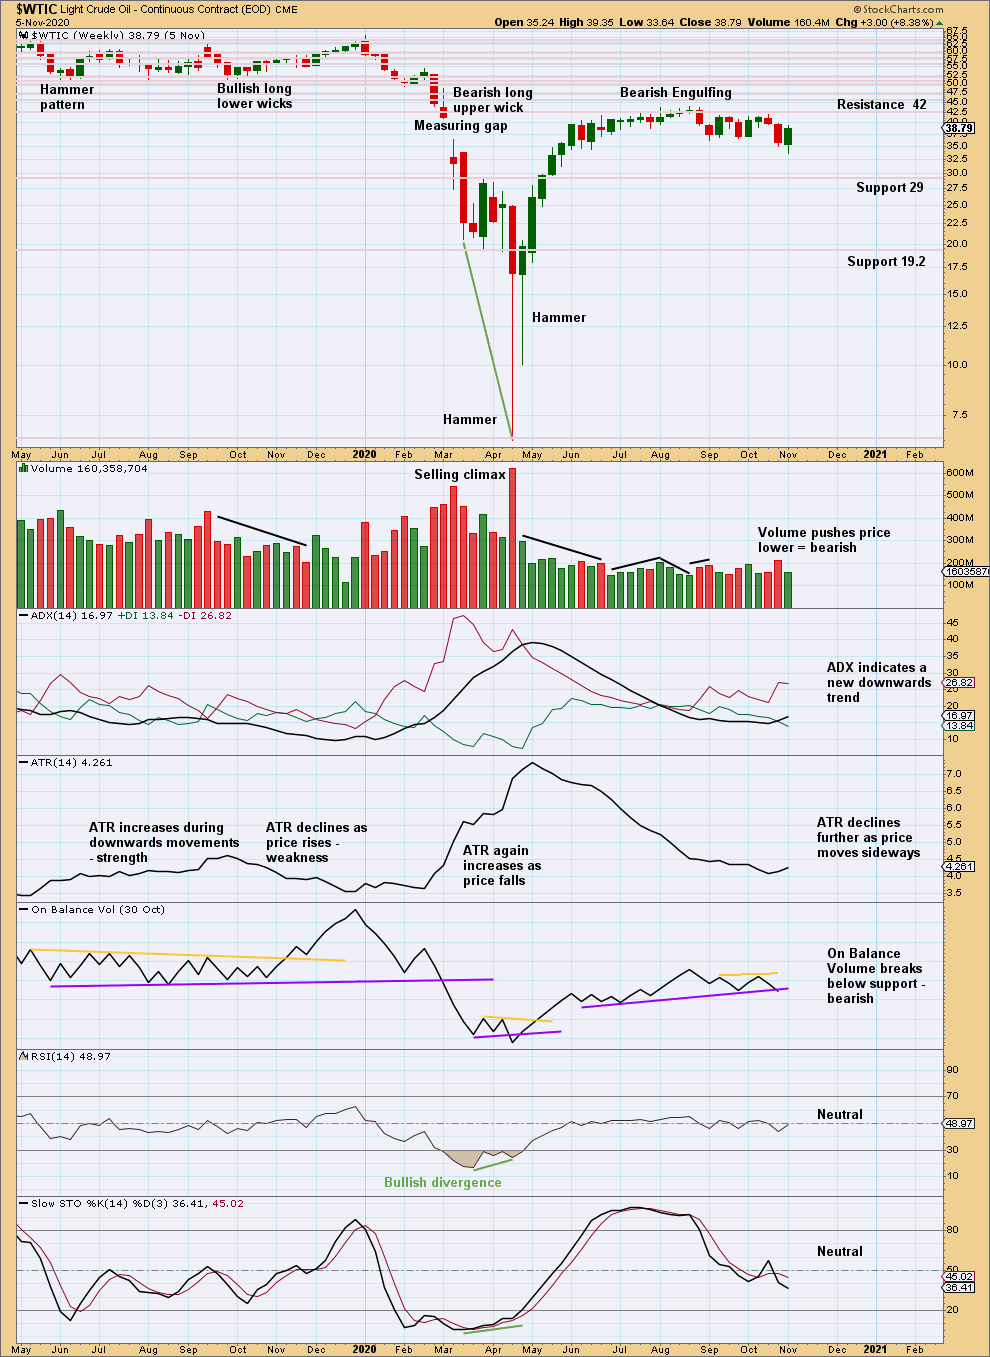
Click chart to enlarge. Chart courtesy of StockCharts.com.
Price is back to within the prior consolidation zone. The short-term volume profile is bearish.
On Balance Volume may turn up this week when Friday’s data is finalised. That would negate the bearish signal from last week.
DAILY CHART
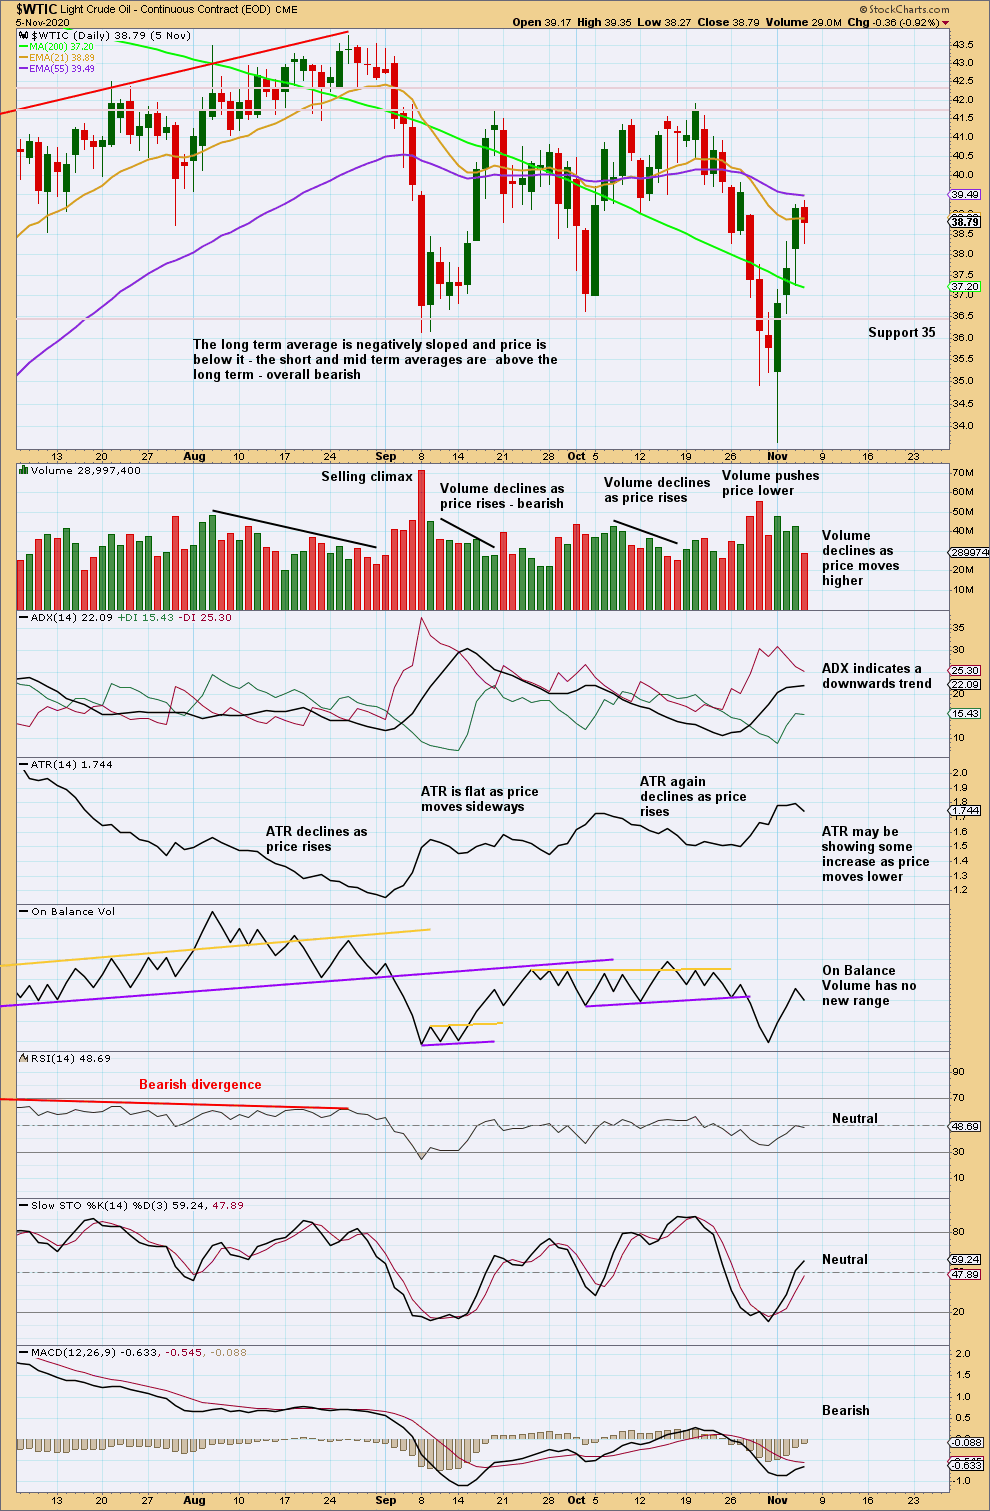
Click chart to enlarge. Chart courtesy of StockCharts.com.
The short-term volume profile is bearish. This bounce looks like a counter trend movement.
Published @ 05:38 p.m. ET.
—
Careful risk management protects your trading account(s).
Follow my two Golden Rules:
1. Always trade with stops.
2. Risk only 1-5% of equity on any one trade.
—
New updates to this analysis are in bold.