
US OIL: Elliott Wave and Technical Analysis | Charts – November 20, 2020
Upwards movement for this week remains below the short-term invalidation point and within a channel.
The Elliott wave count remains the same.
Summary: Downwards movement may overall continue lower. In a downwards trend bounces may be opportunities.
A multi-week pullback is expected to end about 23.05. It is possible the pullback may be deeper than this though; the first major correction within a new trend for Oil tends to be very deep.
When this pullback may be complete, then an upwards trend should resume with increased strength.
Oil may have found a major sustainable low in April 2020.
ELLIOTT WAVE COUNT
MONTHLY CHART
Click chart to enlarge.
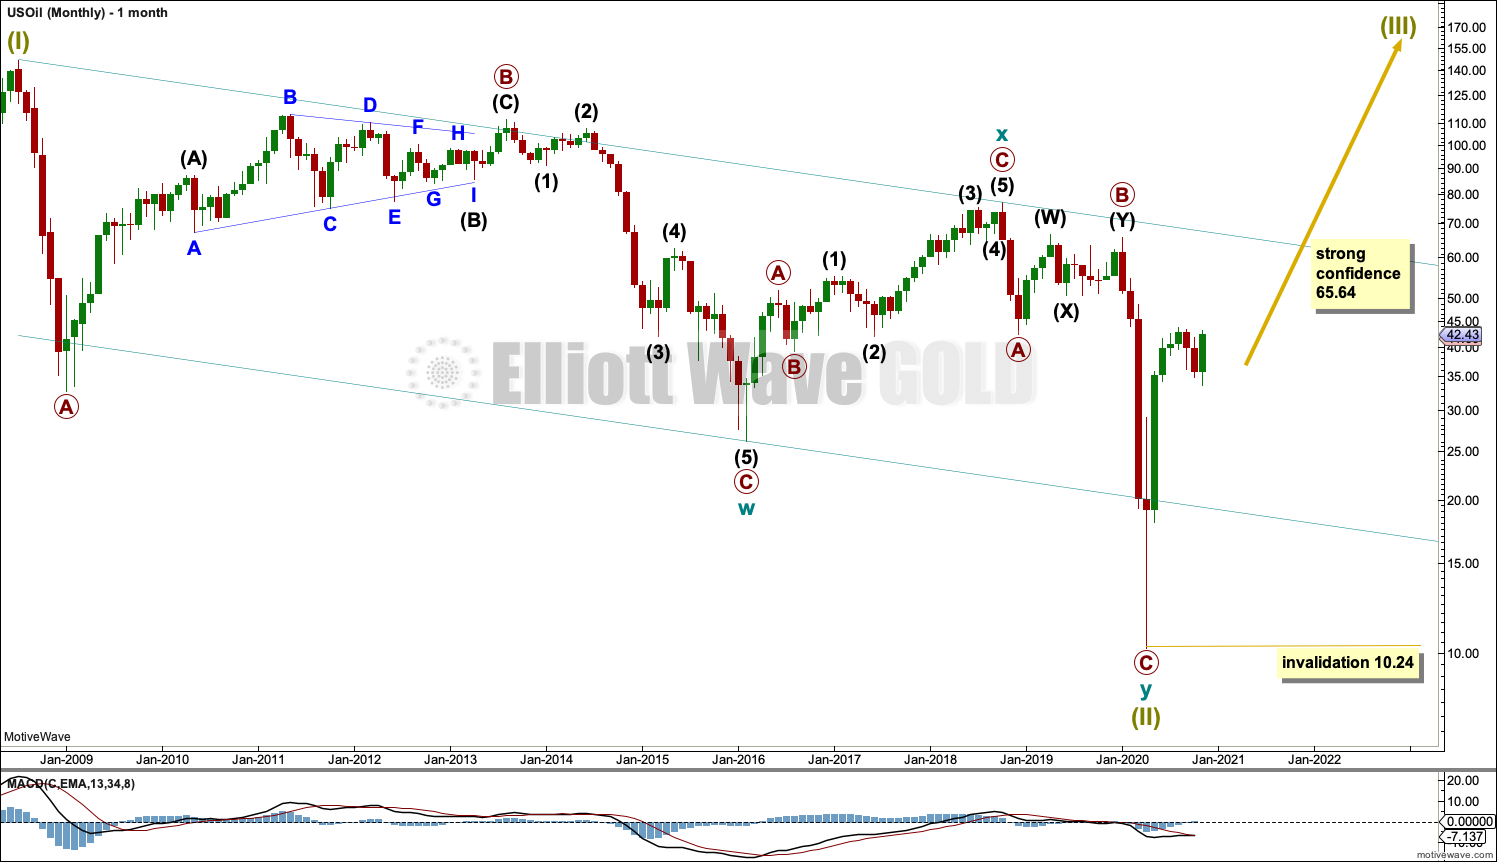
The basic Elliott wave structure is five steps forward and three steps back. This Elliott wave count expects that US Oil has completed a three steps back pattern, which began in July 2008. The Elliott wave count expects that the bear market for US Oil may now be over.
A channel is drawn about Super Cycle wave (II): draw the first trend line from the start of cycle wave w to the end of cycle wave x, then place a parallel copy on the end of cycle wave w. Price has bounced up off the channel. This trend line is breached, which is a typical look for the end of a movement for a commodity.
The upper edge of the channel may provide resistance.
Following five waves up and three steps back should be another five steps up; this is labelled Super Cycle wave (III), which may only have just begun. Super Cycle wave (III) may last a generation and must make a new high above the end of Super Cycle wave (I) at 146.73.
Super Cycle wave (III) may only subdivide as a five wave impulse. New trends for Oil usually start out very slowly with short first waves and deep time consuming second wave corrections. Basing action over a few years may now have begun.
WEEKLY CHART
Click chart to enlarge.
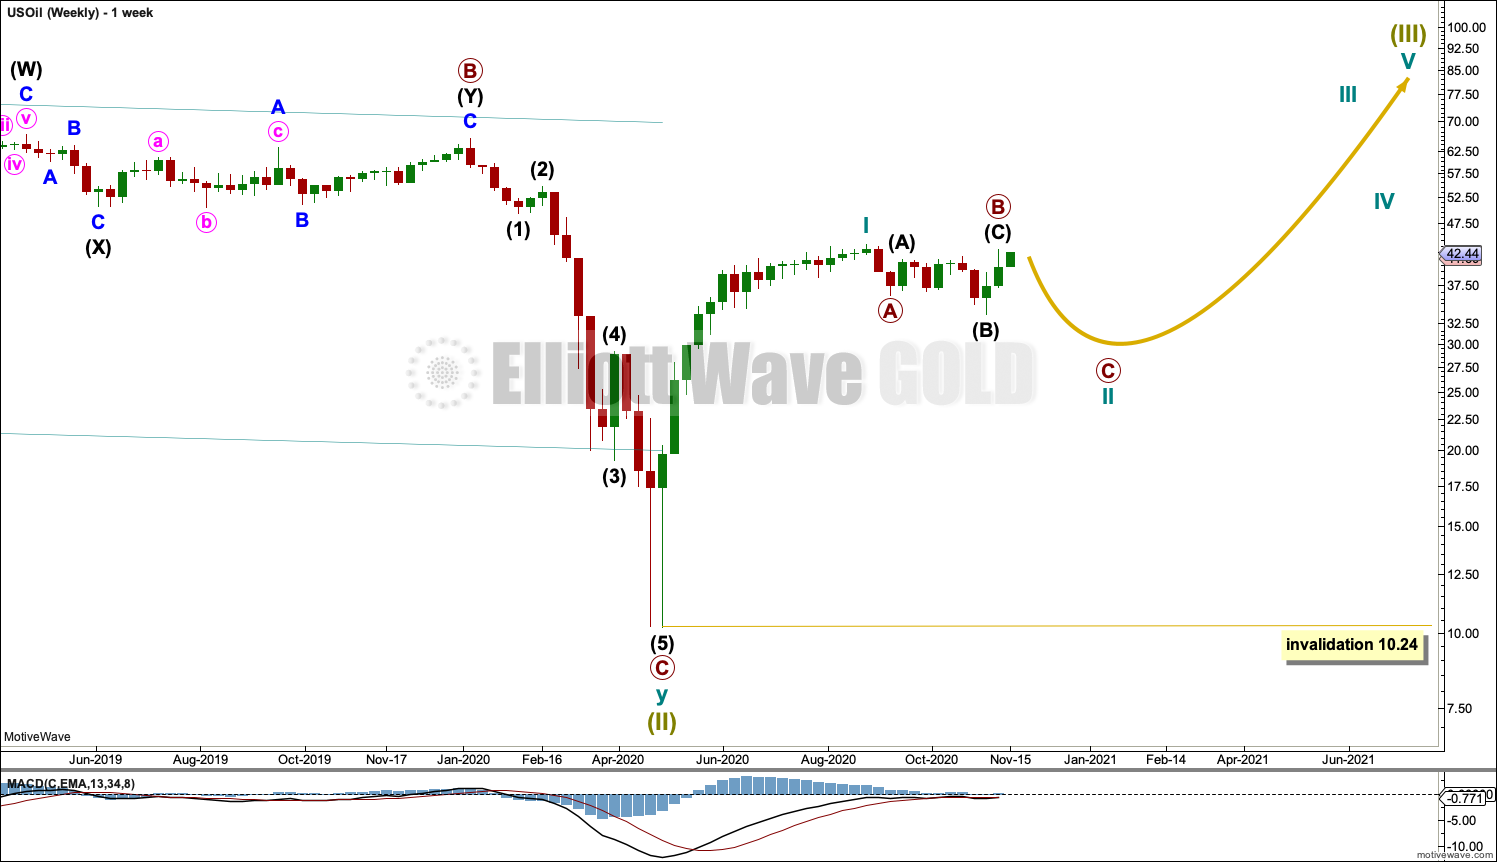
Super Cycle wave (III) must subdivide as an impulse. Cycle wave I within the impulse may be complete. Cycle wave II may not move beyond the start of cycle wave I below 10.24.
DAILY CHART
Click chart to enlarge.
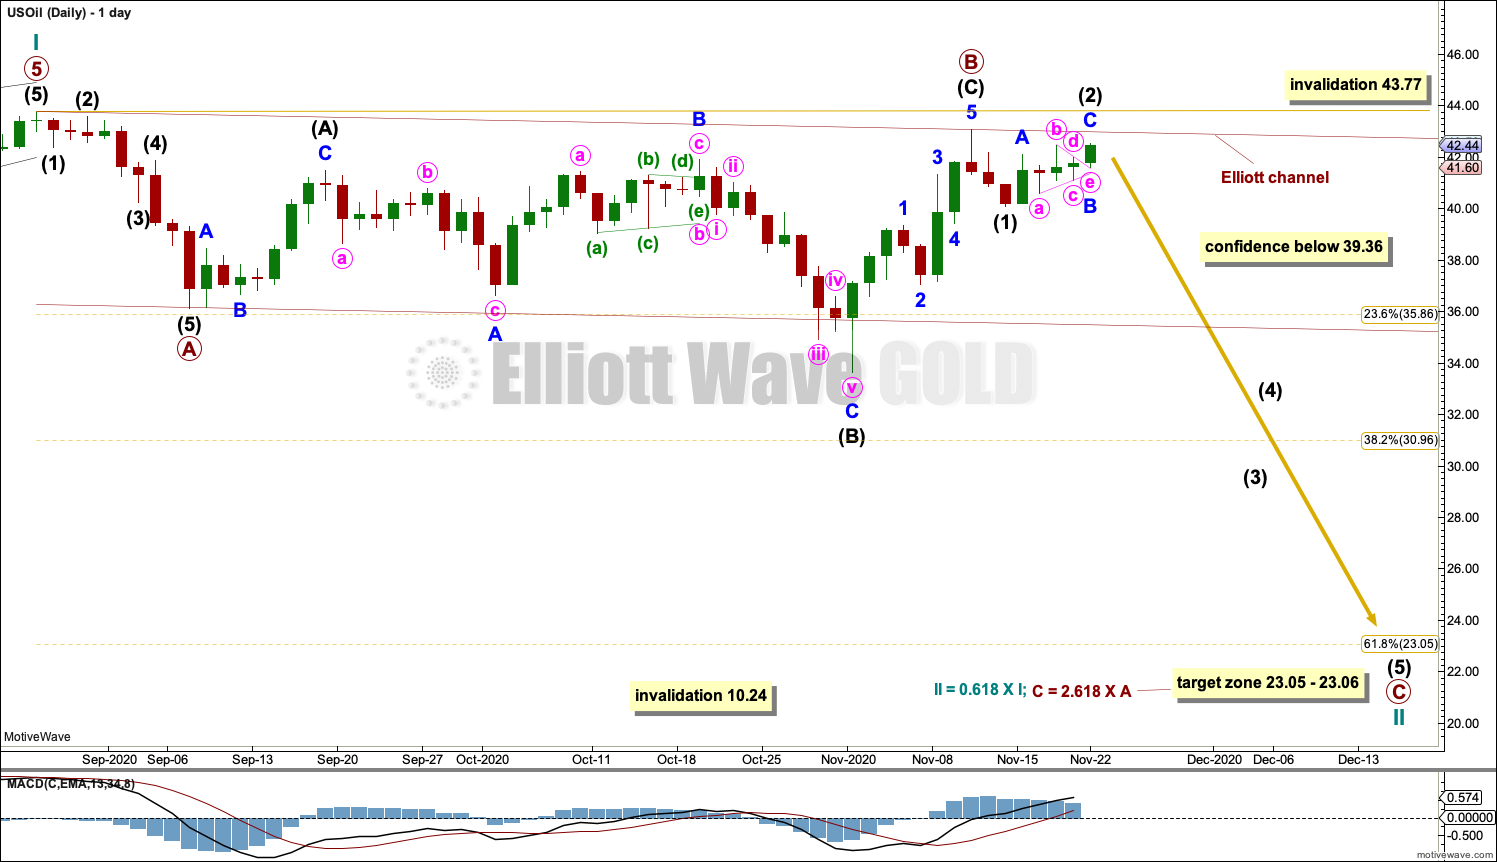
Cycle wave II may subdivide as any corrective Elliott wave structure except a triangle. At this stage, cycle wave II may be an incomplete zigzag that may end close to the 0.618 Fibonaccci ratio.
Primary wave B may have completed as an expanded flat. Within the expanded flat: Intermediate wave (B) is a 1.46 length of intermediate wave (A), which is longer than the maximum common length of up to 1.38 but within an allowable guideline of up to 2, and intermediate wave (C) has moved above the end of intermediate wave (A), avoiding a truncation. Intermediate wave (C) is 0.75 longer than 1.618 times the length of intermediate wave (A).
Within intermediate wave (C): If the structure is not complete (as labelled), then minor wave 4 may not move into minor wave 1 price territory below 39.36. A new low below 39.36 could not be a fourth wave correction within intermediate wave (C), so at that stage intermediate wave (C) should be over. A new low now below 39.36 would for this reason add confidence that primary wave B is over and primary wave C is underway.
If primary wave B continues any higher, then it may mot move beyond the start of primary wave A above 43.77.
Primary wave C downwards may have begun. Primary wave C must subdivide as a five wave motive structure.
Draw a channel about cycle wave II using Elliott’s technique for a correction: draw the first trend line from the start of primary wave A to the end of primary wave B, then place a parallel copy on the end of primary wave A. The upper edge may provide resistance for bounces along the way down. If price breaches the lower edge of this channel, then the first alternate wave count below may be preferred, although C waves may sometimes behave like third waves and breach channels.
Cycle wave II may not move beyond the start of cycle wave I below 10.24.
FIRST ALTERNATE DAILY CHART

Click chart to enlarge.
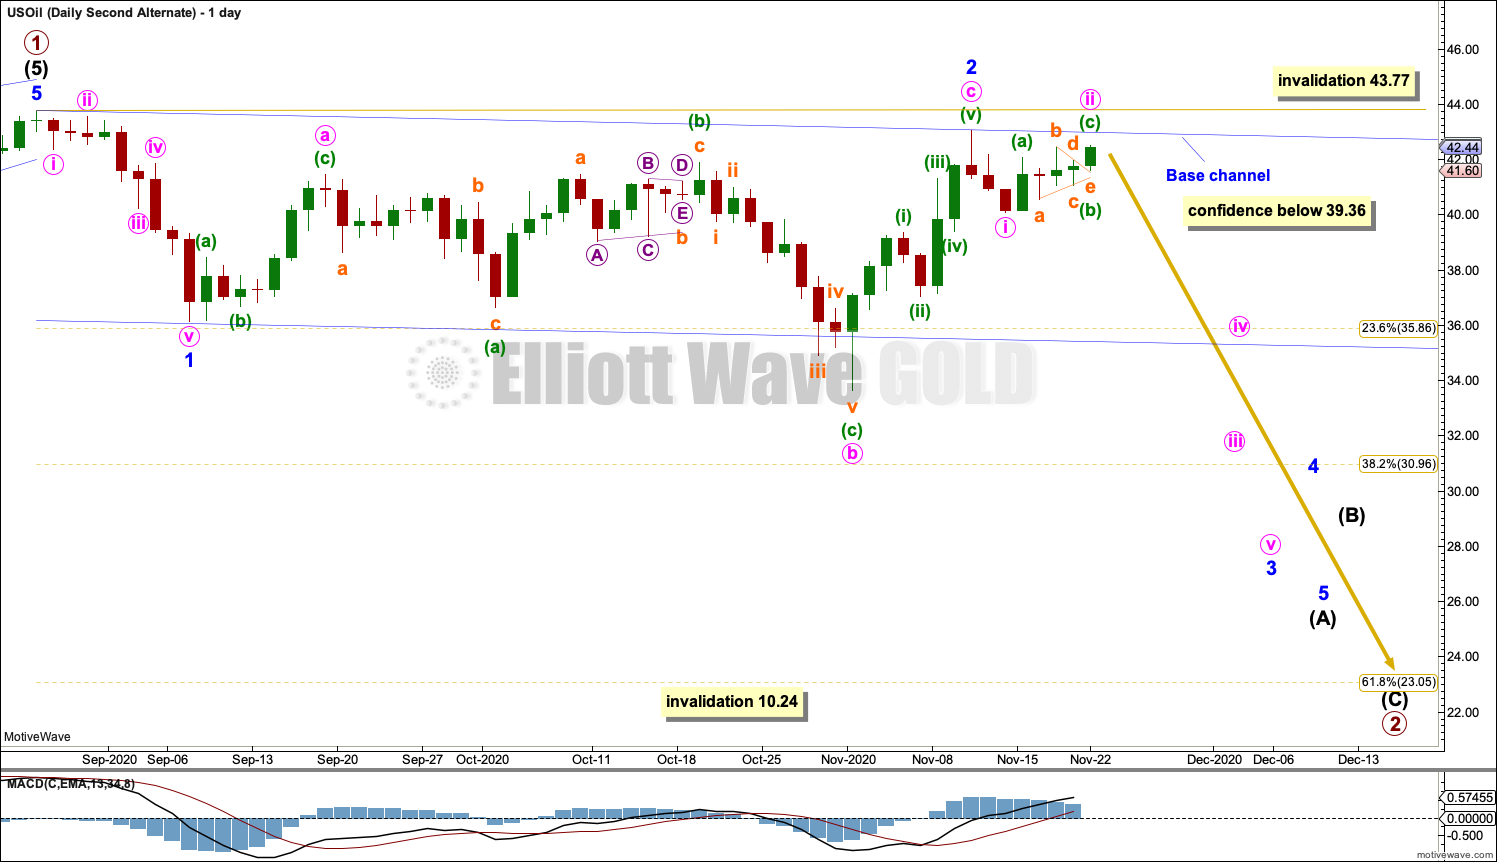
This first alternate wave count moves the degree of labelling within cycle wave II down one degree.
Cycle wave II may be subdividing as a zigzag. Primary wave A within cycle wave II may be an incomplete impulse.
Intermediate wave (2) may be a complete expanded flat.
Intermediate wave (3) within primary wave A may have begun. Intermediate wave (3) may only subdivide as an impulse. If it continues higher, then intermediate wave (2) may not move beyond the start of intermediate wave (1) above 43.77.
39.36 may be used in the same way as described for the main daily wave count.
A target is calculated for intermediate wave (3) that expects a common Fibonacci ratio to intermediate wave (1).
Draw a base channel about intermediate waves (1) and (2): draw the first trend line from the start of intermediate wave (1) to the end of intermediate wave (2), then place a parallel copy on the end of intermediate wave (1). The upper edge of the base channel may provide resistance for bounces along the way down. The lower edge of the base channel should be breached by the momentum of intermediate wave (3), and then it may provide resistance.
The 0.618 Fibonacci ratio of cycle wave I at 23.05 is a preferred target, but it is possible that cycle wave II may be deeper than this.
Although this wave count is named an alternate, it has about an even probability with the main wave count above.
SECOND ALTERNATE DAILY CHART
Click chart to enlarge.
It is also possible that the degree of labelling at the daily chart level may need to be changed back down one degree. It may be that only primary wave 1 is complete within cycle wave I and the current pullback may be primary wave 2.
Primary wave 2 may last several weeks to a few months.
TECHNICAL ANALYSIS
WEEKLY CHART

Click chart to enlarge. Chart courtesy of StockCharts.com.
Price is back to within the prior consolidation zone.
On Balance Volume is also range bound.
The short-term volume profile is now more bearish. The signal from On Balance Volume is weak.
DAILY CHART
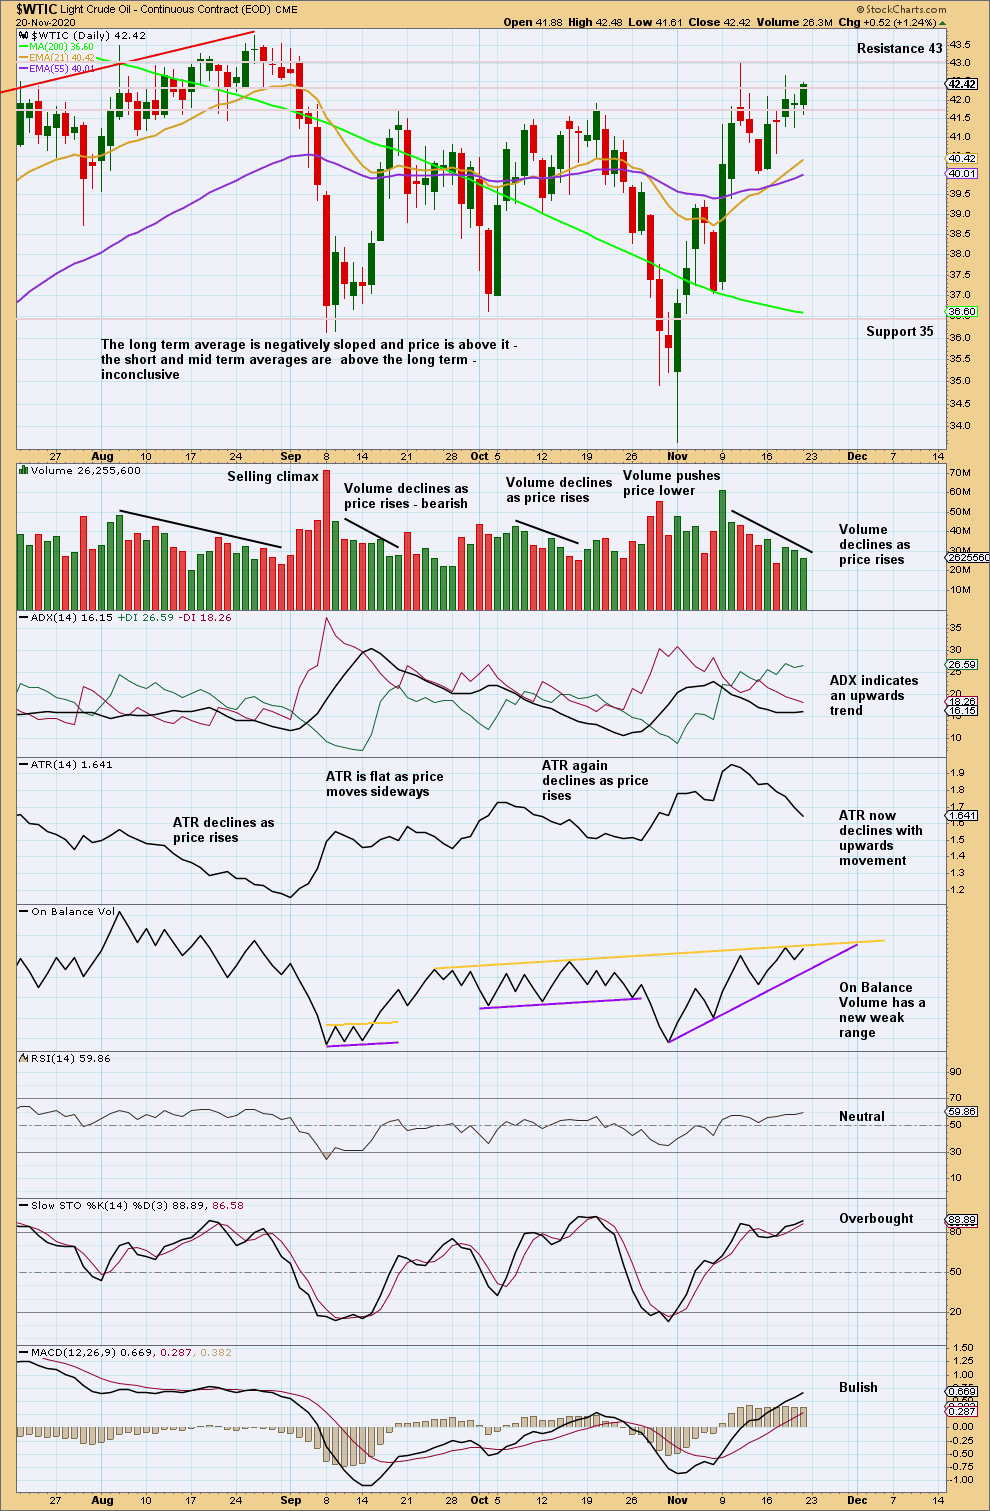
Click chart to enlarge. Chart courtesy of StockCharts.com.
Price has been swinging from resistance to support and back again, with resistance about 41.6 – 42.4 and support about 35, with overshoots. An upwards swing may have just ended; price reached resistance, and Stochastics reached overbought. Now price is turning down. A downwards swing to support is still a reasonable expectation here.
When price is consolidating, then it is typical for swings to be especially choppy and overlapping. Resistance and support may be overshot before price returns to within the consolidation. It is for these reasons that trading consolidations involves increased risk.
At this stage, upwards movement this week looks weak with declining volume and ATR, and price and On Balance Volume at resistance. This supports the Elliott wave counts.
Published @ 06:20 p.m. ET.
—
Careful risk management protects your trading account(s).
Follow my two Golden Rules:
1. Always trade with stops.
2. Risk only 1-5% of equity on any one trade.
—
New updates to this analysis are in bold.