
SILVER: Elliott Wave and Technical Analysis | Charts – December 31, 2020
An inside week leaves this analysis unchanged.
Volume suggests the main Elliott wave count may be more likely.
Summary: The downwards trend may continue. A new Elliott wave target is at 11.37 for the mid term.
The first wave count allows for new lows below 11.703. The final target is at 7.41.
The second wave count expects new highs substantially above 49.752 in coming years. For the mid term, a deep pullback may continue, which may end about 18.605. This wave count would be invalidated with a new low below 11.703.
A new bullish alternate for the second bullish wave count considers the possibility that the bull market has resumed for Silver. It has a mid-term target at 28.747 and a long-term target at 50.98. This wave count would have confidence above 29.772.
ELLIOTT WAVE COUNTS
FIRST ELLIOTT WAVE COUNT
MONTHLY CHART
Click chart to enlarge.
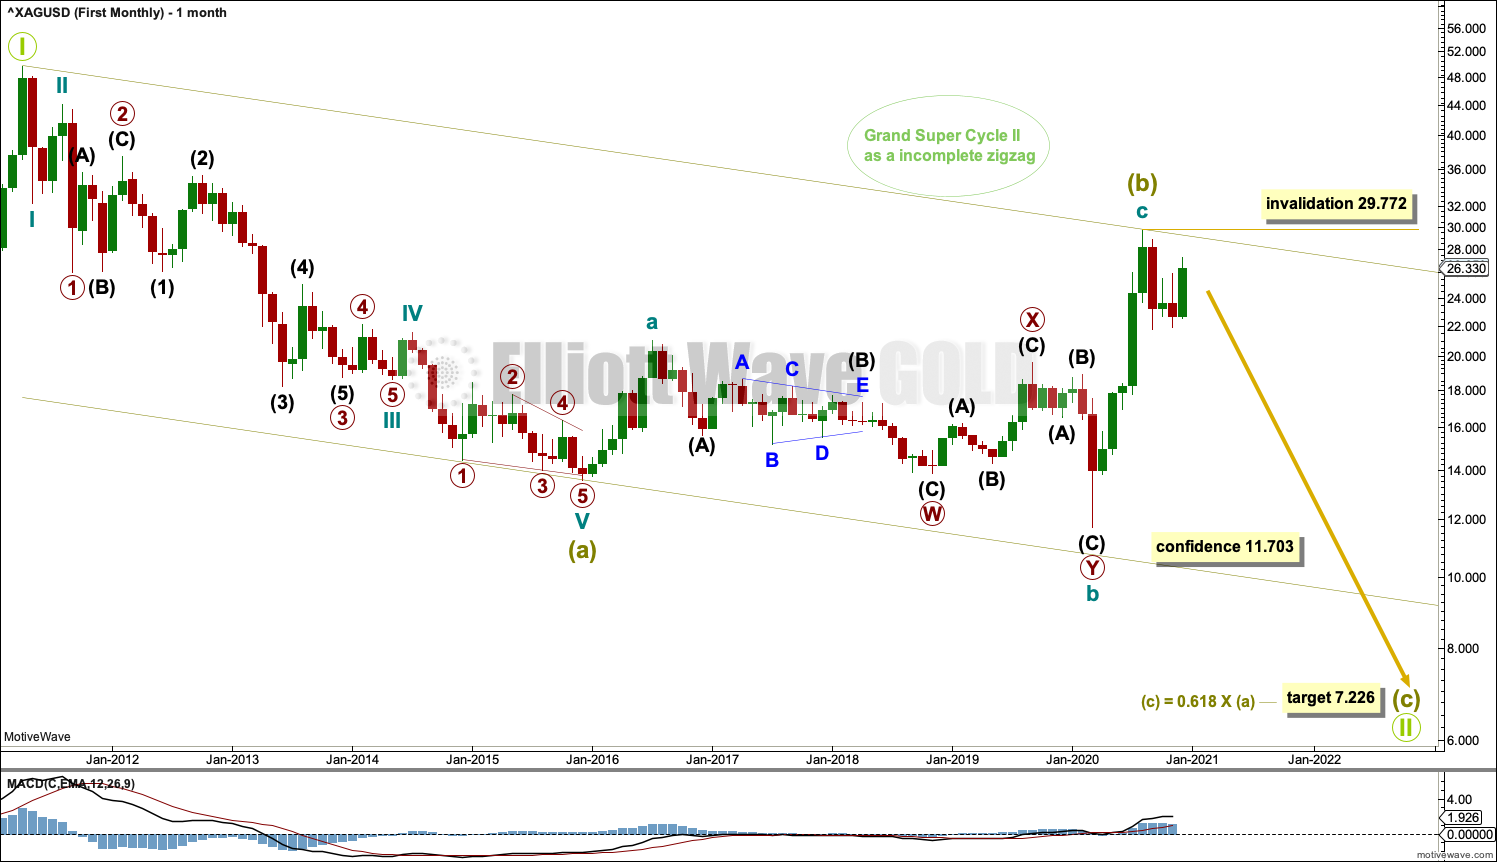
This first wave count has a better look in terms of Elliott wave structures. It may have a slightly higher probability. This is in line with the first wave count for Gold (overall).
It is possible that the zigzag for Grand Super Cycle wave II may be incomplete. Super Cycle wave (b) may have completed as an expanded flat correction.
Cycle wave b within the expanded flat of Super Cycle wave (b) is a 1.25 length of cycle wave a. This is within the most common range for B waves within flats of up to 1.38 times their counterpart A wave.
Cycle wave b within Super Cycle wave (b) subdivides as a double zigzag. This is a very common Elliott wave corrective structure, particularly in a B wave position. This part of the wave count has an excellent fit; all subdivisions are correct and the structures are common. This resolves the problem that the second wave count has of the triangle trend lines not being strictly adhered to.
A target is calculated for Super Cycle wave (c).
WEEKLY CHART
Click chart to enlarge.
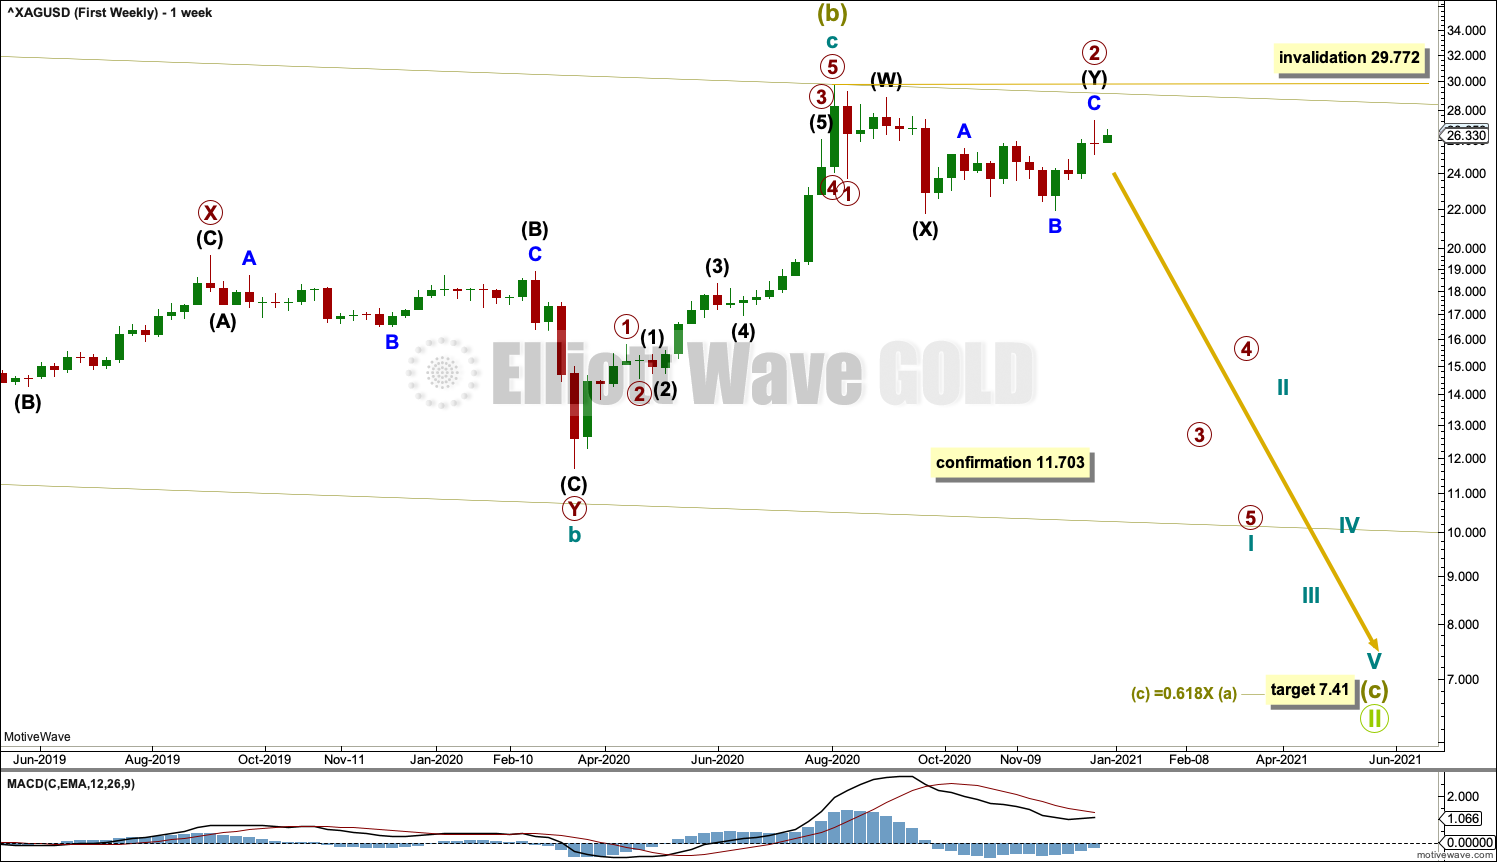
Super Cycle wave (c) must subdivide as a five wave structure, most likely an impulse. Cycle wave I within Super Cycle wave (c) may have begun.
Cycle wave II may not move beyond the start of cycle wave I above 29.772.
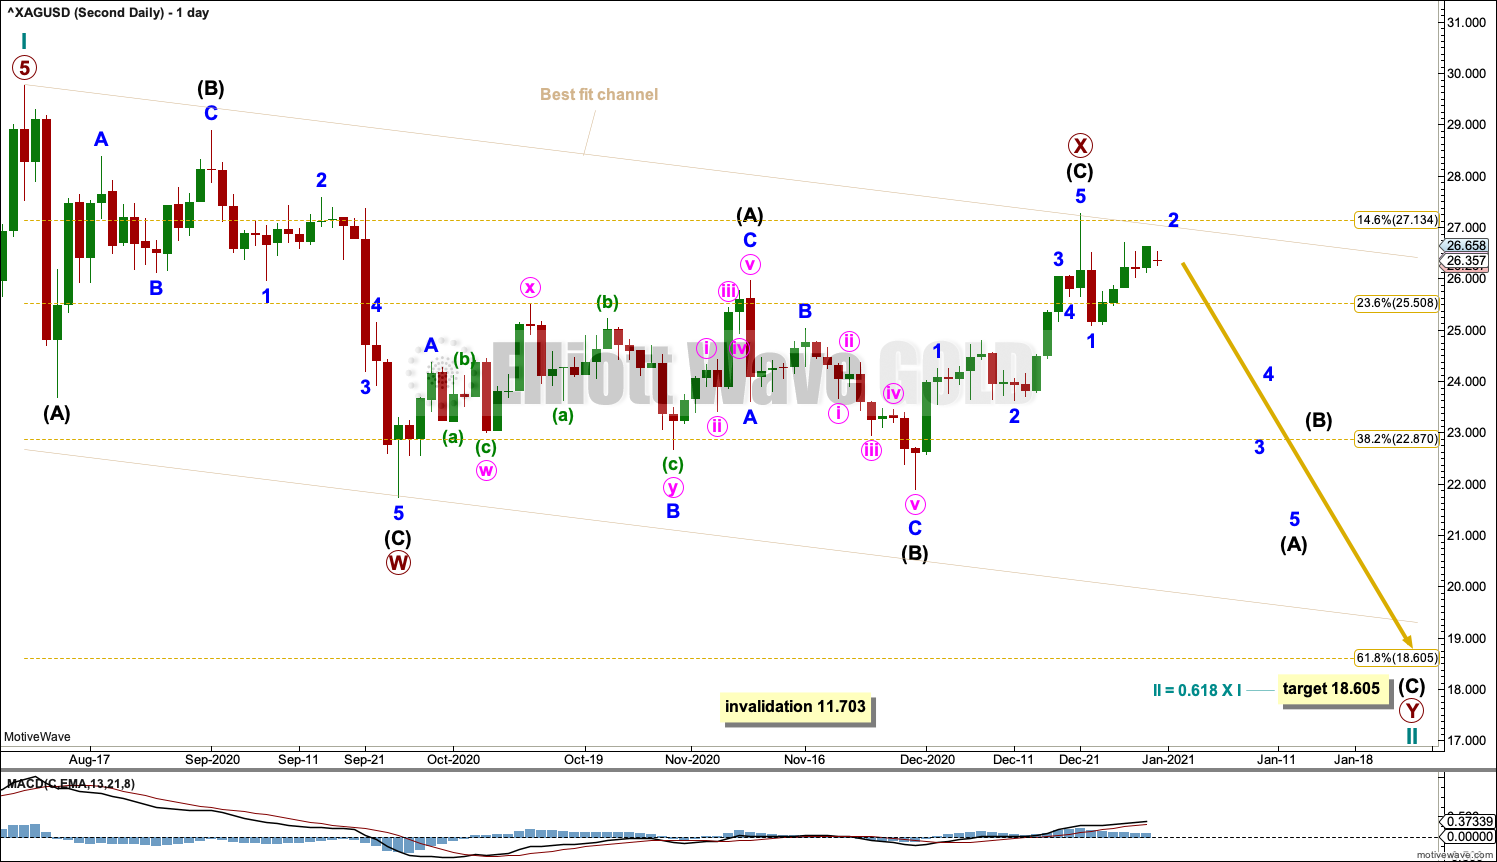
DAILY CHART

Click chart to enlarge.
Cycle wave I must subdivide as a five wave structure, most likely an impulse.
A new downwards trend may have begun.
Primary wave 2 may be complete as a double combination. The first structure in the double may be a zigzag, labelled intermediate wave (W). The double may be joined by a completed three in the opposite direction, a zigzag labelled intermediate wave (X). The second structure in the double may now be a completed regular flat, labelled intermediate wave (Y). If primary wave 2 continues higher, then it may not move beyond the start of primary wave1 above 29.772.
Primary wave 3 may have begun.
SECOND ELLIOTT WAVE COUNT
MONTHLY CHART
Click chart to enlarge.
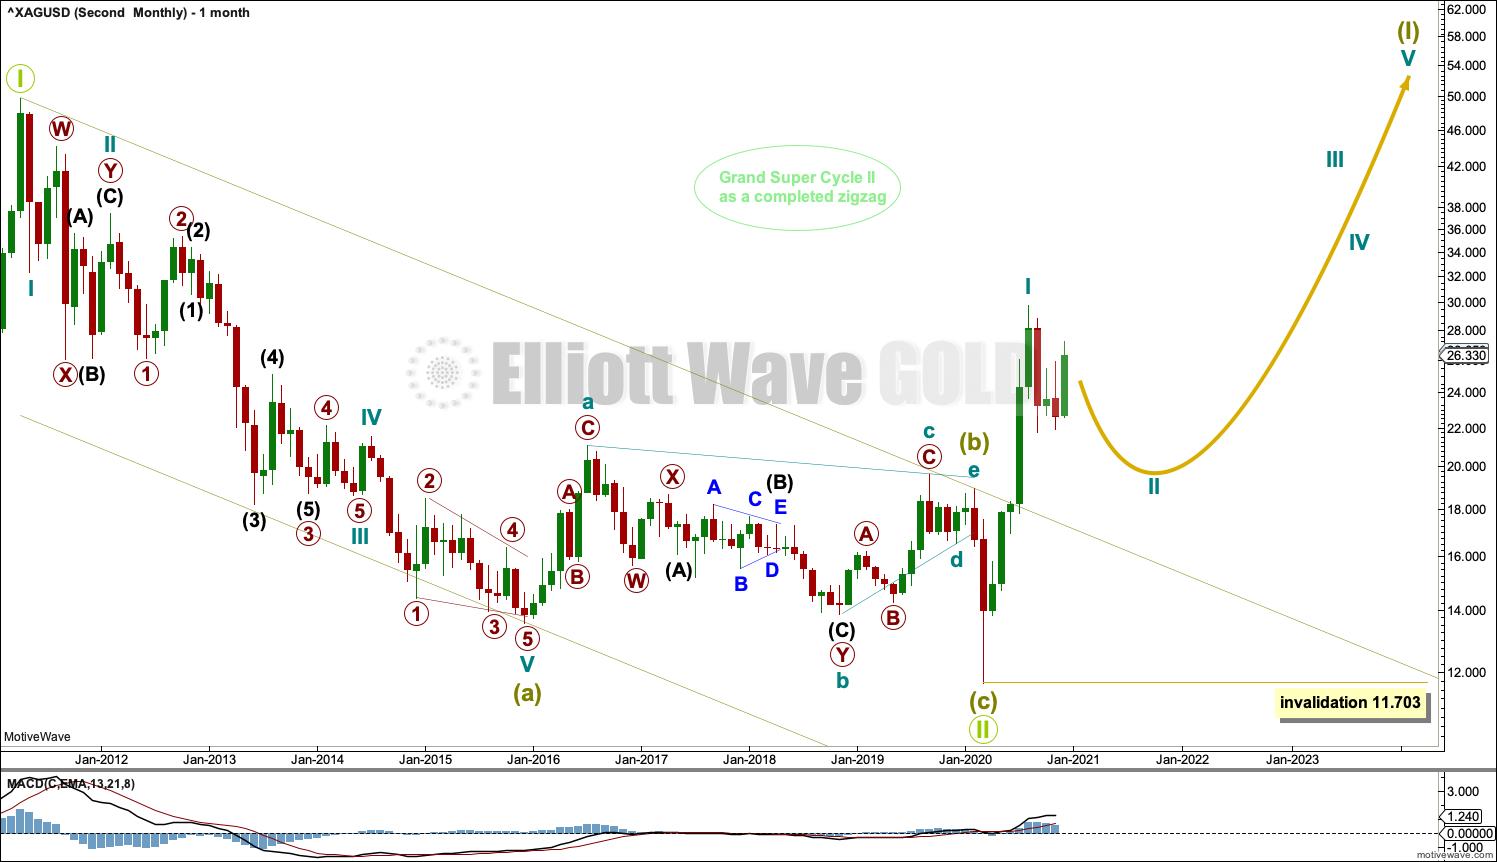
The bear market for Silver may be complete.
This Elliott wave structure for this bear market is labelled as a single zigzag for Grand Super Cycle wave II. Single zigzags are the most common Elliott wave corrective structure.
Within the zigzag: Super Cycle wave (a) subdivides as a five wave impulse, Super Cycle wave (b) subdivides as a complete regular contracting triangle, and Super Cycle wave (c) subdivides as a complete five wave impulse that is relatively brief and shallow.
Elliott wave triangles normally adhere strictly to their trend lines. The triangle for Super Cycle wave (b) does not; the lower b-d trend line is overshot, which reduces the probability of this wave count and is one reason for publication of the first wave count.
When charts are drawn on a semi-log scale, price has now breached the upper edge of the trend channel. Copy this channel over to weekly and daily charts. The upper edge of this channel may now provide support.
Grand Super Cycle wave III must subdivide as a five wave impulse at Super Cycle degree.
WEEKLY CHART
Click chart to enlarge.
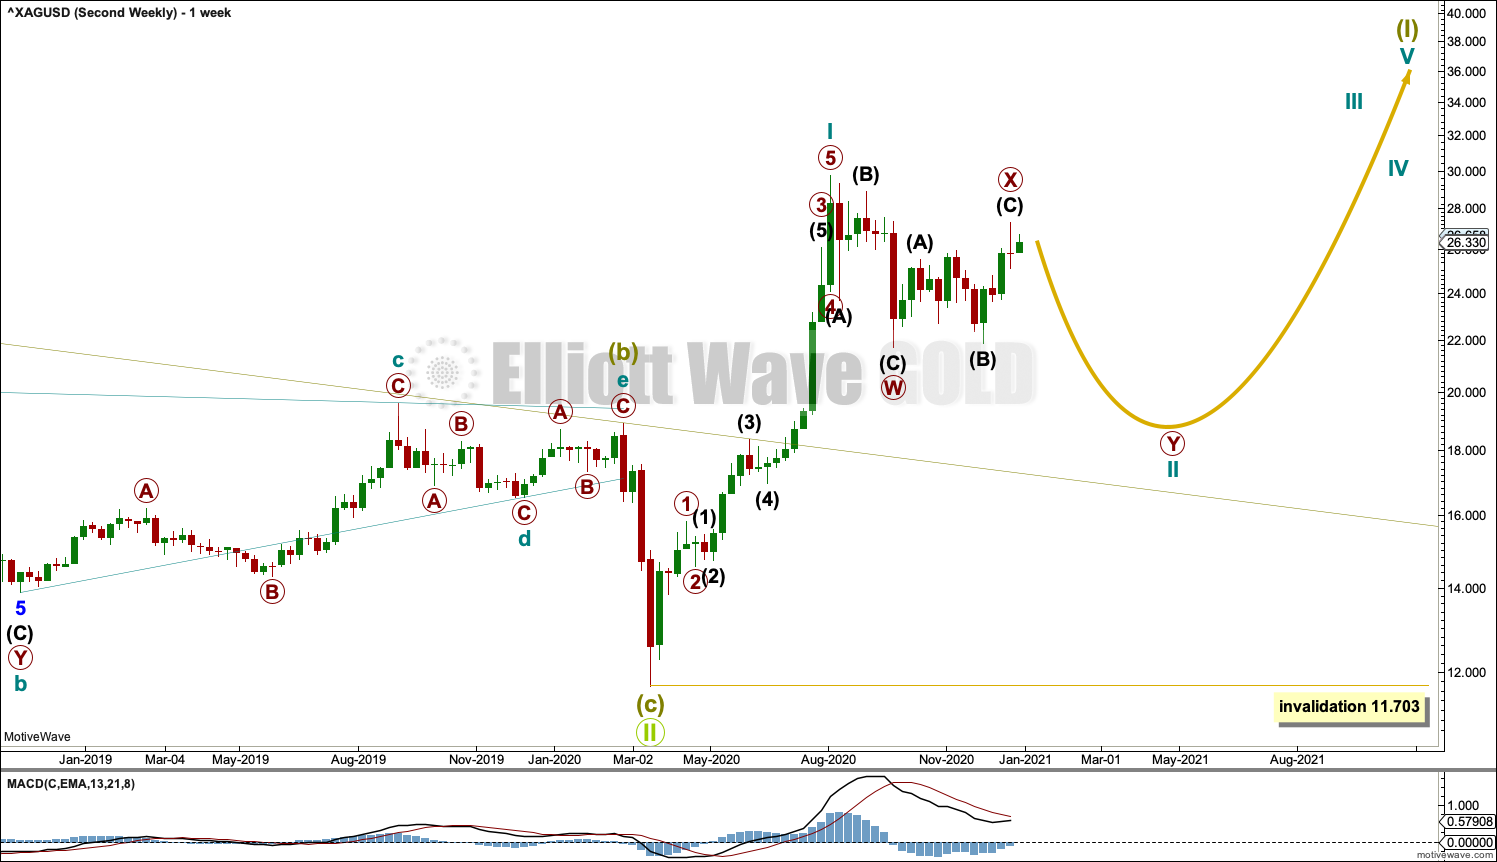
Grand Super Cycle wave II may be a complete zigzag. A new bull market may have begun for Silver.
The channel about Grand Super Cycle wave II is copied over from the monthly chart and extended outwards.
Super Cycle wave (I) may subdivide as an impulse or a leading diagonal. An impulse is much more common, so that is what shall be expected unless overlapping suggests a diagonal should be considered.
Cycle wave II may not move beyond the start of cycle wave I below 11.703.
DAILY CHART
Click chart to enlarge.
Cycle wave I may be a complete five wave impulse. Cycle wave II may continue as a multi-month pullback. Cycle wave II may be subdividing as a double zigzag, which is a reasonably common corrective structure. A likely point for cycle wave II to end may be the 0.618 Fibonacci ratio of cycle wave I. If this target is wrong, then it may not be low enough. The first major correction within a new trend is often very deep.
The first zigzag in the double may be complete. It is labelled primary wave W. Primary wave X subdivides as a single zigzag. The second zigzag in the double, labelled primary wave Y, may now continue lower; it would be most likely to move below the end of primary wave W to achieve its purpose of deepening the correction. The target remains the same.
ALTERNATE DAILY CHART
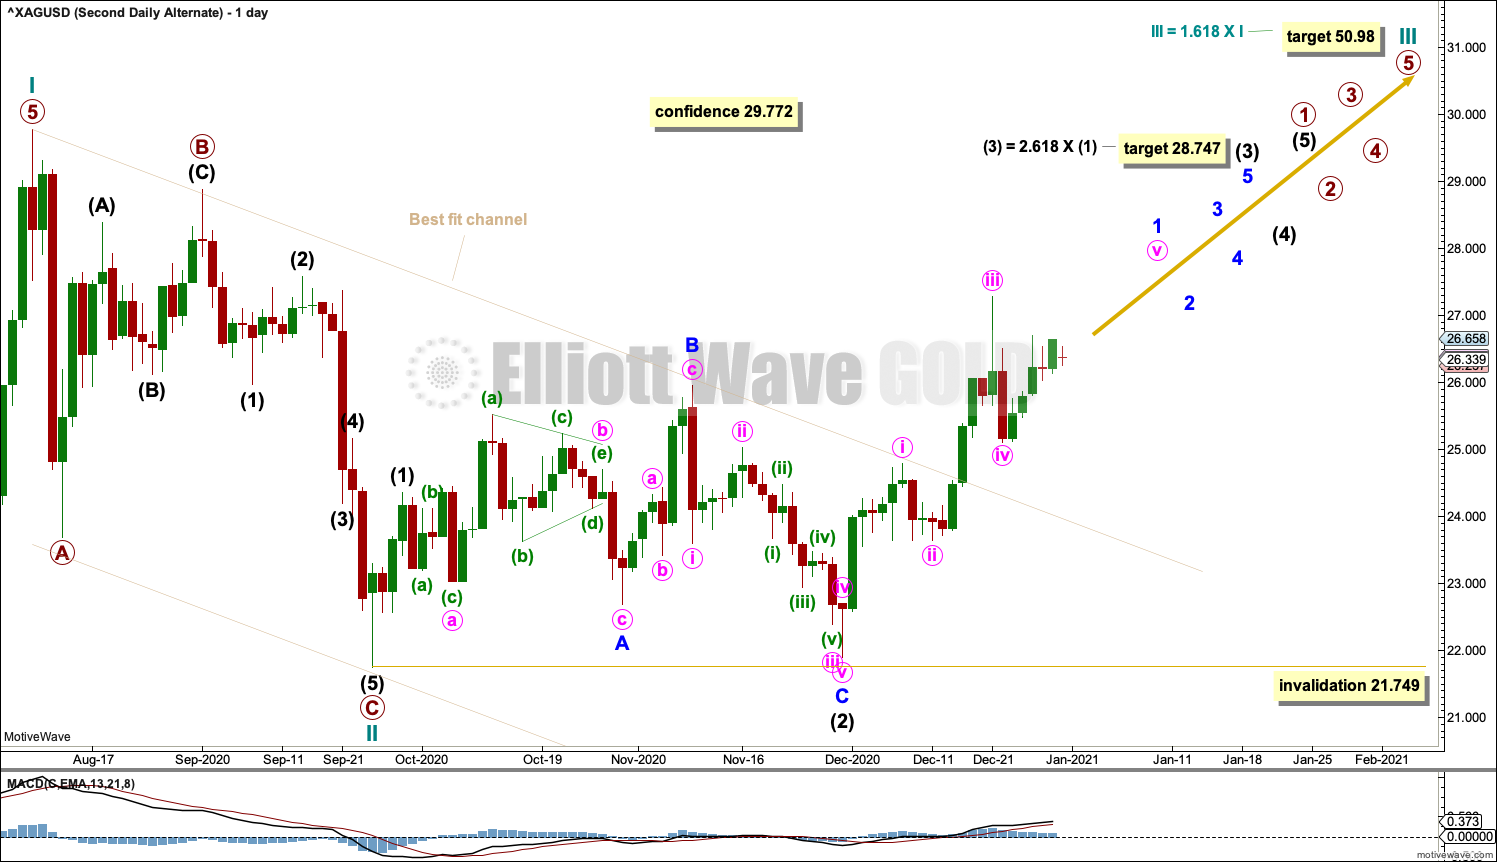
Click chart to enlarge.
If cycle wave II is over, then it would have lasted only 7 weeks to the 20 weeks of cycle wave I, and be only 0.44 the depth of cycle wave I. While this is possible, it is less common than a longer lasting and deeper second wave correction as the first large correction within a new trend. This reduces the probability of this alternate wave count, but low probability does not mean no probability; low probability outcomes do sometimes occur. Confidence in this alternate wave count may be had if the main wave count is invalidated with a new high above 29.772.
Cycle wave III may only subdivide as an impulse. Within the impulse: Intermediate wave 1 may be complete, and intermediate wave (2) may be complete as a very deep expanded flat. A target is calculated for intermediate wave (3) using the 2.618 Fibonacci ratio because intermediate wave (2) was very deep.
When primary wave 1 is complete, then primary wave 2 may not move beyond the start of primary wave 1 below 21.749.
The target for cycle wave III expects it to exhibit a common Fibonacci ratio to cycle wave I.
TECHNICAL ANALYSIS
WEEKLY CHART
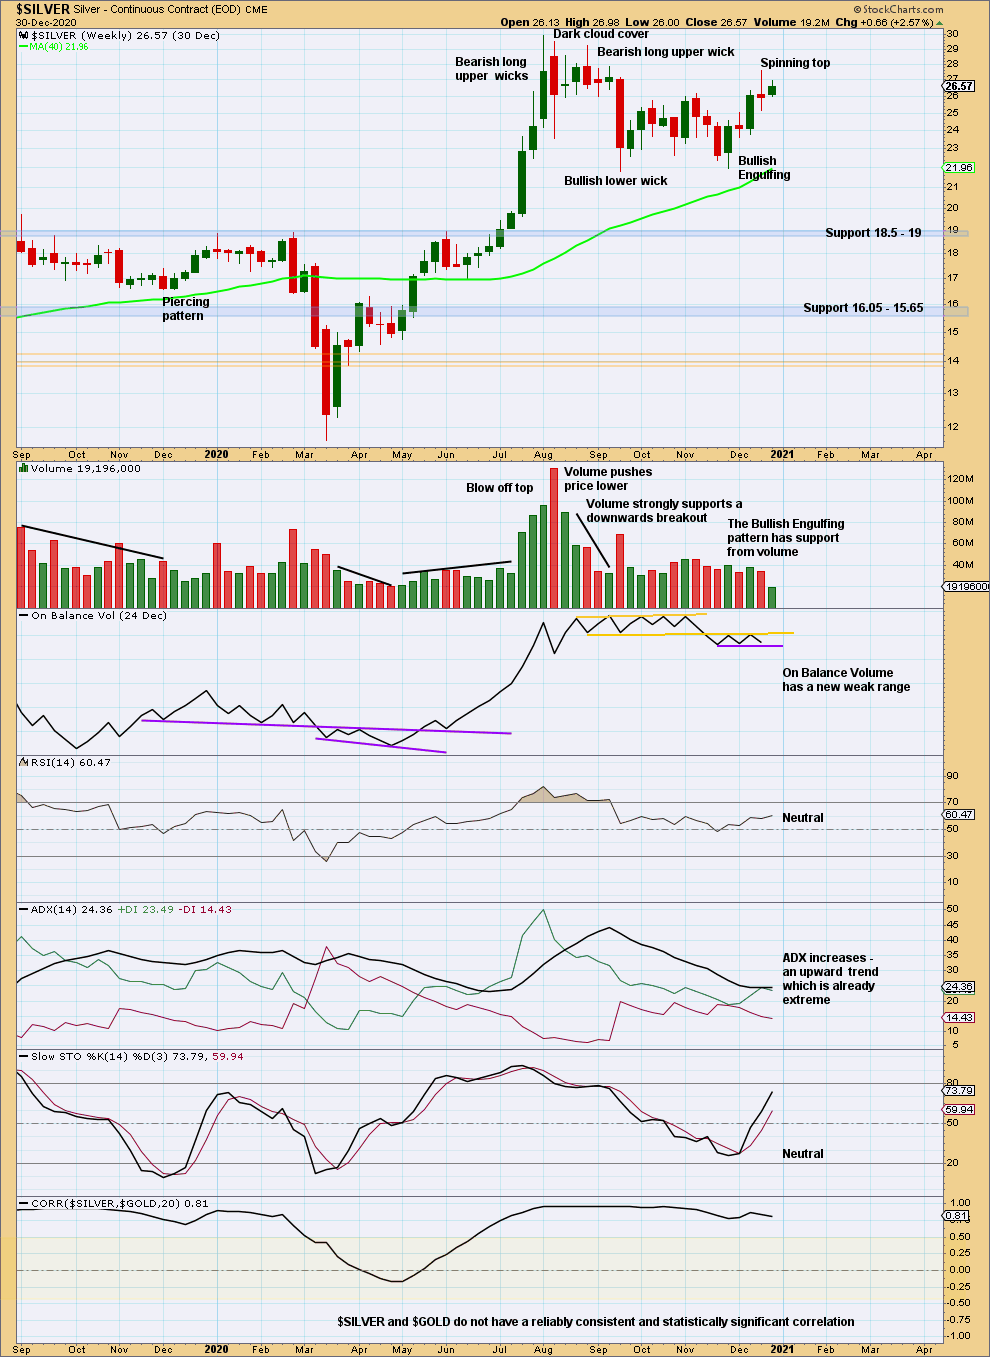
Click chart to enlarge. Chart courtesy of StockCharts.com.
The previous upwards trend reached very extreme and RSI reached deeply overbought. Now a bearish candlestick reversal pattern completes, which has support from volume. This bearish signal should be given weight in these circumstances. Either a 180° reversal or a time consuming consolidation may be expected here.
Downwards and sideways movement following the last high has been long lasting and deep enough to relieve extreme conditions. There is again room for an upwards trend to continue. It remains possible though that a longer-term high is in place.
The current week may close as a small range inside week with light volume. This looks like a small counter trend movement.
DAILY CHART
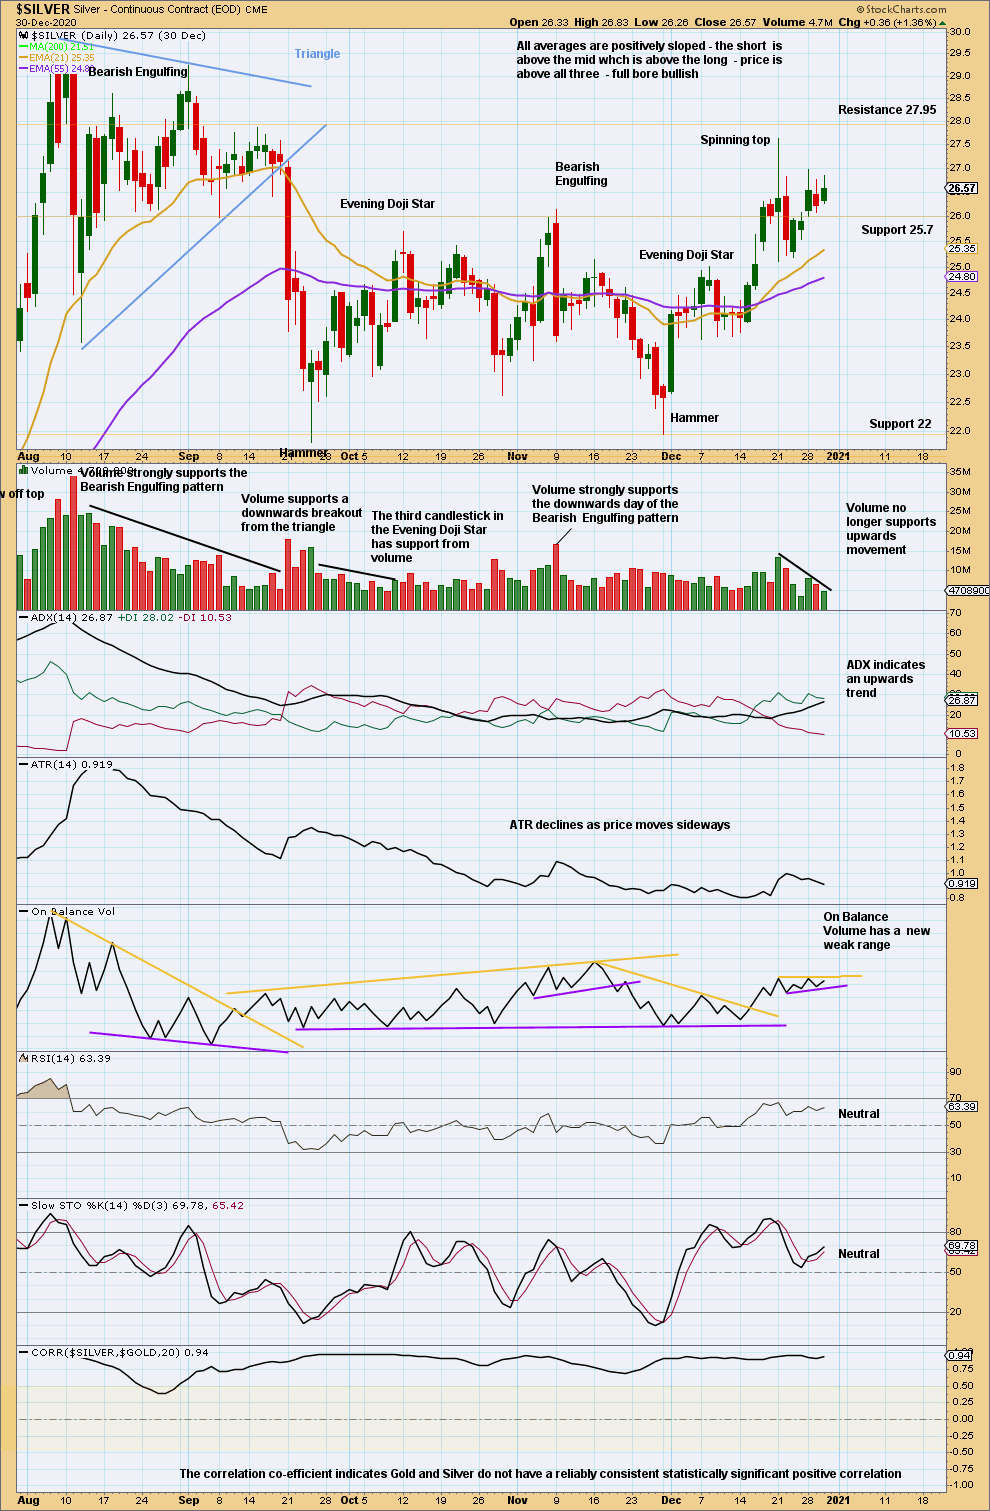
Click chart to enlarge. Chart courtesy of StockCharts.com.
Both price and On Balance Volume this week are range bound. Volume suggests upwards movement may be a counter trend movement.
Published @ 05:20 p.m. ET.
—
Careful risk management protects your trading account(s).
Follow my two Golden Rules:
1. Always trade with stops.
2. Risk only 1-5% of equity on any one trade.
—
New updates to this analysis are in bold.