
US OIL: Elliott Wave and Technical Analysis | Charts – December 4, 2020
Upwards movement has continued this week as the Elliott wave count last week expected.
Summary: An upwards trend may continue. Two targets for a third wave are first at 87.90 and thereafter at 121.43.
Oil may have found a major sustainable low in April 2020.
ELLIOTT WAVE COUNT
MONTHLY CHART
Click chart to enlarge.
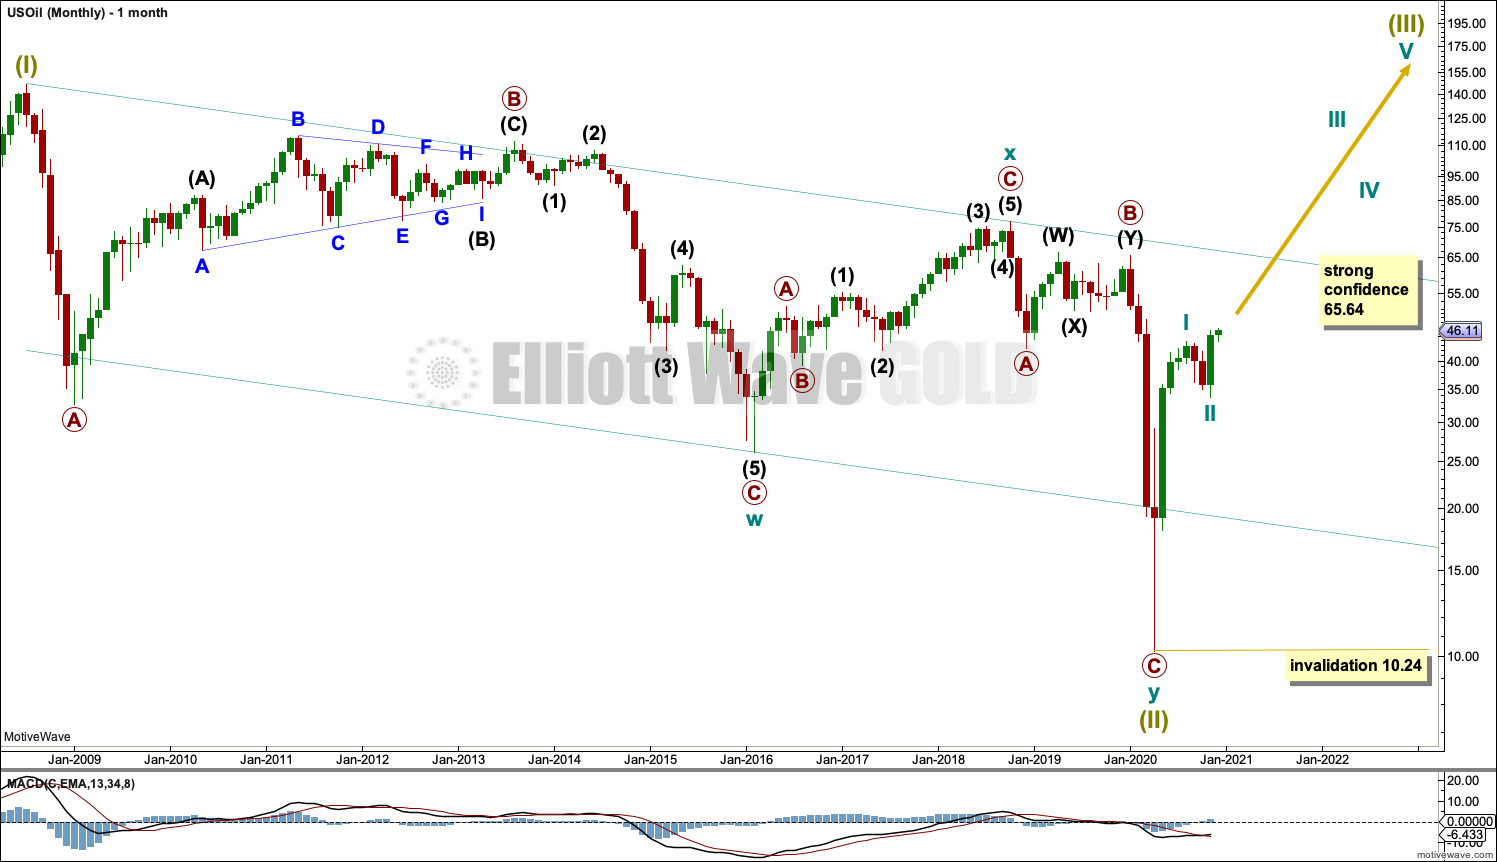
The basic Elliott wave structure is five steps forward and three steps back. This Elliott wave count expects that US Oil has completed a three steps back pattern, which began in July 2008. The Elliott wave count expects that the bear market for US Oil may now be over.
A channel is drawn about Super Cycle wave (II): draw the first trend line from the start of cycle wave w to the end of cycle wave x, then place a parallel copy on the end of cycle wave w. Price has bounced up off the channel. This trend line is breached, which is a typical look for the end of a movement for a commodity.
The upper edge of the channel may provide resistance.
Following five waves up and three steps back should be another five steps up; this is labelled Super Cycle wave (III), which may only have just begun. Super Cycle wave (III) may last a generation and must make a new high above the end of Super Cycle wave (I) at 146.73.
Super Cycle wave (III) may only subdivide as a five wave impulse. New trends for Oil usually start out very slowly with short first waves and deep time consuming second wave corrections. However, while this is a common tendency, it is not always seen and may not have been seen in this instance. The first reasonably sized pullback may be over already.
WEEKLY CHART
Click chart to enlarge.
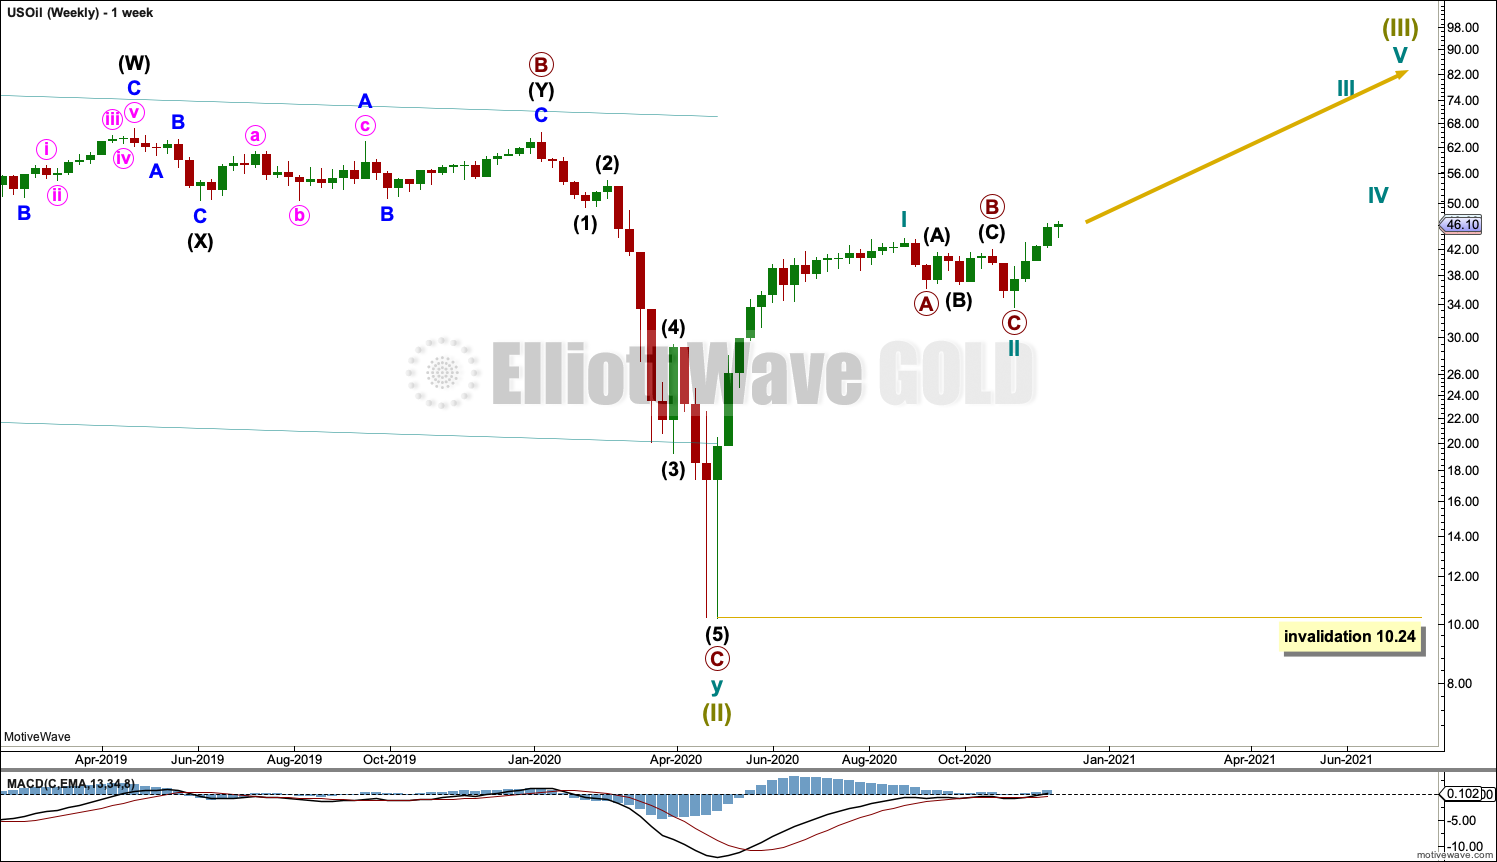
Super Cycle wave (III) must subdivide as an impulse. Cycle wave I within the impulse may be complete. Cycle wave II may also now be complete, and cycle wave III upwards may now have begun. If cycle wave II continues lower, then it may not move beyond the start of cycle wave I below 10.24.
DAILY CHART

Click chart to enlarge.
Cycle wave II may be a complete zigzag and only 0.3 of cycle wave I in depth, which is possible. Classic technical analysis sees strength in upwards movement of this week, which supports this wave count.
Cycle wave III may only subdivide as an impulse. Within the impulse: Primary wave 1 may be incomplete, and primary wave 2 may not move beyond the start of primary wave 1 below 33.65.
FIRST ALTERNATE DAILY CHART
Click chart to enlarge.
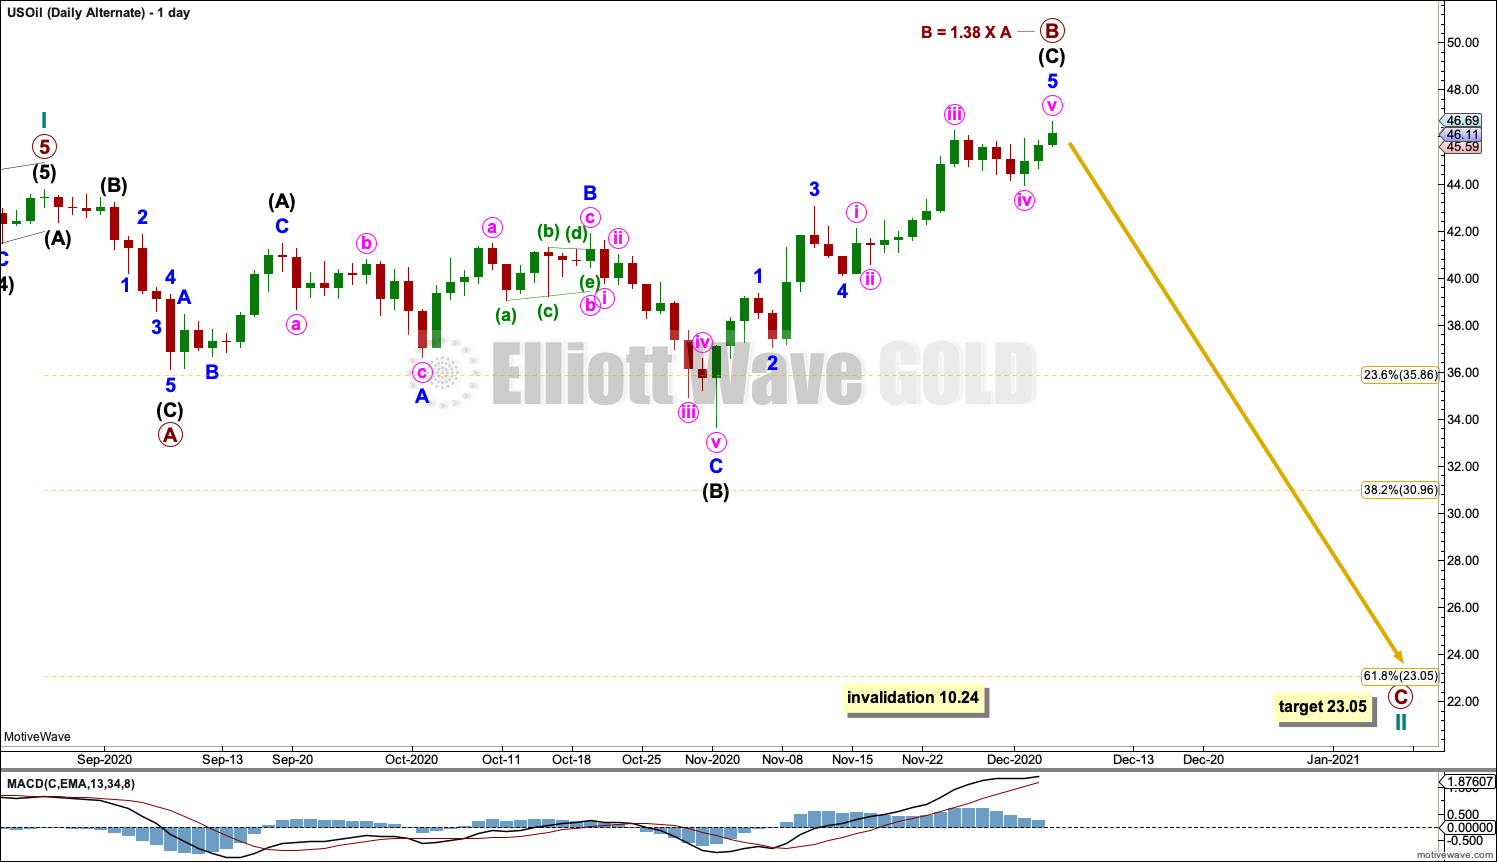
This first alternate wave count moves the degree of labelling within cycle wave II down one degree.
Cycle wave II may be continuing further as an expanded flat. Primary wave B within the expanded flat is now at the edge of the common range to primary wave A of 1 to 1.38.
Primary wave C for this wave count would be extremely likely to move at least slightly below the end of primary wave A at 36.13 to avoid a truncation. Cycle wave II may not move beyond the start of cycle wave I below 10.24.
SECOND ALTERNATE DAILY CHART

Click chart to enlarge.
It is also possible that the degree of labelling at the daily chart level may need to be changed back down one degree. It may be that only primary wave 1 is complete within cycle wave I and the pullback may be primary wave 2.
Primary wave 2 may be complete. A target is calculated for primary wave 3.
TECHNICAL ANALYSIS
WEEKLY CHART
Click chart to enlarge. Chart courtesy of StockCharts.com.
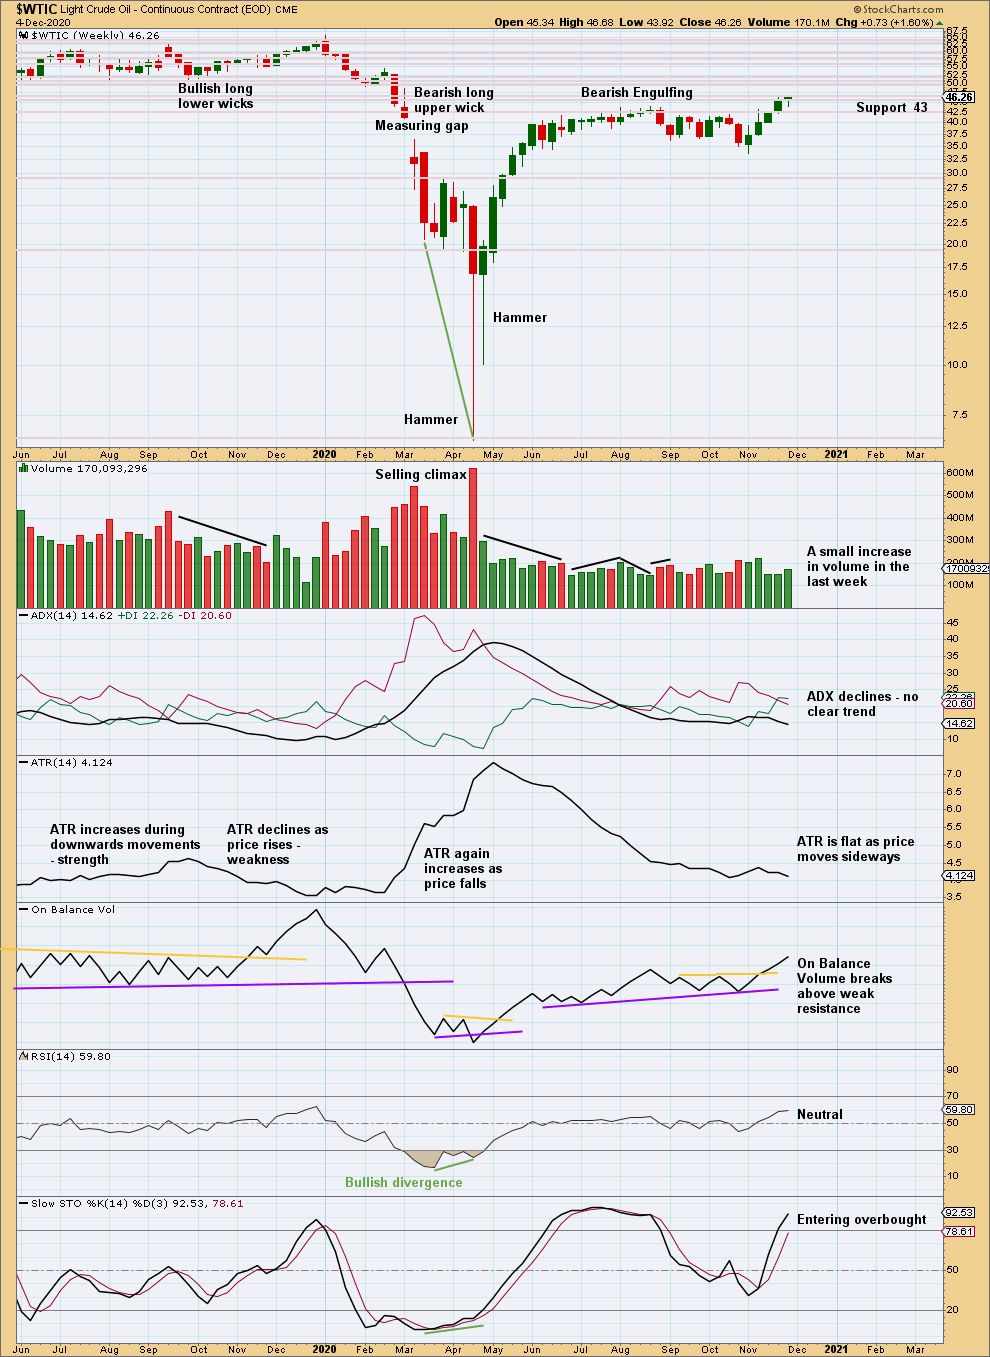
Price is within a cluster of resistance and support; this may slow it down.
A slight increase in volume this week is slightly bullish. Oil does not always exhibit strong volume at the start of a new wave. It tends to build through the middle and may explode at the end.
DAILY CHART
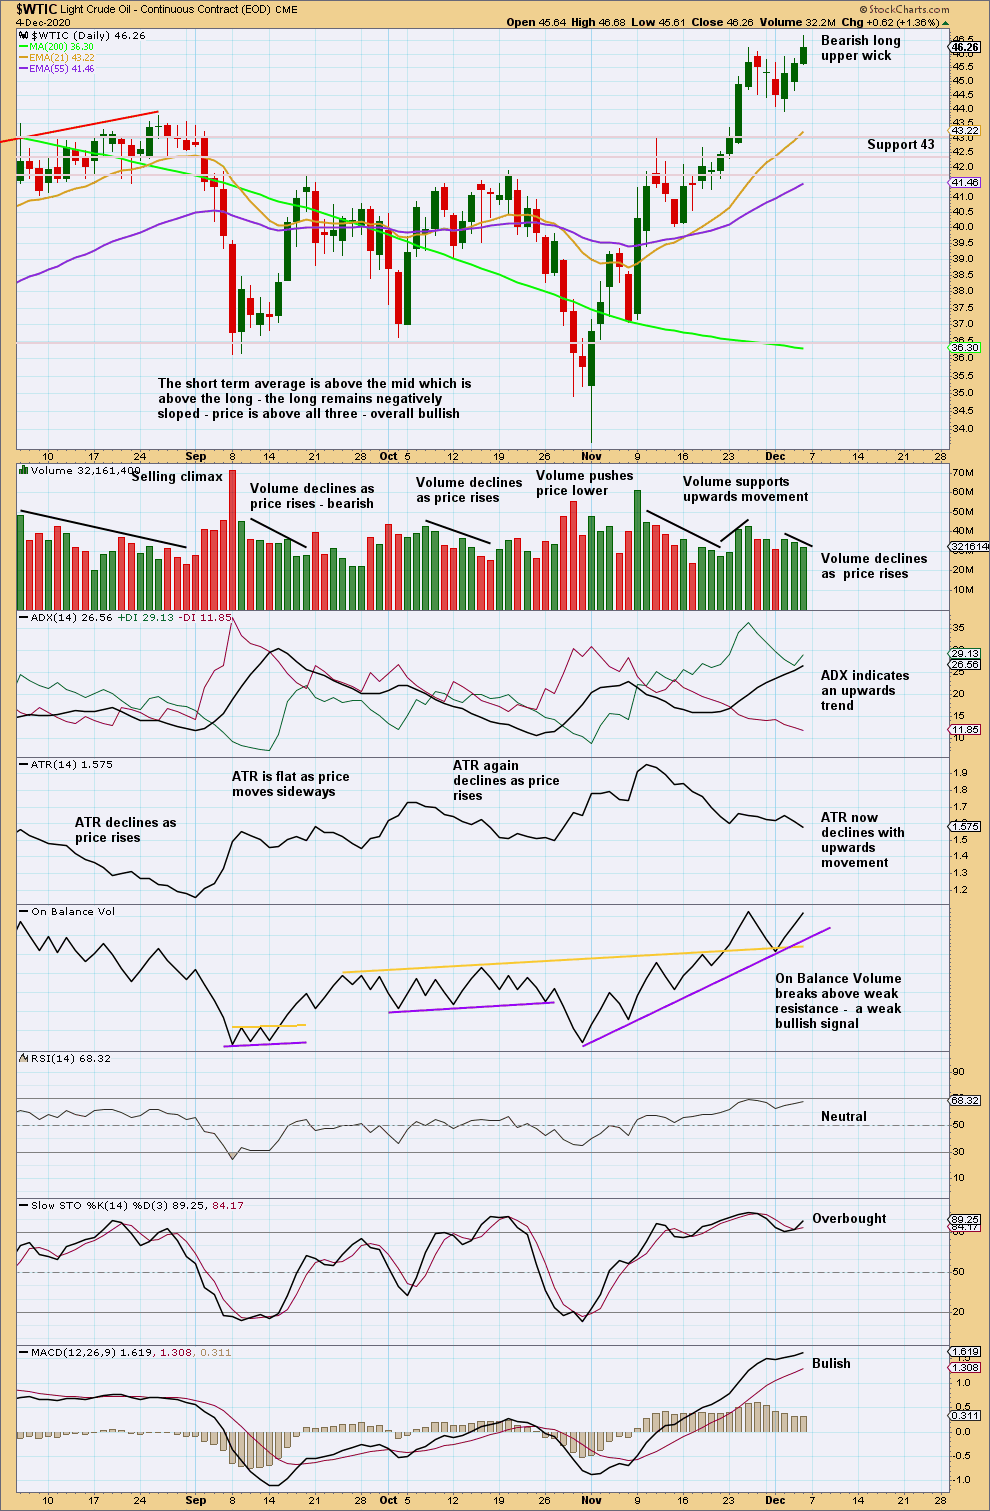
Click chart to enlarge. Chart courtesy of StockCharts.com.
RSI is not yet overbought. There is room for the upwards trend to continue.
For the last two sessions volume has declined. This suggests a little weakness, but for this particular market this is sometimes seen early in a new trend.
Published @ 07:22 p.m. ET.
—
Careful risk management protects your trading account(s).
Follow my two Golden Rules:
1. Always trade with stops.
2. Risk only 1-5% of equity on any one trade.
—
New updates to this analysis are in bold.