
US OIL: Elliott Wave and Technical Analysis | Charts – December 18, 2020
Price continues to move higher as the Elliott wave count and classic technical analysis expect.
The short-term target is now close by.
Summary: An upwards trend may continue. A new short-term target is at 55.67, where a pullback or consolidation to last at least two weeks may begin. Two longer-term targets for a third wave are first at 87.90 and thereafter at 121.43.
Oil may have found a major sustainable low in April 2020.
ELLIOTT WAVE COUNT
MONTHLY CHART
Click chart to enlarge.
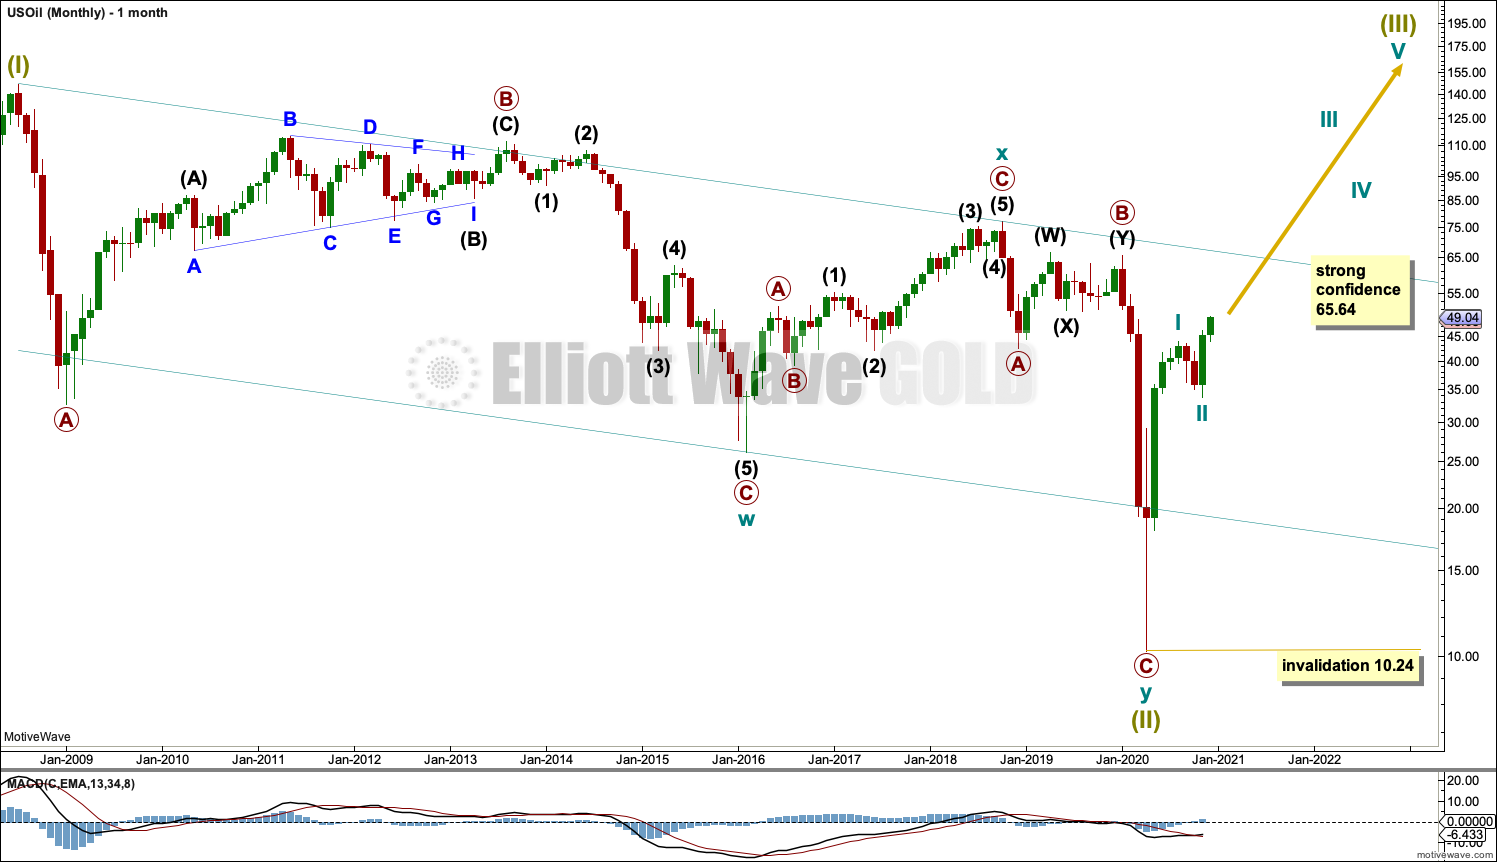
The basic Elliott wave structure is five steps forward and three steps back. This Elliott wave count expects that US Oil has completed a three steps back pattern, which began in July 2008. The Elliott wave count expects that the bear market for US Oil may now be over.
Following Super Cycle wave (III), which was a correction (three steps back), Super Cycle wave (III), which may have begun, should be five steps up when complete. Super Cycle wave (III) may last a generation and must make a new high above the end of Super Cycle wave (I) at 146.73.
A channel is drawn about Super Cycle wave (II): draw the first trend line from the start of cycle wave w to the end of cycle wave x, then place a parallel copy on the end of cycle wave w. This trend line is breached, which is a typical look for the end of a movement for a commodity.
The upper edge of the channel may provide resistance.
Super Cycle wave (III) may only subdivide as a five wave impulse. New trends for Oil usually start out very slowly with short first waves and deep time consuming second wave corrections. However, while this is a common tendency, it is not always seen and may not have been seen in this instance. The first reasonably sized pullback may be over already.
WEEKLY CHART
Click chart to enlarge.
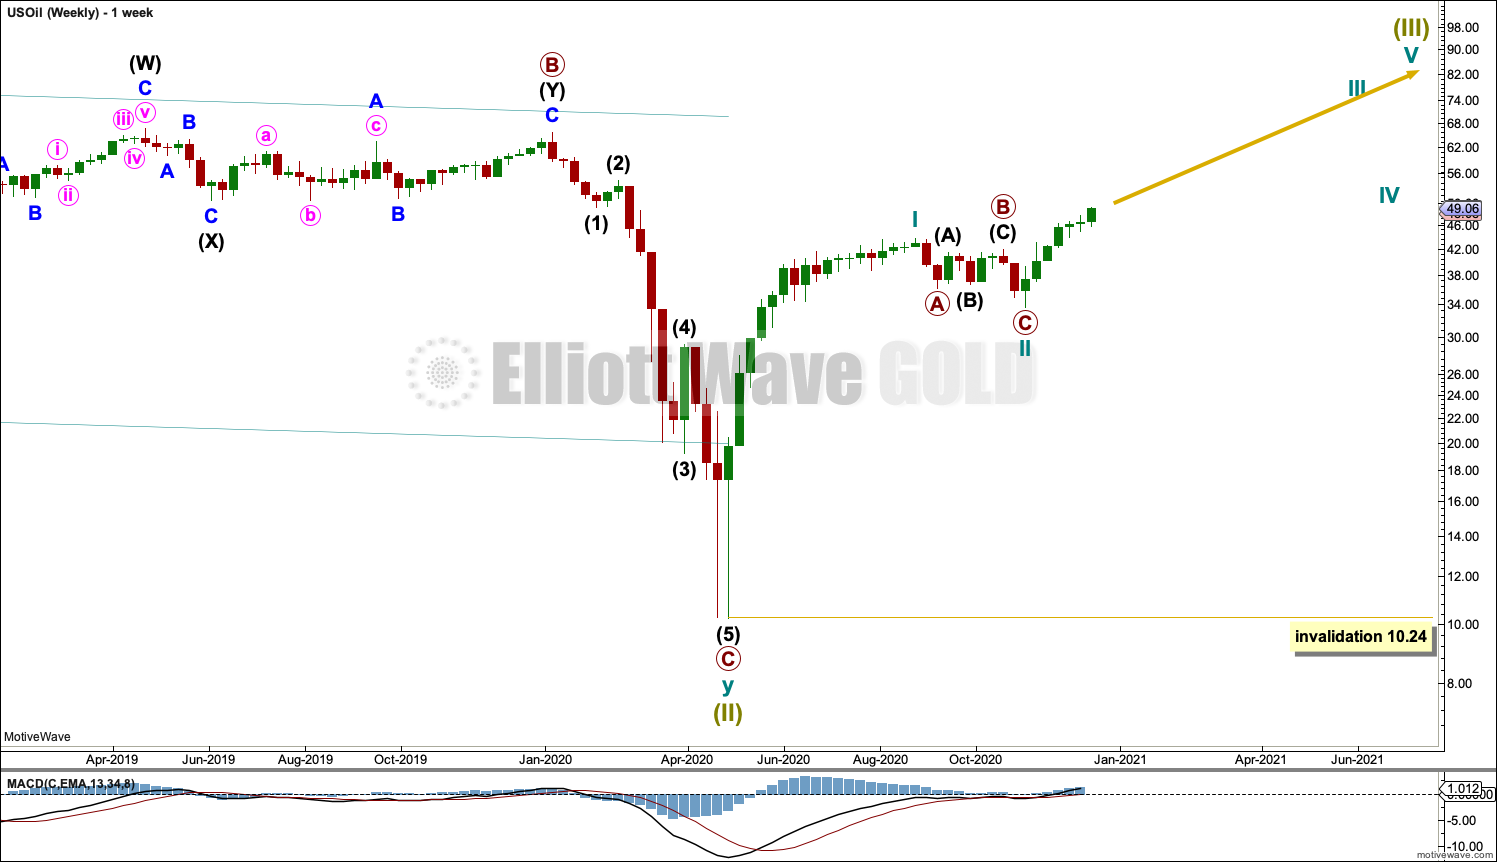
Super Cycle wave (III) must subdivide as an impulse. Cycle wave I within the impulse may be complete. Cycle wave II may also now be complete, and cycle wave III upwards may now have begun. If cycle wave II continues lower, then it may not move beyond the start of cycle wave I below 10.24.
DAILY CHART
Click chart to enlarge.
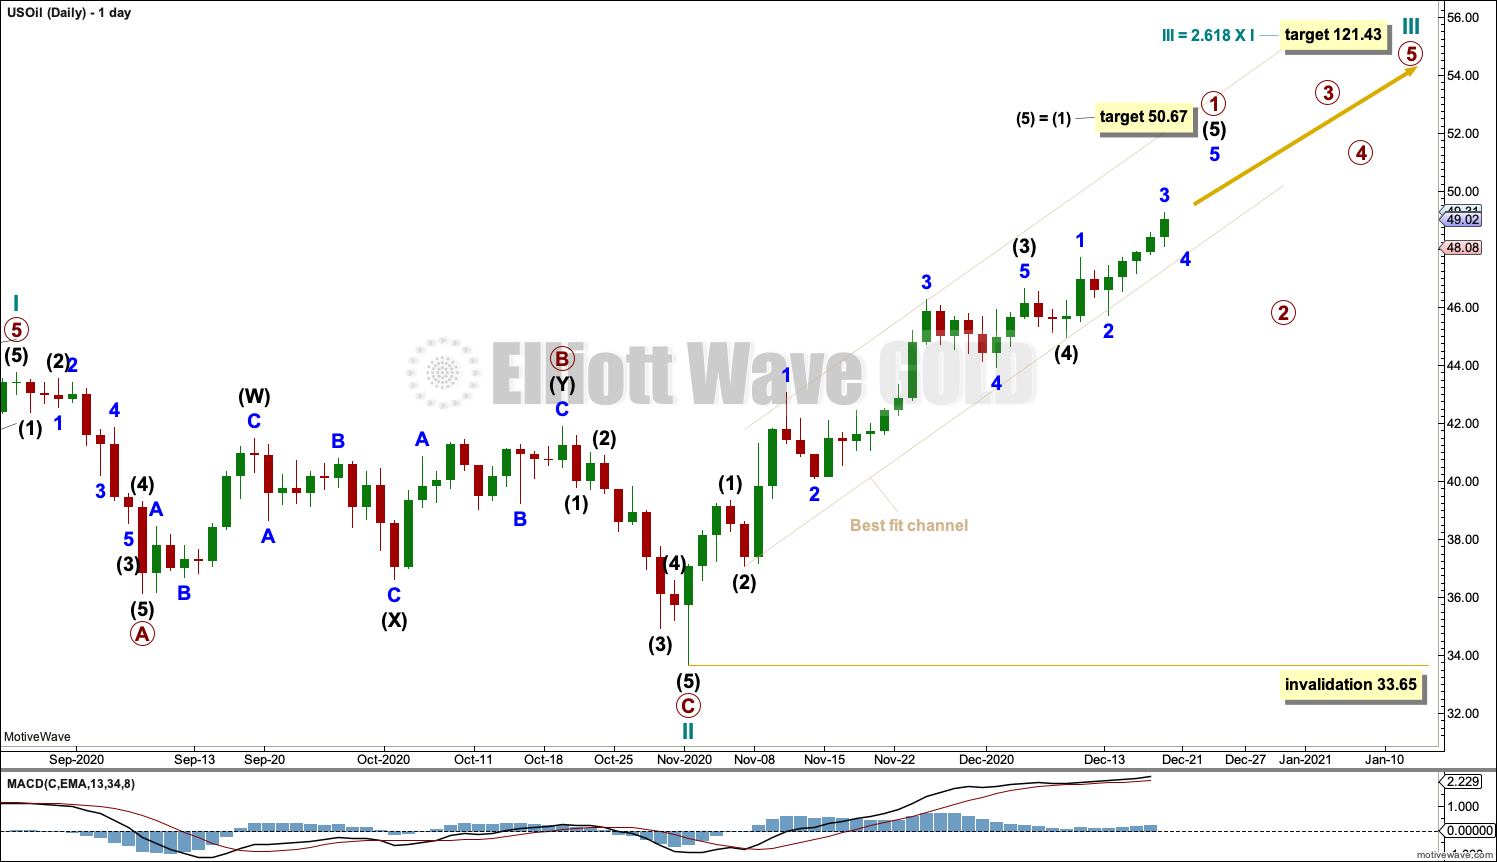
Cycle wave II may be a complete zigzag and only 0.3 of cycle wave I in depth, which is possible.
Cycle wave III may only subdivide as an impulse. Within the impulse: Primary wave 1 may be incomplete, and primary wave 2 may not move beyond the start of primary wave 1 below 33.65.
A target is calculated for primary wave 1 to end that expects intermediate wave (5) to exhibit the most common Fibonacci ratio to intermediate wave (1).
When primary wave 1 is complete, then a multi-week pullback or consolidation for primary wave 2 should begin. Use the best fit channel as a guide to when primary wave 1 may be over. When this channel is breached by at least one full daily candlestick of downwards movement below and not touching the lower edge, then it may indicate a trend change.
FIRST ALTERNATE DAILY CHART

Click chart to enlarge.
This first alternate wave count moves the degree of labelling within cycle wave II down one degree.
Cycle wave II may be continuing further as an expanded flat. Primary wave B within the expanded flat is now well beyond the common range to primary wave A of 1 to 1.38. The probability of this wave count is further reduced this week.
Primary wave C for this wave count would be extremely likely to move at least slightly below the end of primary wave A at 36.13 to avoid a truncation. Cycle wave II may not move beyond the start of cycle wave I below 10.24.
SECOND ALTERNATE DAILY CHART
Click chart to enlarge.
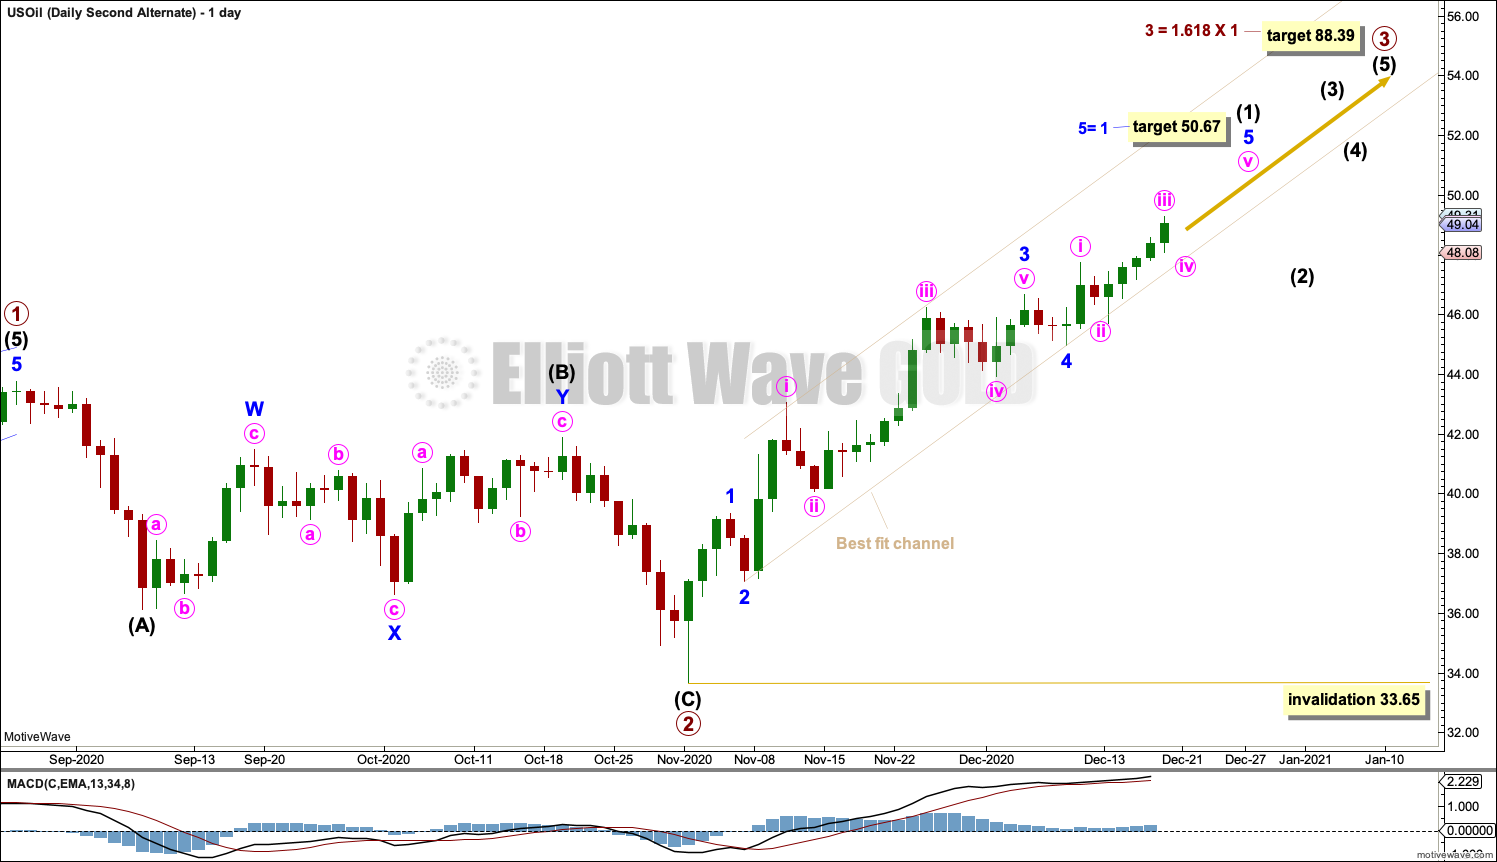
It is also possible that the degree of labelling at the daily chart level may need to be changed down one degree. It may be that only primary wave 1 is complete within cycle wave I and the pullback may be primary wave 2.
Primary wave 2 may be complete. A target is calculated for primary wave 3.
TECHNICAL ANALYSIS
WEEKLY CHART
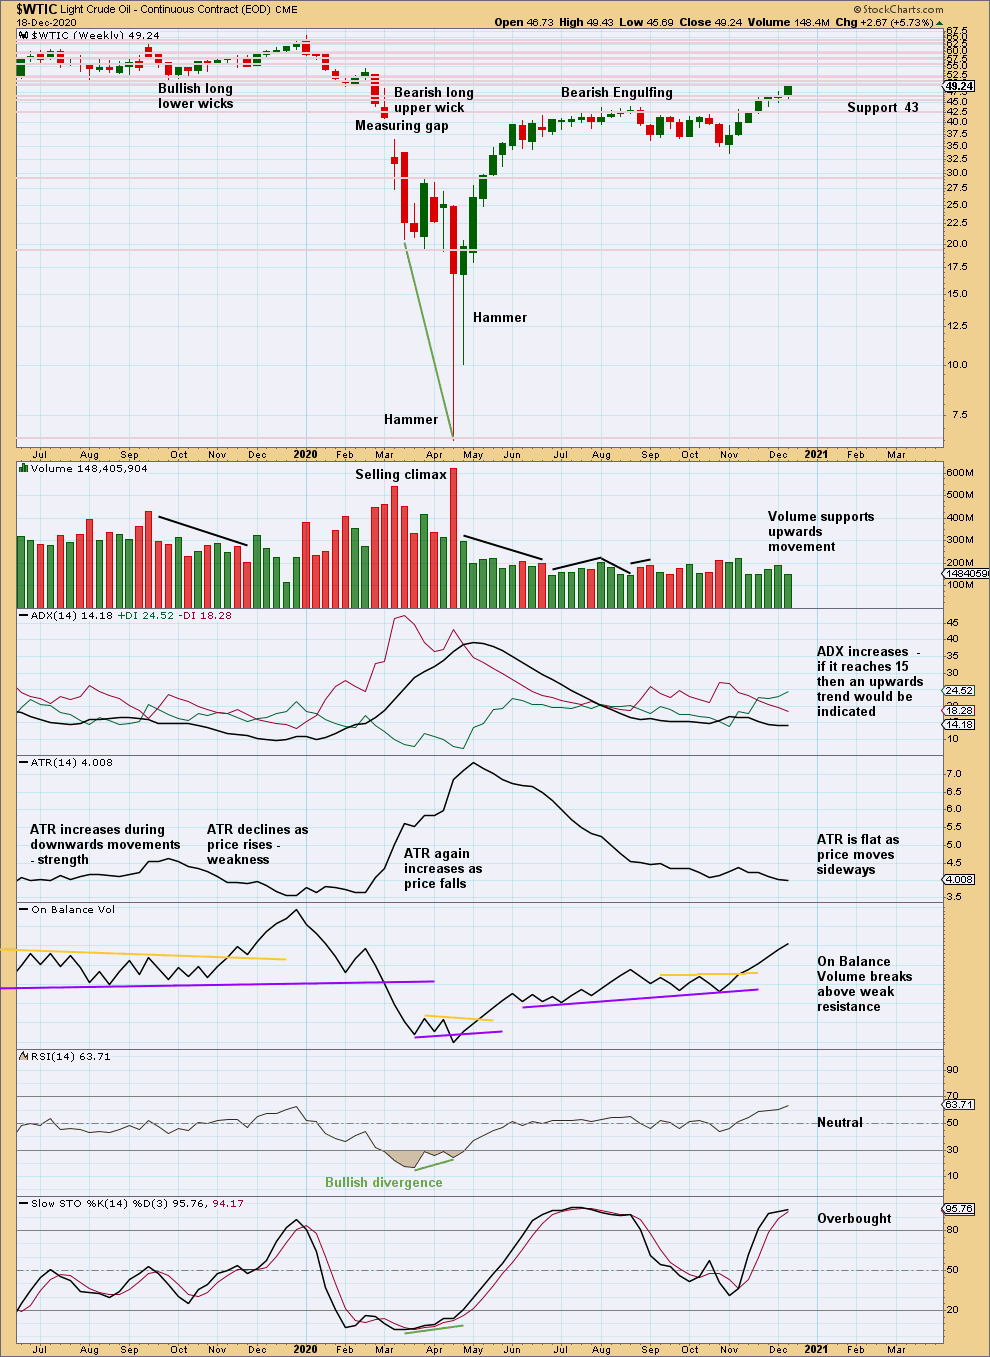
Click chart to enlarge. Chart courtesy of StockCharts.com.
Price is within a cluster of resistance and support; this may slow it down.
Volume is bullish (note this chart is prepared before NY close, so the last week’s data is incomplete). RSI is not extreme. If the ADX line reaches 15, then it would indicate an upwards trend. That would be a very strong bullish signal from ADX.
DAILY CHART
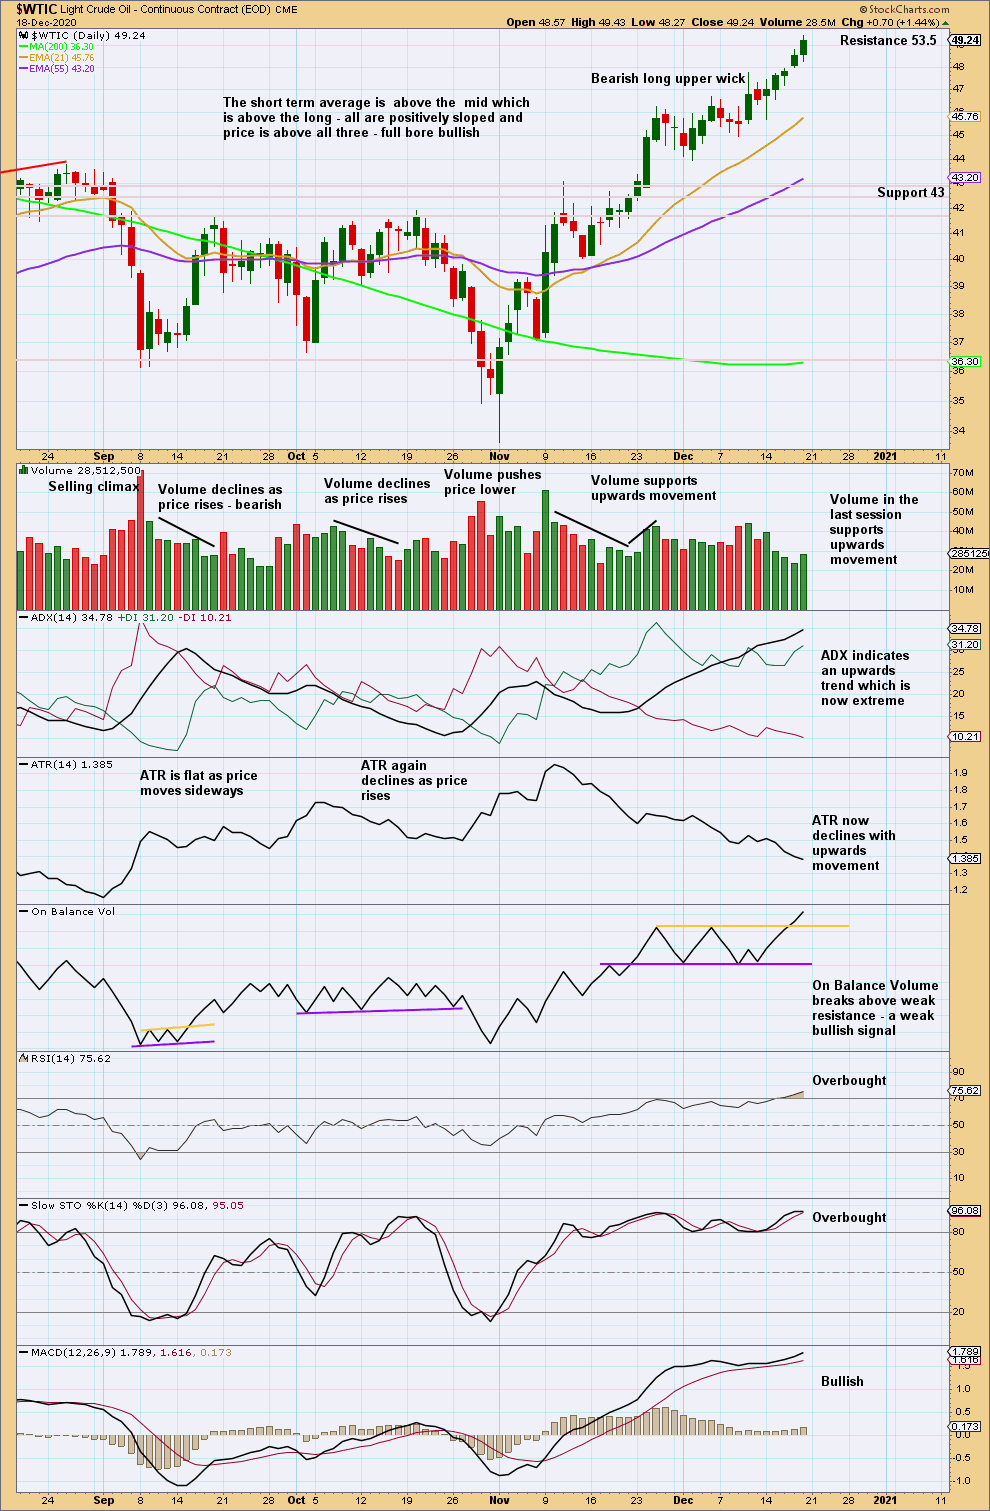
Click chart to enlarge. Chart courtesy of StockCharts.com.
RSI and ADX are now both extreme. However, these indicators may remain extreme for some time when this market trends. If ADX reaches very extreme (above both directional lines and above 45) and if RSI exhibits bearish divergence after reaching overbought, then a more time consuming consolidation or a deeper pullback may be indicated.
Extreme conditions warrant increased caution.
If a bearish candlestick pattern develops in extreme conditions, then it should be given weight.
Published @ 05:40 p.m. ET.
—
Careful risk management protects your trading account(s).
Follow my two Golden Rules:
1. Always trade with stops.
2. Risk only 1-5% of equity on any one trade.
—
New updates to this analysis are in bold.