
US OIL: Elliott Wave and Technical Analysis | Charts – December 24, 2020
Sideways and slightly lower movement this week with a bearish candlestick pattern sees three short-term Elliott wave counts considered.
Summary: An upwards trend may continue. A new short-term target is at 51.87, where a pullback or consolidation to last at least two weeks may begin. A longer-term target for a third wave is at 121.43.
Oil may have found a major sustainable low in April 2020.
ELLIOTT WAVE COUNT
MONTHLY CHART
Click chart to enlarge.
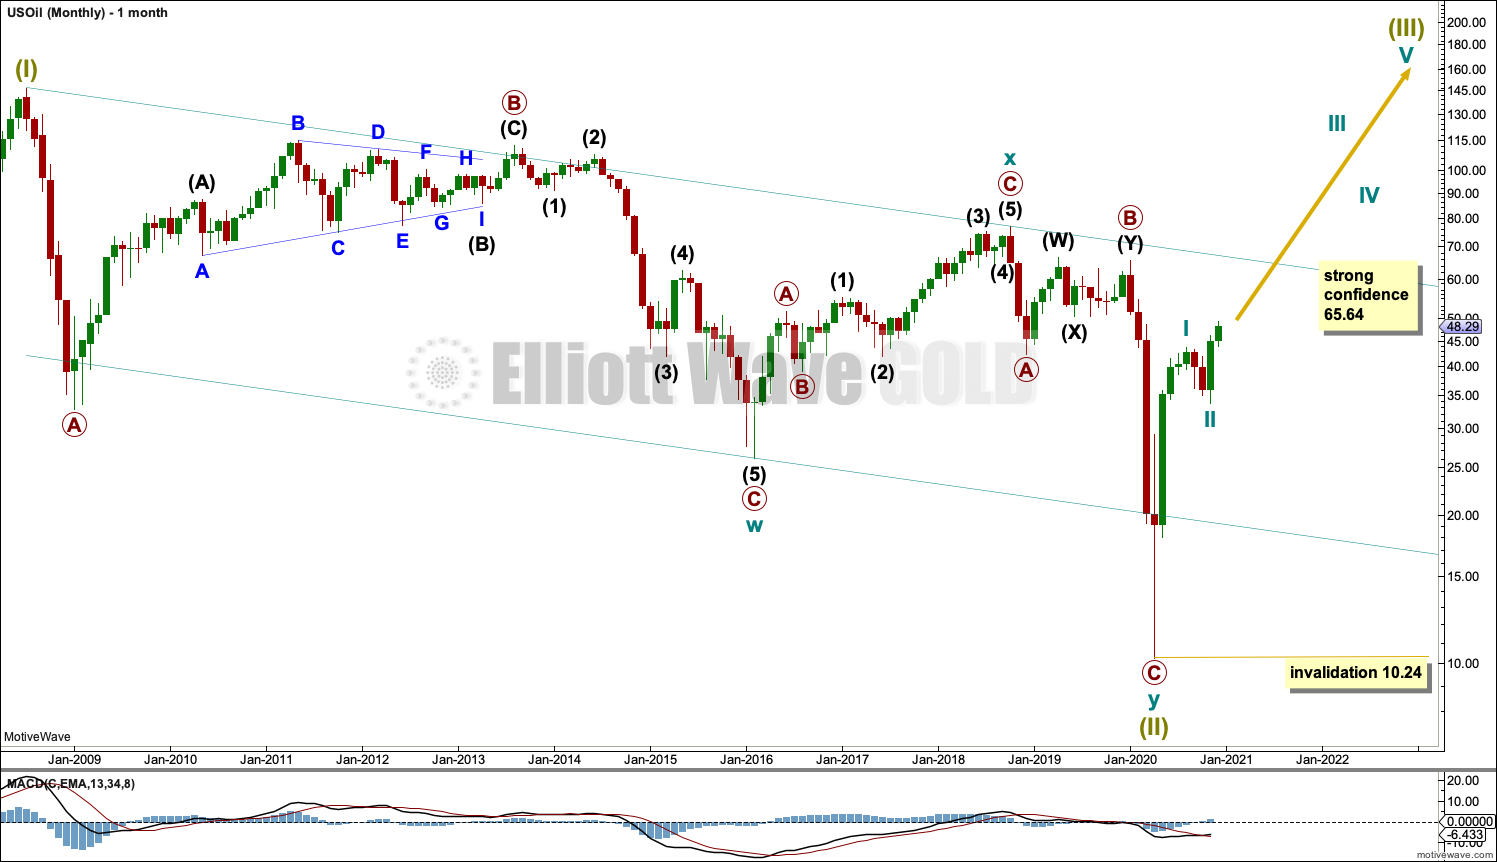
The basic Elliott wave structure is five steps forward and three steps back. This Elliott wave count expects that US Oil has completed a three steps back pattern, which began in July 2008. The Elliott wave count expects that the bear market for US Oil may now be over.
Following Super Cycle wave (III), which was a correction (three steps back), Super Cycle wave (III), which may have begun, should be five steps up when complete. Super Cycle wave (III) may last a generation and must make a new high above the end of Super Cycle wave (I) at 146.73.
A channel is drawn about Super Cycle wave (II): draw the first trend line from the start of cycle wave w to the end of cycle wave x, then place a parallel copy on the end of cycle wave w. This trend line is breached, which is a typical look for the end of a movement for a commodity.
The upper edge of the channel may provide resistance.
Super Cycle wave (III) may only subdivide as a five wave impulse. New trends for Oil usually start out very slowly with short first waves and deep time consuming second wave corrections. However, while this is a common tendency, it is not always seen and may not have been seen in this instance. The first reasonably sized pullback may be over already.
WEEKLY CHART
Click chart to enlarge.
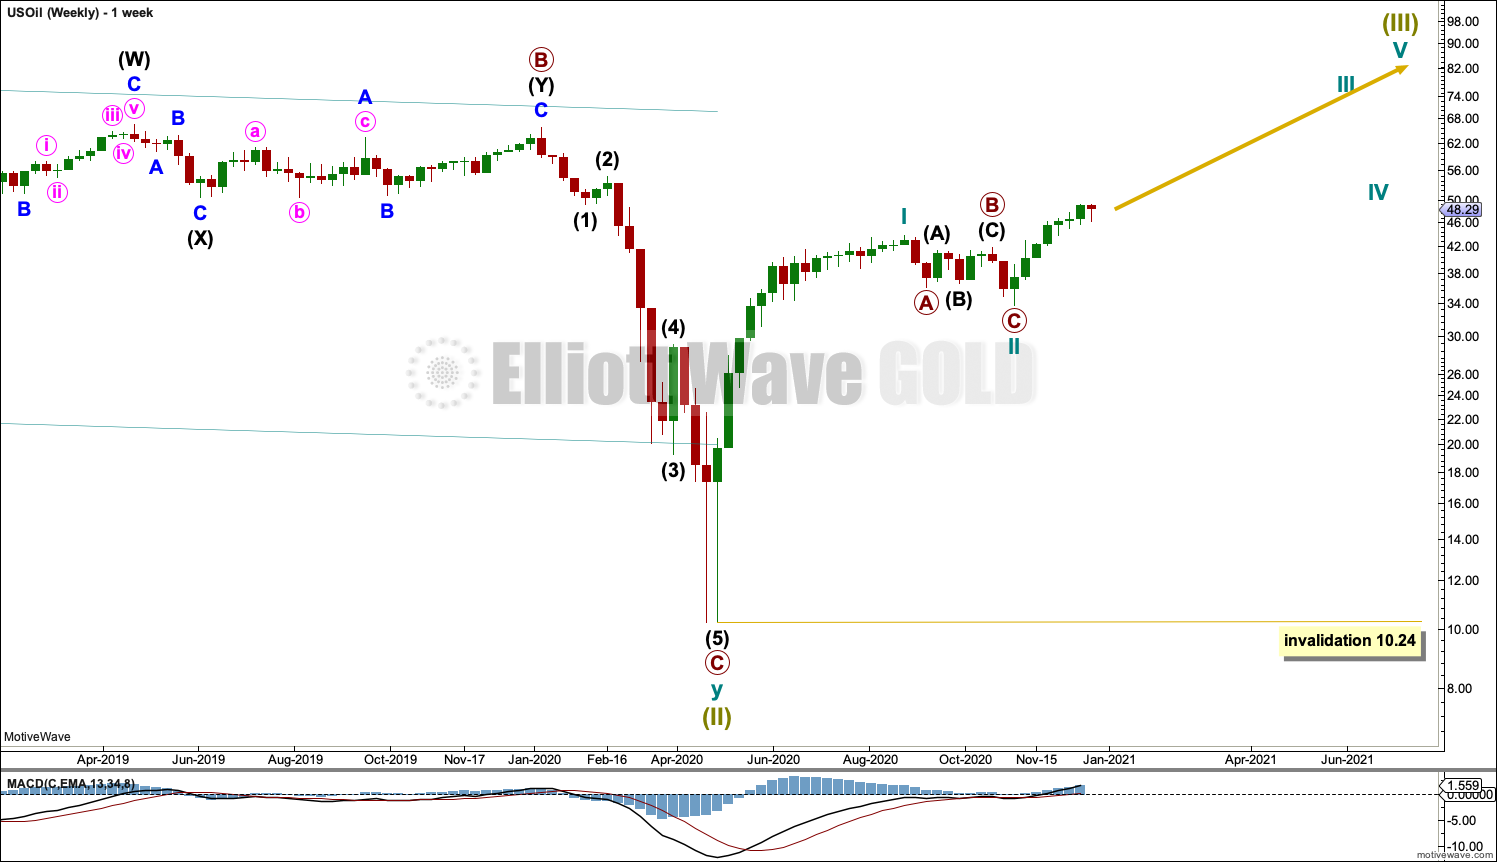
Super Cycle wave (III) must subdivide as an impulse. Cycle wave I within the impulse may be complete. Cycle wave II may also now be complete, and cycle wave III upwards may now have begun. If cycle wave II continues lower, then it may not move beyond the start of cycle wave I below 10.24.
This week all three daily charts will follow the same degree of labelling as this weekly chart, with cycle wave I over at the high on the week beginning 25th August 2020. In the future the degree of labelling may need to be moved down one degree.
DAILY CHART
Click chart to enlarge.
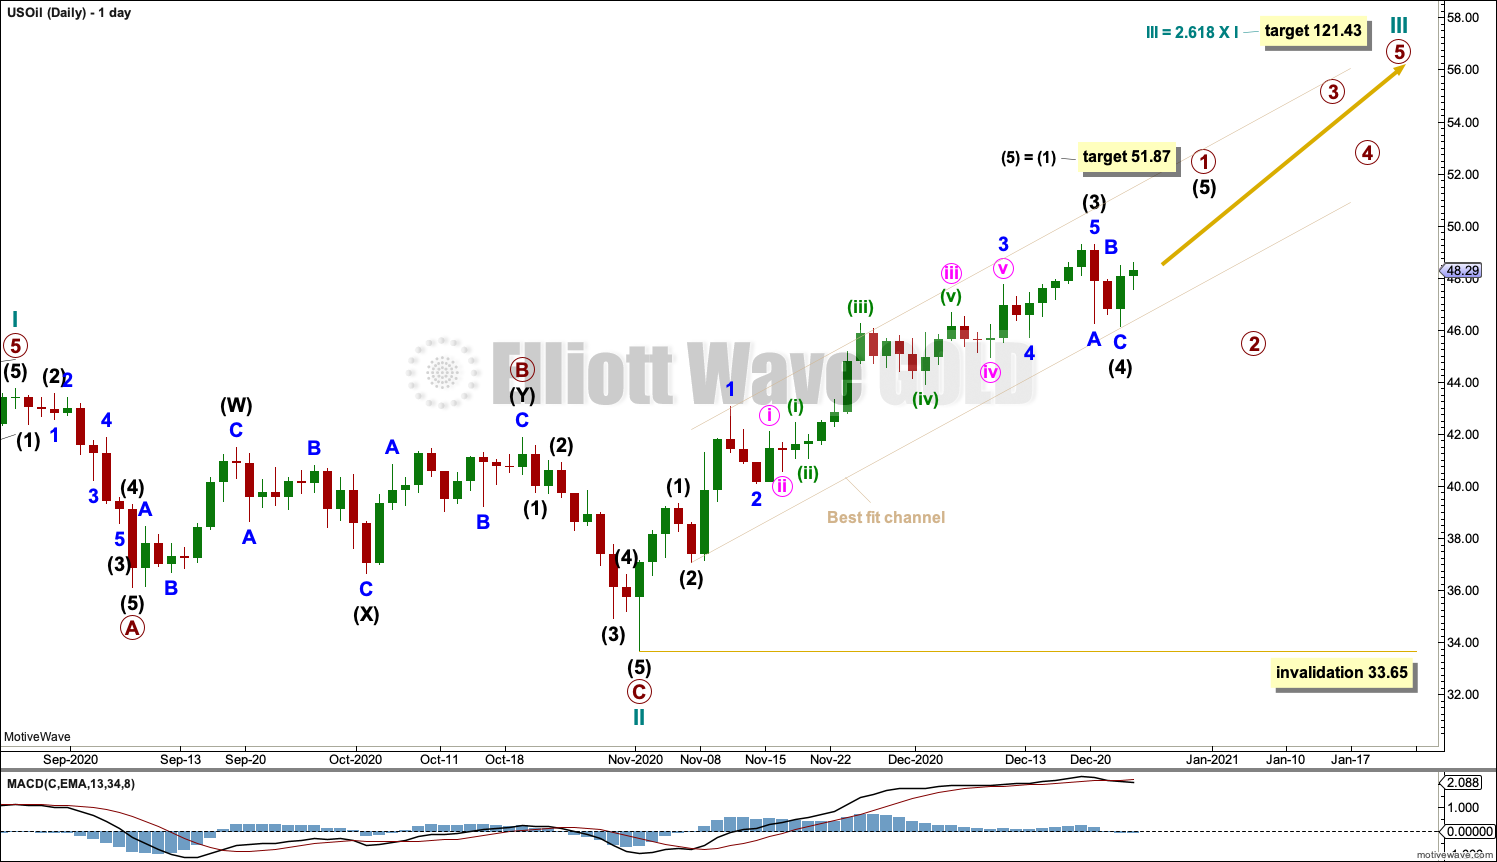
Cycle wave II may be a complete zigzag and only 0.3 of cycle wave I in depth, which is possible.
Cycle wave III may only subdivide as an impulse. Within the impulse: Primary wave 1 may be incomplete, and primary wave 2 may not move beyond the start of primary wave 1 below 33.65.
This week this main wave count has labelling within primary wave 1 changed. The small pullback of this week may have been intermediate wave (4). The best fit channel is also adjusted. The lower edge is more conservative and is drawn from the lows of intermediate waves (1) to (4).
A target is calculated for primary wave 1 to end that expects intermediate wave (5) to exhibit the most common Fibonacci ratio to intermediate wave (1).
When primary wave 1 is complete, then a multi-week pullback or consolidation for primary wave 2 should begin. The best fit channel may help as a guide to when primary wave 1 may be over. When this channel is breached by at least one full daily candlestick of downwards movement below and not touching the lower edge, then it may indicate a trend change.
This main daily chart should be discarded in favour of the first alternate below if price makes a new low below 46.16.
FIRST ALTERNATE DAILY CHART
Click chart to enlarge.
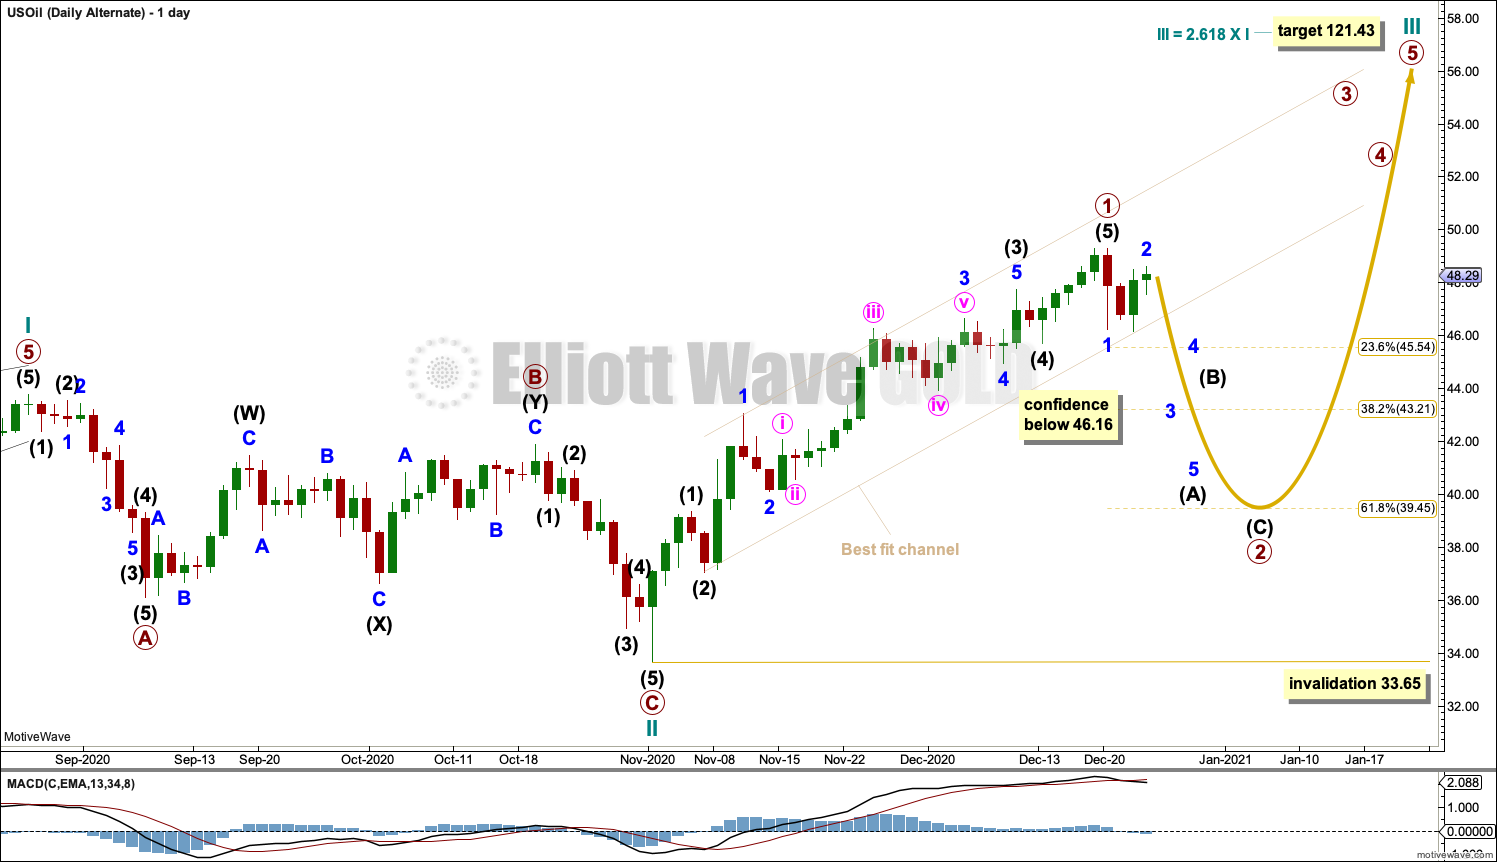
This first alternate wave count looks at the possibility that primary wave 1 was over at the last high and this week primary wave 2 may have just begun.
Primary wave 2 may most likely end about the 0.618 Fibonacci ratio of primary wave 1. Primary wave 2 may most likely subdivide as a zigzag. Intermediate wave (A) within a zigzag should complete as a five wave structure.
Primary wave 2 may continue for another two to a few weeks. Primary wave 2 may not move beyond the start of primary wave 1 below 33.65.
SECOND ALTERNATE DAILY CHART
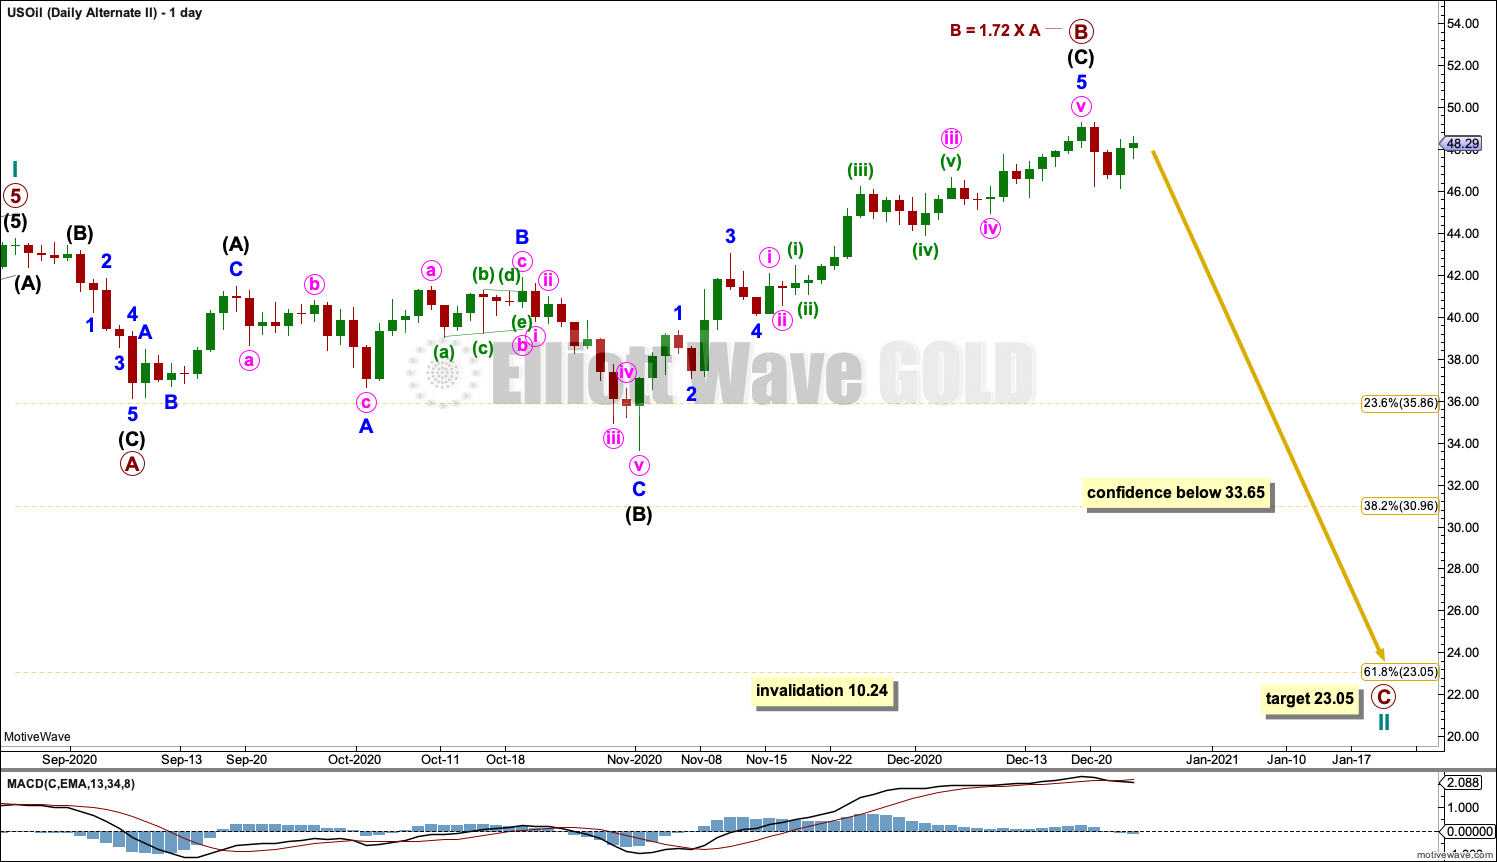
Click chart to enlarge.
This second alternate wave count considers the possibility that cycle wave II is not over and may be continuing further as an expanded flat.
The common range for B waves within flat corrections is from 1 to 1.38 the length of the A wave. In this example, primary wave B is now reasonably longer than this range. The probability of this wave count is reduced.
B waves should exhibit weakness. Upwards movement from the low of the 2nd of November does not exhibit weakness in volume or RSI. There is no divergence. This wave count does not have support from classic technical analysis.
Low probability does not mean no probability. Sometimes low probability outcomes do occur, and when they do they will never be what was expected as most likely. This wave count is provided as a pathway if price moves below 33.65 and the first two daily charts are invalidated.
TECHNICAL ANALYSIS
WEEKLY CHART
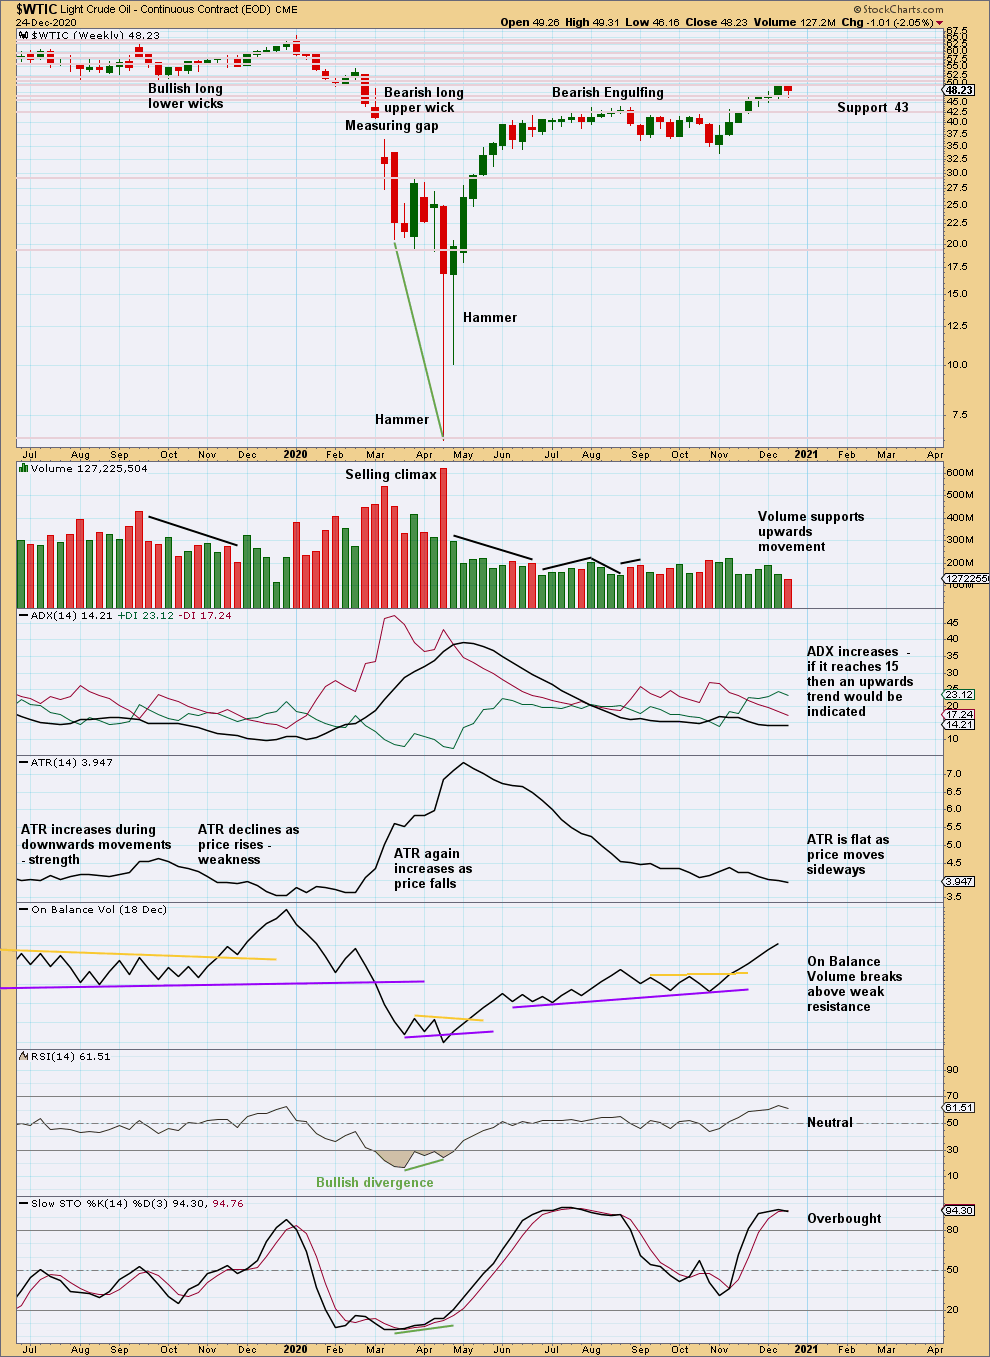
Click chart to enlarge. Chart courtesy of StockCharts.com.
Price is within a cluster of resistance and support; this may slow it down.
This week completes a little downwards movement, which has light volume. Although as this was a short week, nothing should be read into lighter volume.
ADX is very near to 15. If it reaches 15, then that would be a very bullish signal. There would be a lot of room for an upwards trend to continue as RSI and ADX are not extreme.
DAILY CHART

Click chart to enlarge. Chart courtesy of StockCharts.com.
A Bearish Engulfing pattern has support from volume. Occurring when both ADX and RSI were extreme, this supports the first alternate Elliott wave count.
However, the long lower wick supports the main Elliott wave count. This market can remain extreme for reasonable periods of time. It may see small corrections prior to the trend resuming and remaining extreme before RSI exhibits divergence between swing highs. This scenario would suit the main Elliott wave count.
Published @ 09:31 p.m. ET.
—
Careful risk management protects your trading account(s).
Follow my two Golden Rules:
1. Always trade with stops.
2. Risk only 1-5% of equity on any one trade.
—
New updates to this analysis are in bold.