
GOLD: Elliott Wave and Technical Analysis | Charts – January 4, 2021
Summary: A short-term target from the pennant is at 1,994. This classic pattern fits the second Elliott wave count.
The second wave count is bullish for the bigger picture. It now expects that the pullback was over at the last low and the bull market for Gold has resumed to a new mid-term target at 1,996 and thereafter a final target at 2,182.
The first wave count is bearish for the bigger picture and has only one daily chart. This wave count expects a multi-year bear market may be in its early stages to end below 1,046. A short-term target is at 1,645. A long-term target is at 657. Some confidence may be had in this bearish wave count if price makes a new low below 1,766.53. This wave count may be discarded if price makes a new high above 1,964.66.
Grand SuperCycle analysis is here.
Last analysis of monthly charts is here.
FIRST ELLIOTT WAVE COUNT
WEEKLY CHART
Click chart to enlarge.
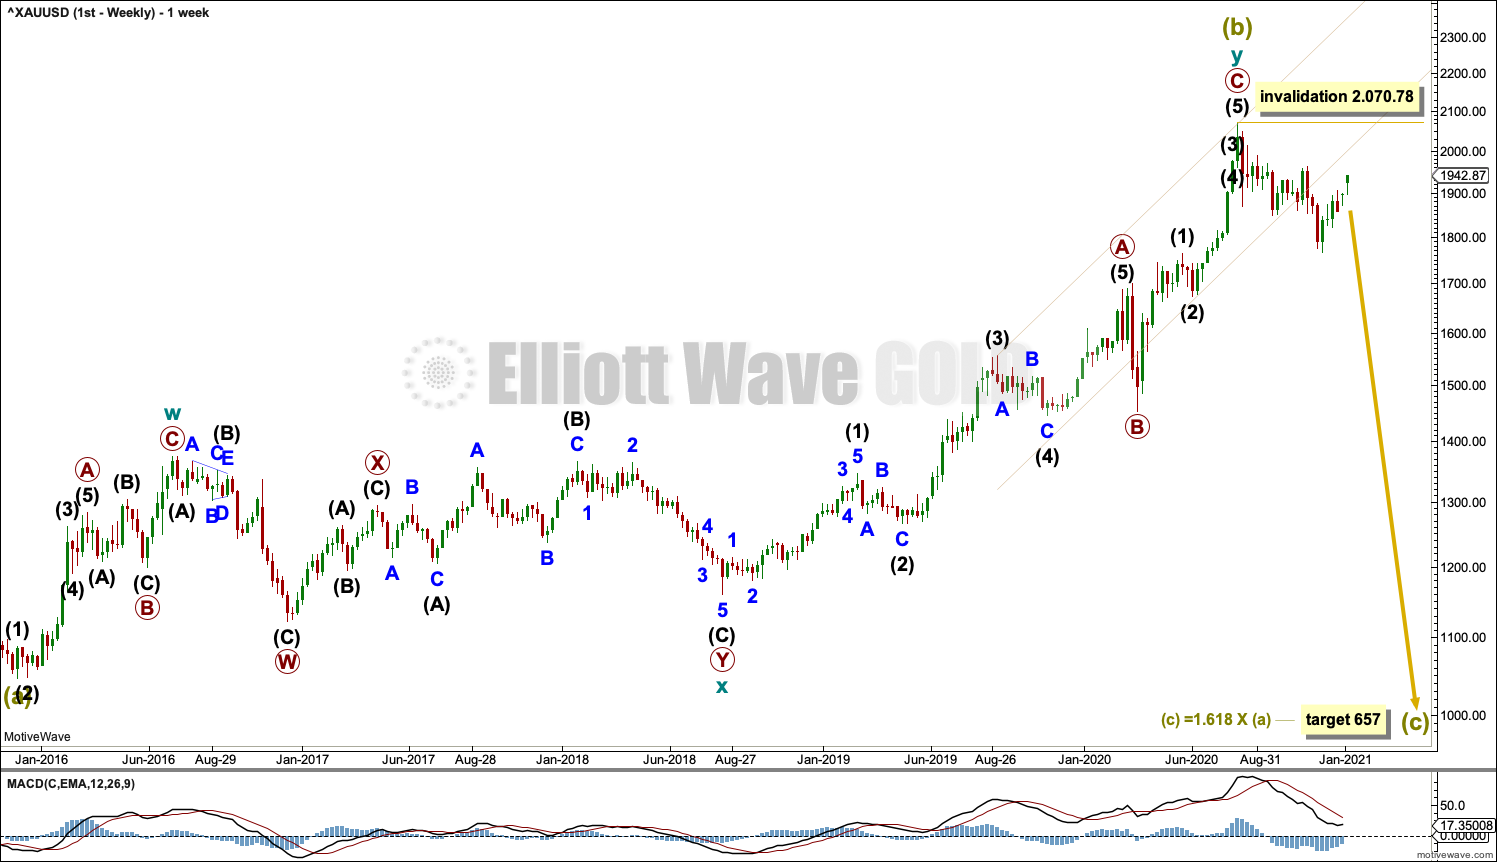
The bigger picture for this first Elliott wave count sees Gold as still within a bear market, in a three steps back pattern that is labelled Grand Super Cycle wave IV on monthly charts. Grand Super Cycle wave IV may be subdividing as an expanded flat pattern.
Super Cycle wave (b) within Grand Super Cycle wave IV may be a complete double zigzag. This wave count expects Super Cycle wave (c) to move price below the end of Super Cycle wave (a) at 1,046.27 to avoid a truncation and a very rare running flat. The target calculated expects a common Fibonacci ratio for Super Cycle wave (c).
The first zigzag in the double is labelled cycle wave w. The double is joined by a three in the opposite direction, a combination labelled cycle wave x. The second zigzag in the double is labelled cycle wave y.
The purpose of the second zigzag in a double is to deepen the correction. Cycle wave y has achieved this purpose.
A best fit channel is drawn about primary wave C to contain as much of this movement as possible. Copy this channel over to daily charts. This channel is now clearly breached, which suggests the upwards wave labelled cycle wave y may be over.
DAILY CHART
Click chart to enlarge.
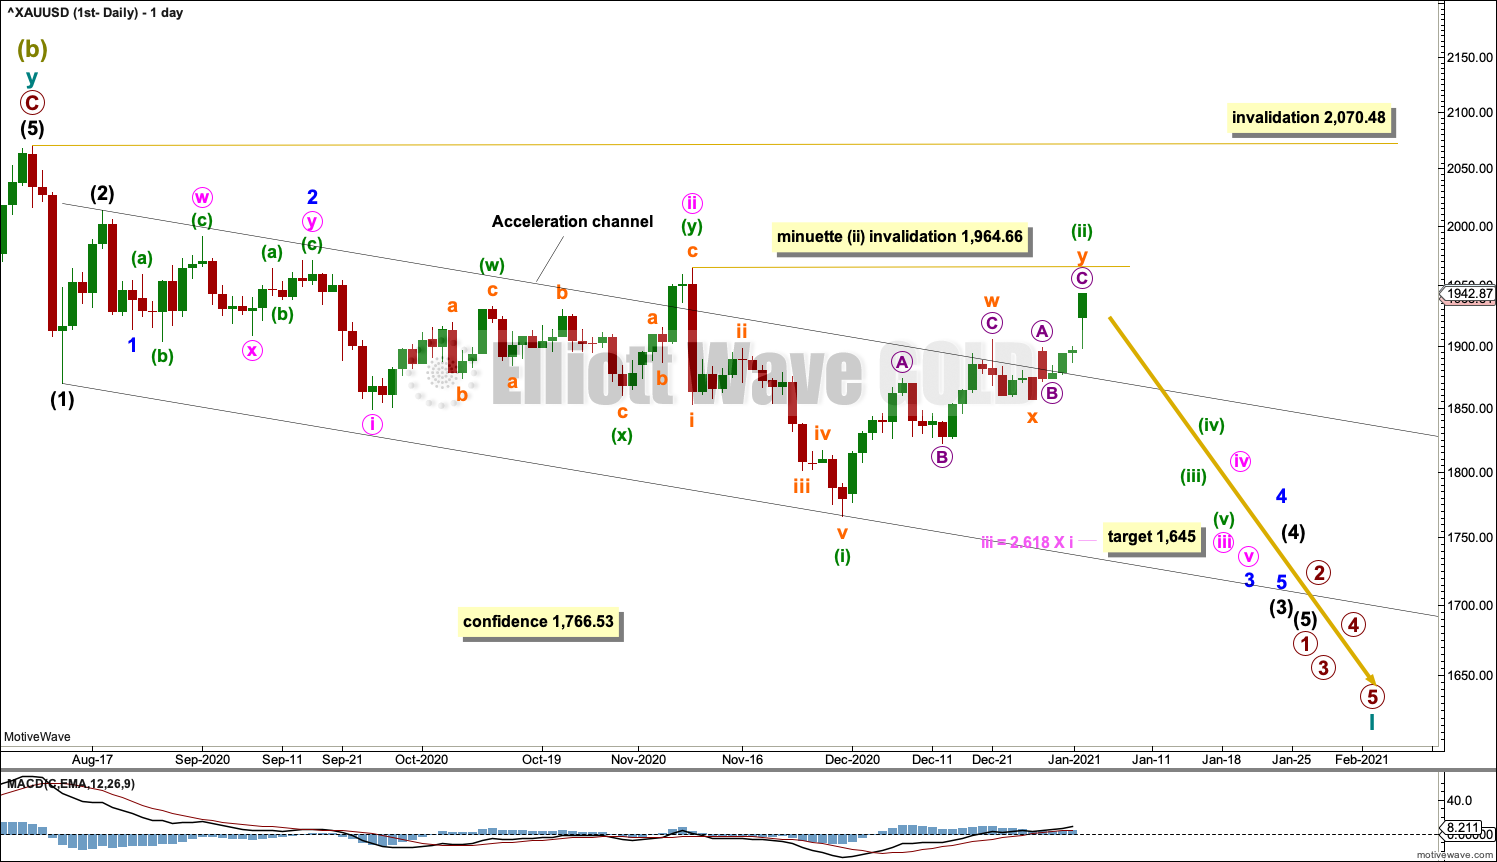
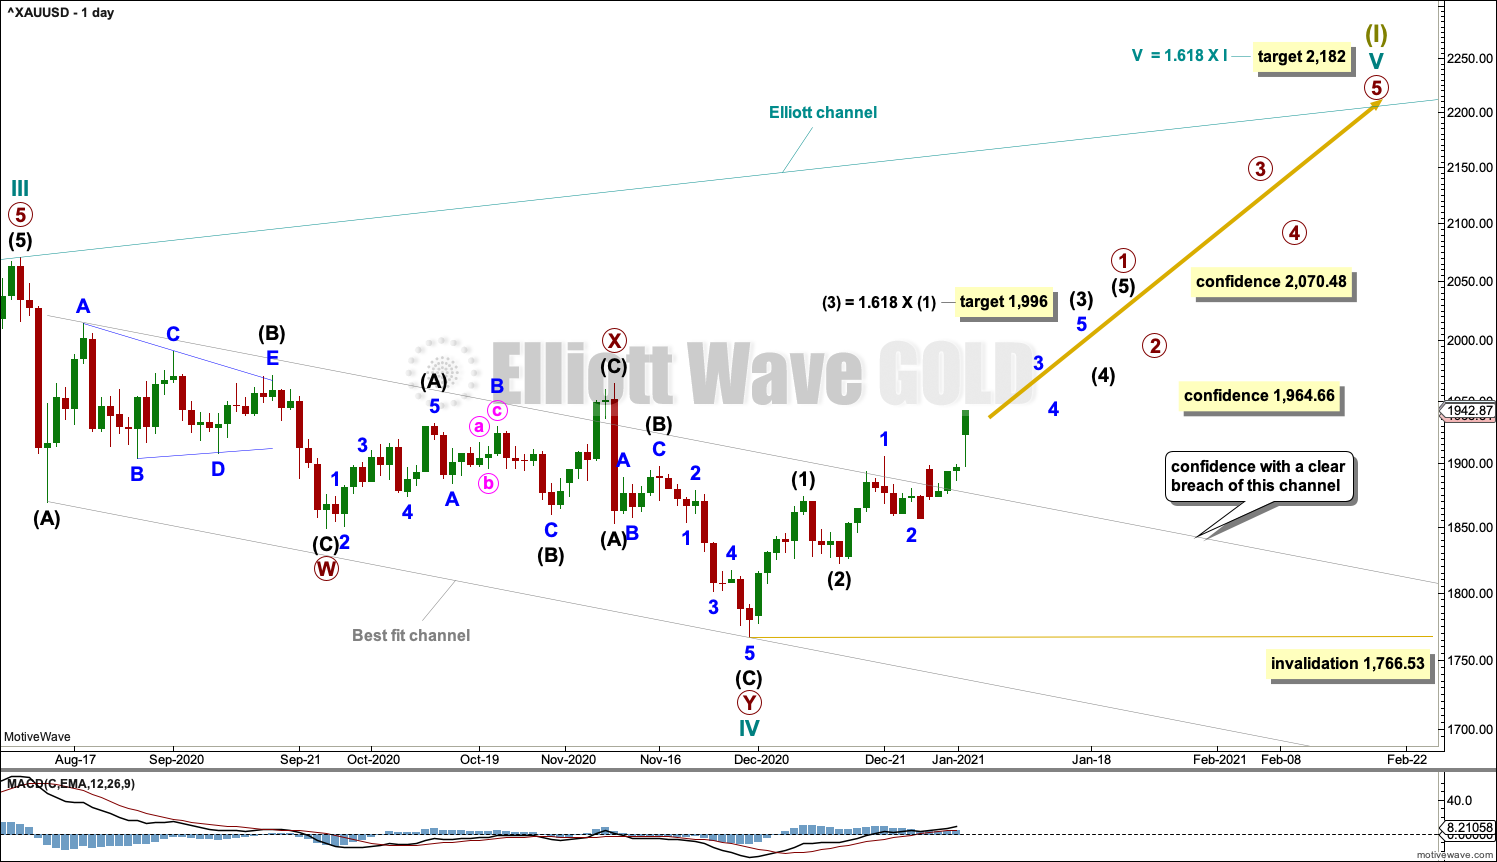
Within a new bear market, primary wave 1 may be an incomplete five wave impulse.
Primary wave 2 within the new downwards trend may not move beyond the start of primary wave 1 above 2,070.48.
Gold typically exhibits extended and strong fifth waves; this tendency is especially prevalent for fifth waves to end third wave impulses one degree higher. One or more of minuette wave (v), minute wave v and minor wave 5 may exhibit this tendency; there may be one or more selling climaxes along the way down. Minute wave iv and minor wave 4 may be relatively brief and shallow.
Draw an acceleration channel about downwards movement and keep redrawing the channel as price continues lower. Draw the first trend line from the end of intermediate wave (1) to the last low, then place a parallel copy on the end of intermediate wave (2). When intermediate wave (3) may be complete, then this channel would be drawn using Elliott’s technique about primary wave 1. The upper edge of this channel has again been breached. The upper edge of this channel was breached at the end of minute wave ii and yet price continued lower from there; the upper edge of the channel may not perfectly show were price finds resistance.
Minuette wave (ii) may have continued higher as a double zigzag. Minuette wave (ii) may not move beyond the start of minuette wave (i) above 1,964.66. This wave count may be discarded if price makes a new high above 1,964.66.
A new low below 1,766.53 would add reasonable confidence to this wave count.
HOURLY CHART
Click chart to enlarge.
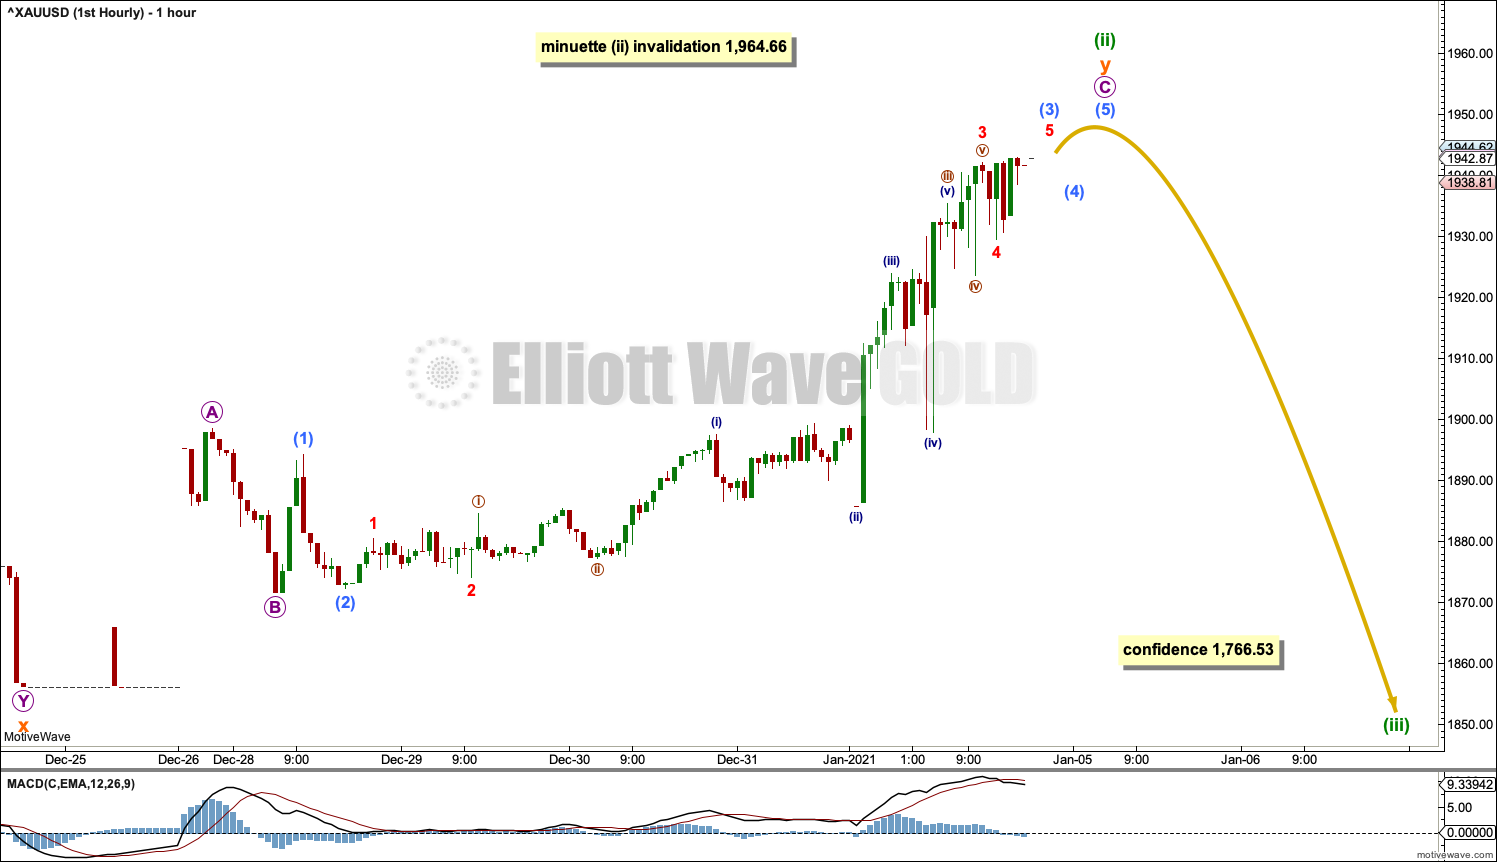
Minuette wave (ii) may be continuing higher as a double zigzag, which is near completion. Minuette wave (ii) may not move beyond the start of minuette wave (i) above 1,964.66
The next wave down is expected to be a third wave at multiple degrees for this wave count.
SECOND ELLIOTT WAVE COUNT
WEEKLY CHART
Click chart to enlarge.
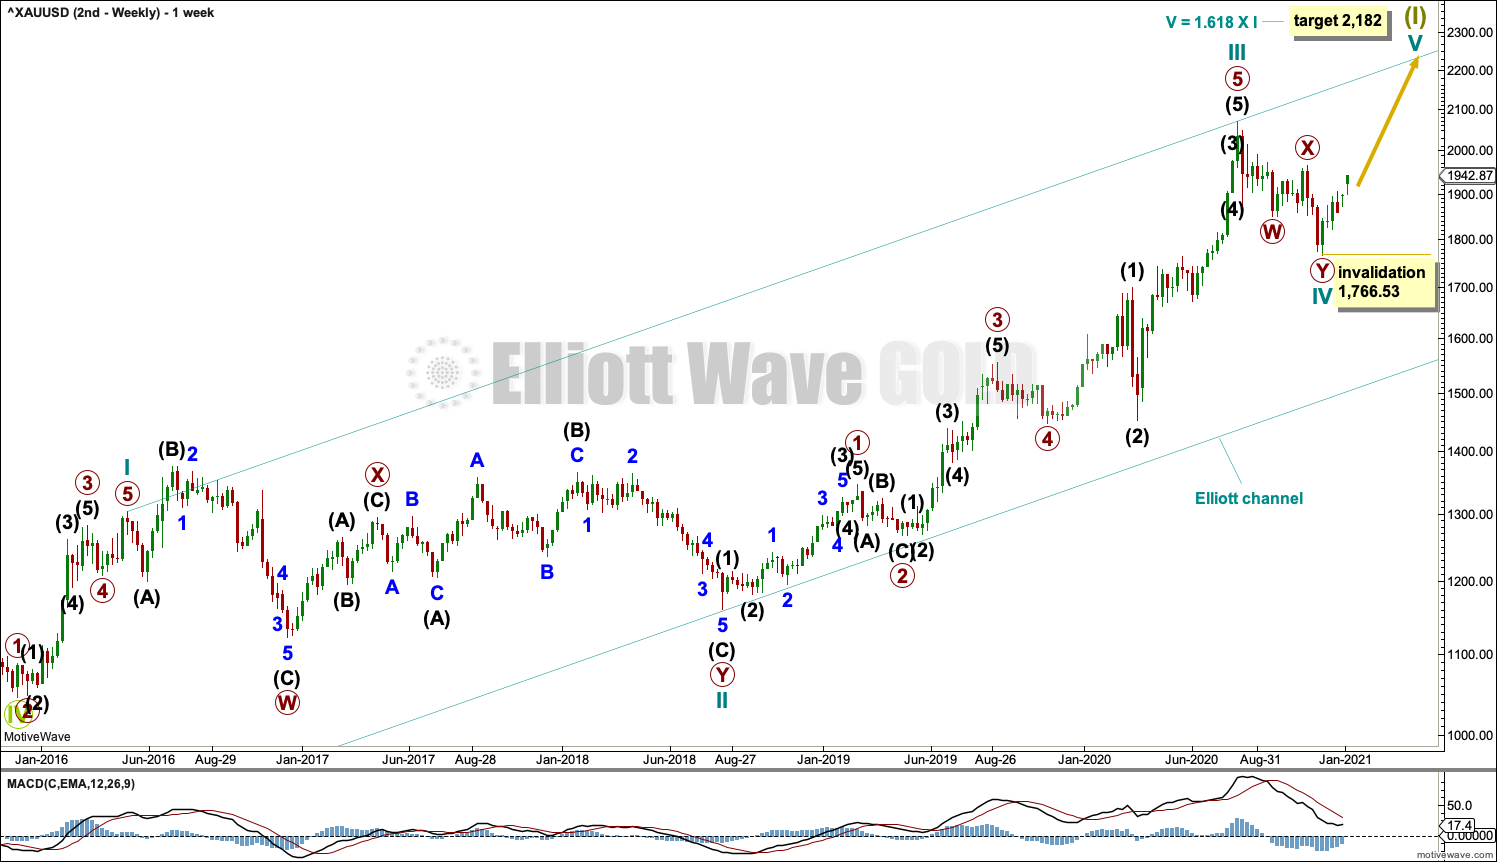
This wave count sees the the bear market complete at the last major low for Gold on 3 December 2015.
If Gold is in a new bull market, then it should begin with a five wave structure upwards on the weekly chart.
Cycle wave I fits as a five wave impulse with reasonably proportionate corrections for primary waves 2 and 4.
Cycle wave II fits as a double flat. However, within the first flat correction labelled primary wave W, this wave count needs to ignore what looks like an obvious triangle from July to September 2016 (this can be seen labelled as a triangle on the first wave count above). This movement must be labelled as a series of overlapping first and second waves. Ignoring this triangle reduces the probability of this wave count in Elliott wave terms.
Cycle waves III and IV may be complete.
Draw an Elliott channel about this impulse as shown. Cycle wave V may find resistance about the upper edge.
DAILY CHART
Click chart to enlarge.
Cycle wave IV may be over as a double zigzag.
The best fit channel about cycle wave IV is now breached by at least one full daily candlestick above and not touching the upper edge. This provides some confidence for this wave count. Thereafter, a new swing high above 1,964.66 would add reasonable confidence. Finally, a new all time high would add strong confidence to this wave count.
If cycle wave IV is complete, then it would have lasted only 17 weeks compared to 119 weeks for cycle wave II. While it is normal for Gold to exhibit fourth waves that are more brief than their counterpart second waves, a difference this great is unusual. This reduces the probability of this wave count.
When primary wave 1 within cycle wave V is complete, then primary wave 2 may not move beyond the start of primary wave 1 below 1,766.53.
A target is calculated for intermediate wave (3).
HOURLY CHART
Click chart to enlarge.
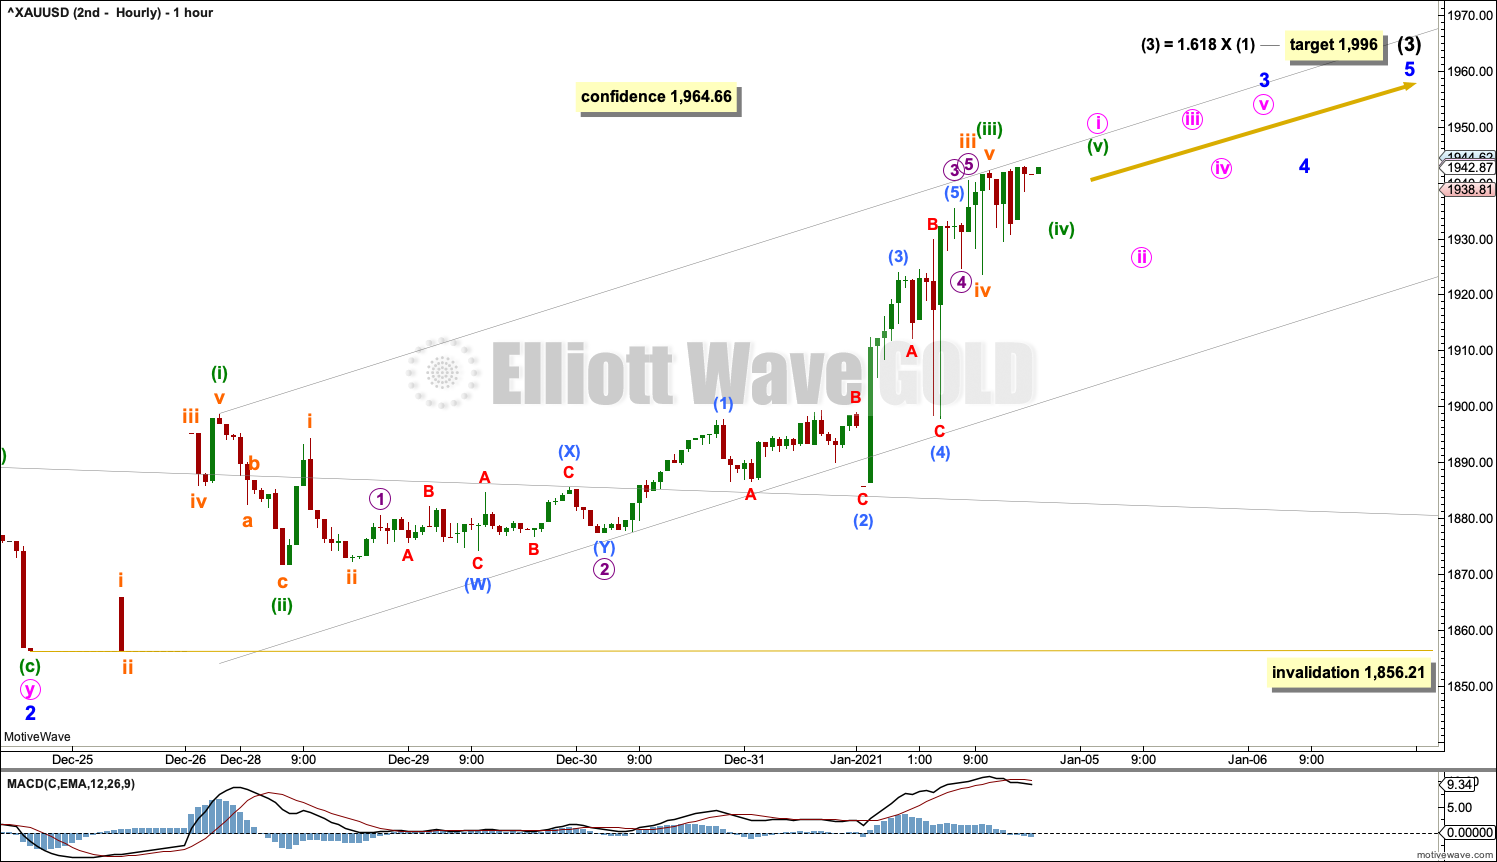
Minute wave i within minor wave 3 may be close to completion. Draw a best fit channel about minute wave i as shown. While price remains within this channel, assume minute wave i may continue higher. If this channel is breached by downwards movement, then minute wave i may be complete and minute wave ii may have begun.
Minute wave ii may not move beyond the start of minute wave i below 1,856.21.
TECHNICAL ANALYSIS
WEEKLY CHART
Click chart to enlarge. Chart courtesy of StockCharts.com.
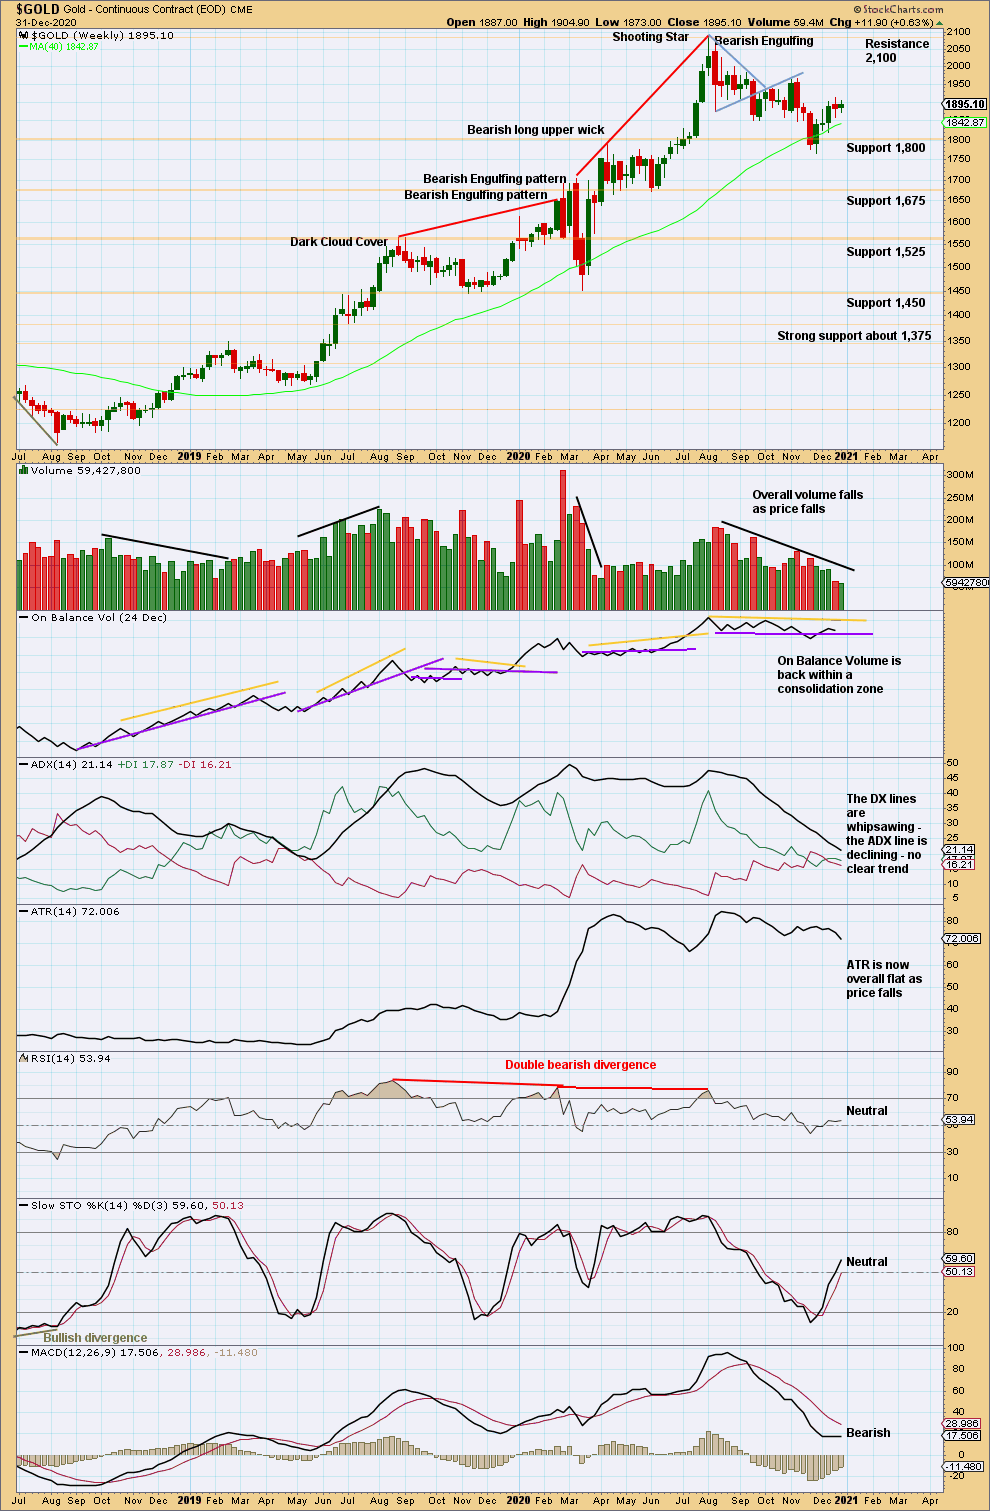
At the last high were two bearish candlestick patterns with overbought RSI exhibiting double bearish divergence. It is possible there may have been a 180° trend change at the high. A new swing low below 1,671.70 would add confidence in that view.
Downwards movement to the last low has relieved extreme conditions; it is also possible that the bull market for Gold has resumed. A new short-term swing high above 1,966.10 would add confidence in this view.
DAILY CHART
Click chart to enlarge. Chart courtesy of StockCharts.com.
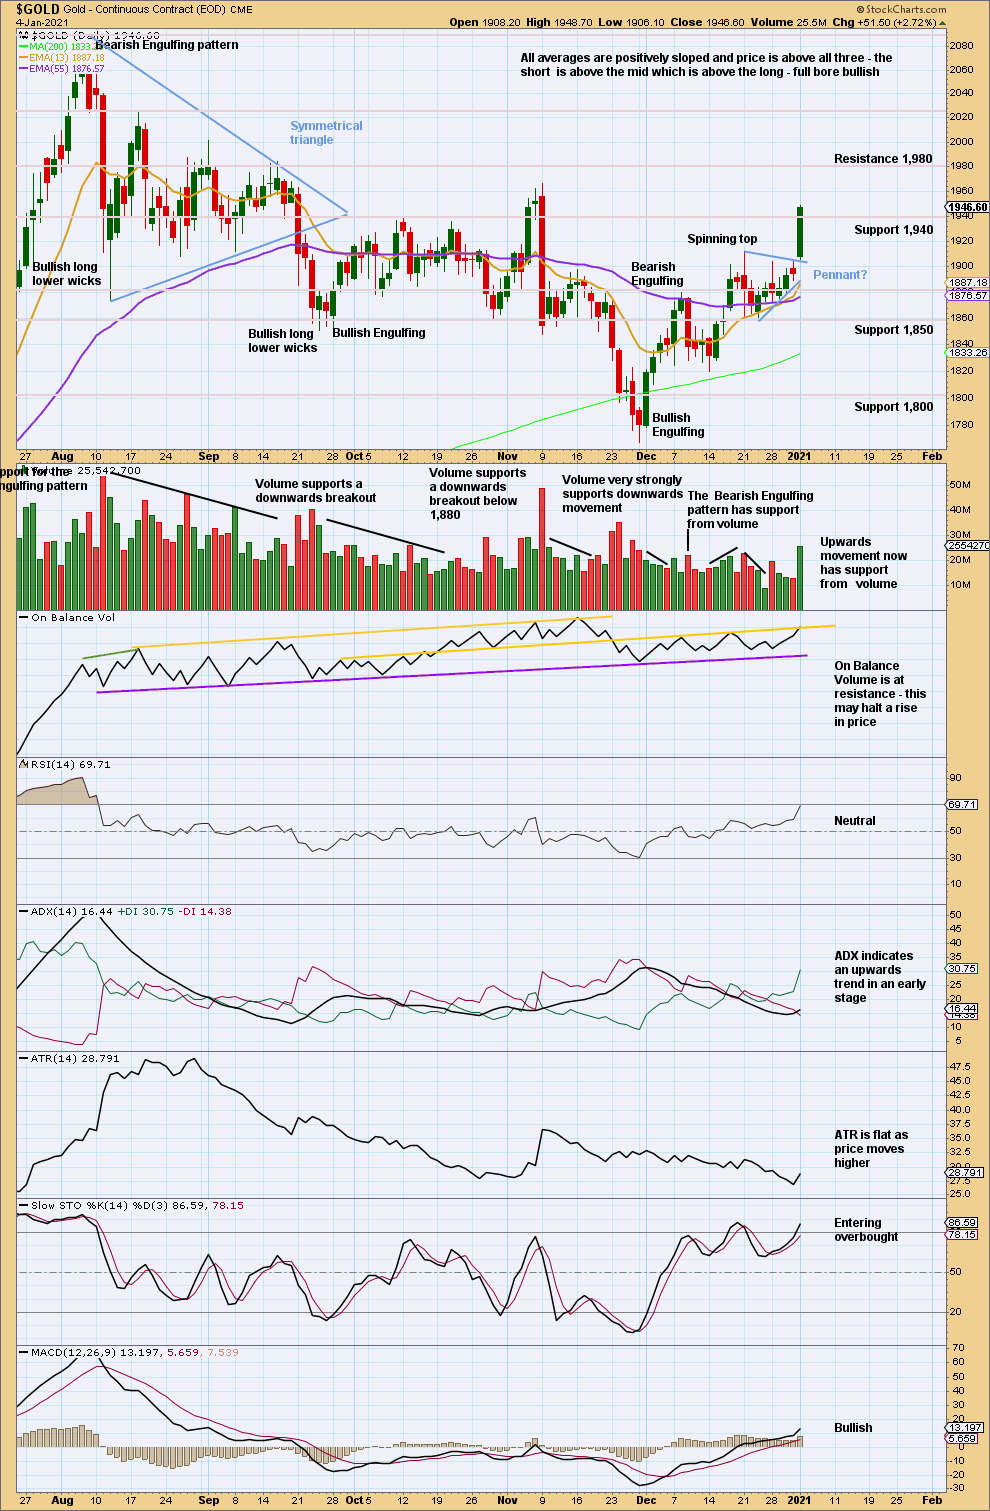
Today has seen an upwards breakout from the pennant pattern on an upwards day that has support from volume. A target calculated from the flag pole would be at 1,994.
From the high on August 7, 2020, there has been a series of lower lows and lower highs. If the last swing high at 1,966.10 on the 9th of November is breached, then a new swing high would shift the trend from down to up. ADX now indicates an upwards trend. There is plenty of room for this trend to continue before it reaches extreme.
GDX WEEKLY CHART
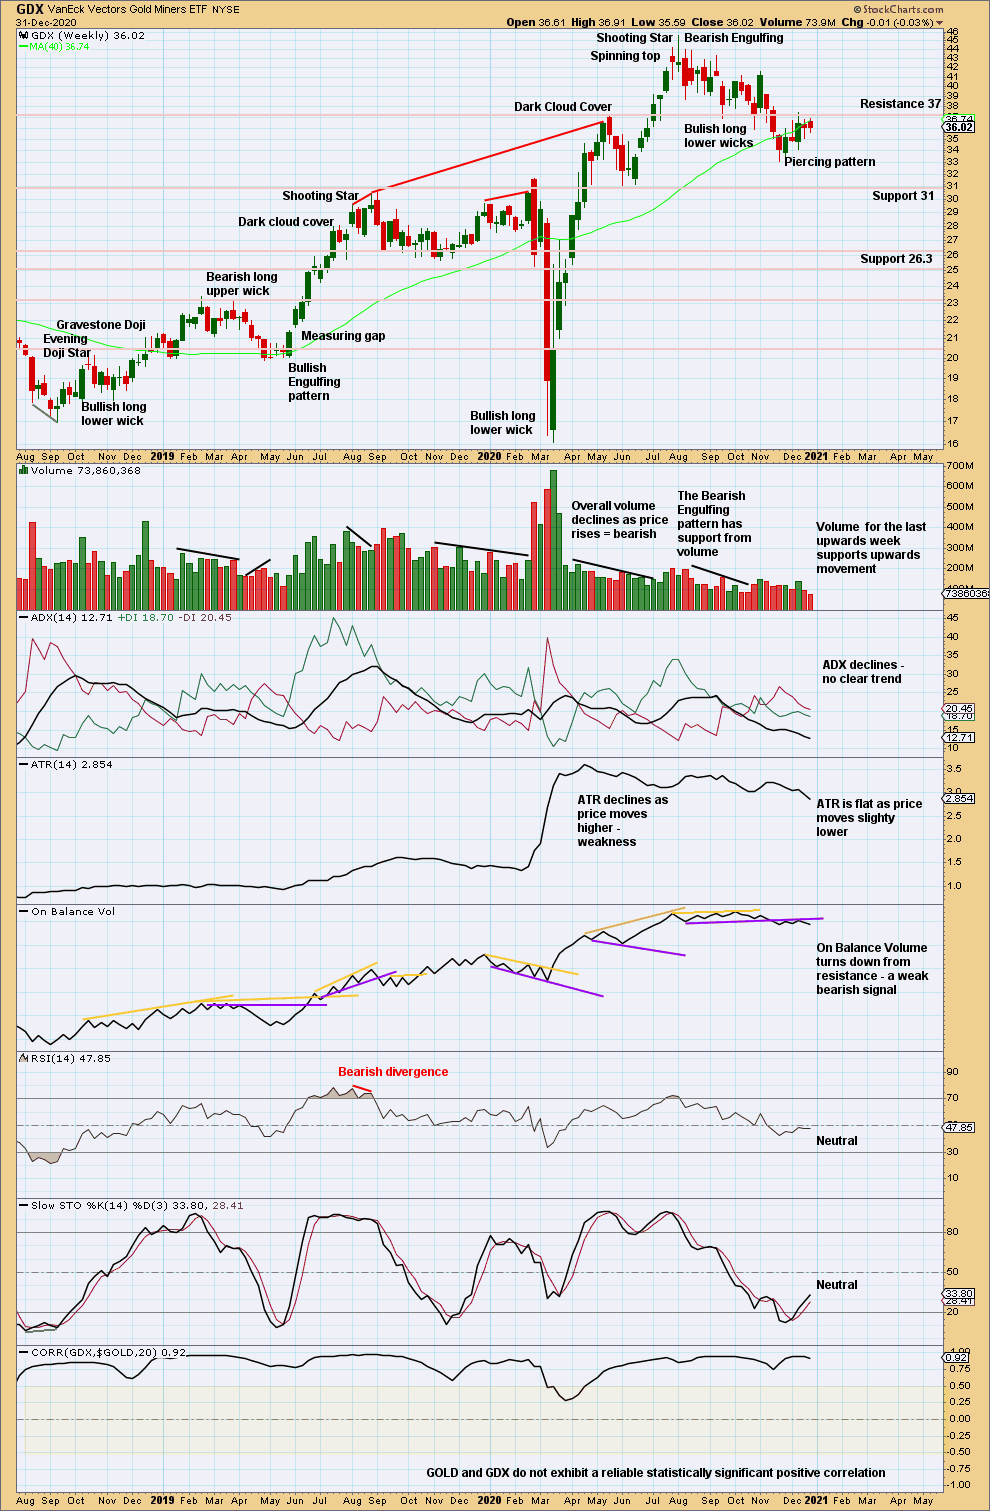
Click chart to enlarge. Chart courtesy of StockCharts.com.
If GDX makes a new swing high above 41.81 and On Balance Volume breaks above resistance, then the pullback of the last several weeks may be considered over. Last week both price and On Balance Volume remain below resistance.
GDX DAILY CHART
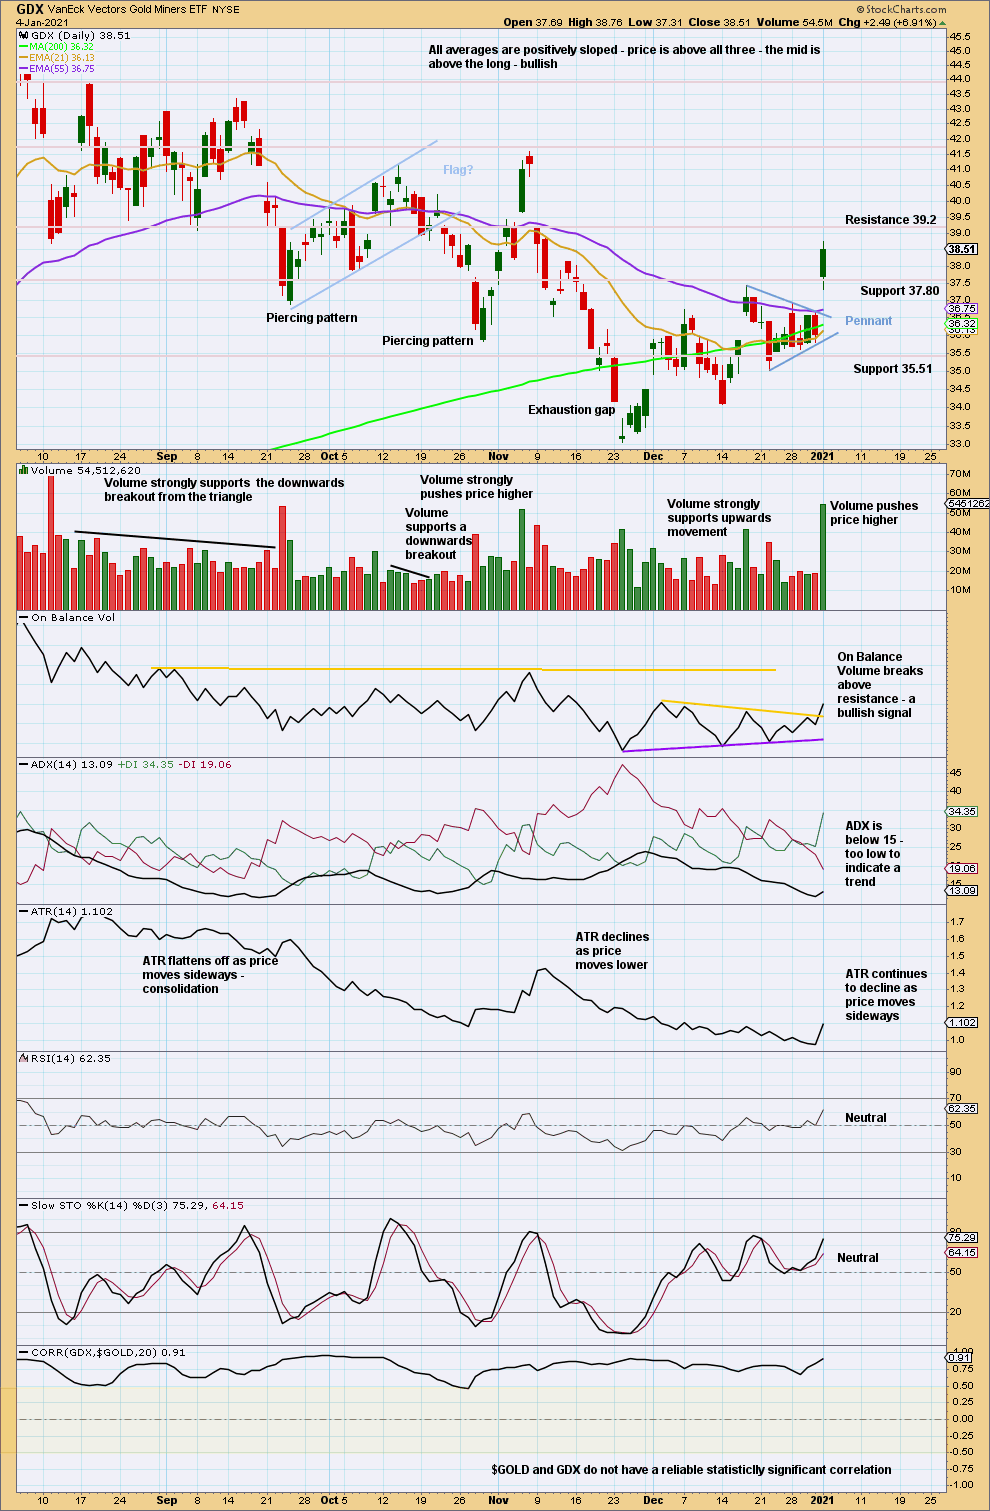
Click chart to enlarge. Chart courtesy of StockCharts.com.
Overall, from the high on August 5th, there is still a series of lower lows and lower highs, the basic definition of a downwards trend. For this view to change a new high above 41.81 would have to be seen.
An upwards breakout today from the pennant pattern gives confidence to a target at 39.96.
Published @ 08:22 p.m. ET.
—
Careful risk management protects your trading account(s).
Follow my two Golden Rules:
1. Always trade with stops.
2. Risk only 1-5% of equity on any one trade.
—
New updates to this analysis are in bold.