
GOLD: Elliott Wave and Technical Analysis | Charts – January 8, 2021
Another strong downwards week after price remained just below the invalidation point favours the first Elliott wave count.
Both Elliott wave counts remain valid.
An open mind and objective stance are still required in this current market.
Summary: The first wave count is bearish for the bigger picture and has only one daily chart. This wave count expects a multi-year bear market may be in its early stages to end below 1,046. A short-term target is at 1,645. A long-term target is at 657. Some confidence may be had in this bearish wave count if price makes a new low below 1,766.53. This wave count may be discarded if price makes a new high above 1,964.66.
The second wave count is bullish for the bigger picture. It now expects that the pullback was over at the last low and the bull market for Gold has resumed to a new mid-term target at 2,141 and thereafter a final target at 2,182.
Grand SuperCycle analysis is here.
Last analysis of monthly charts is here.
FIRST ELLIOTT WAVE COUNT
WEEKLY CHART
Click chart to enlarge.
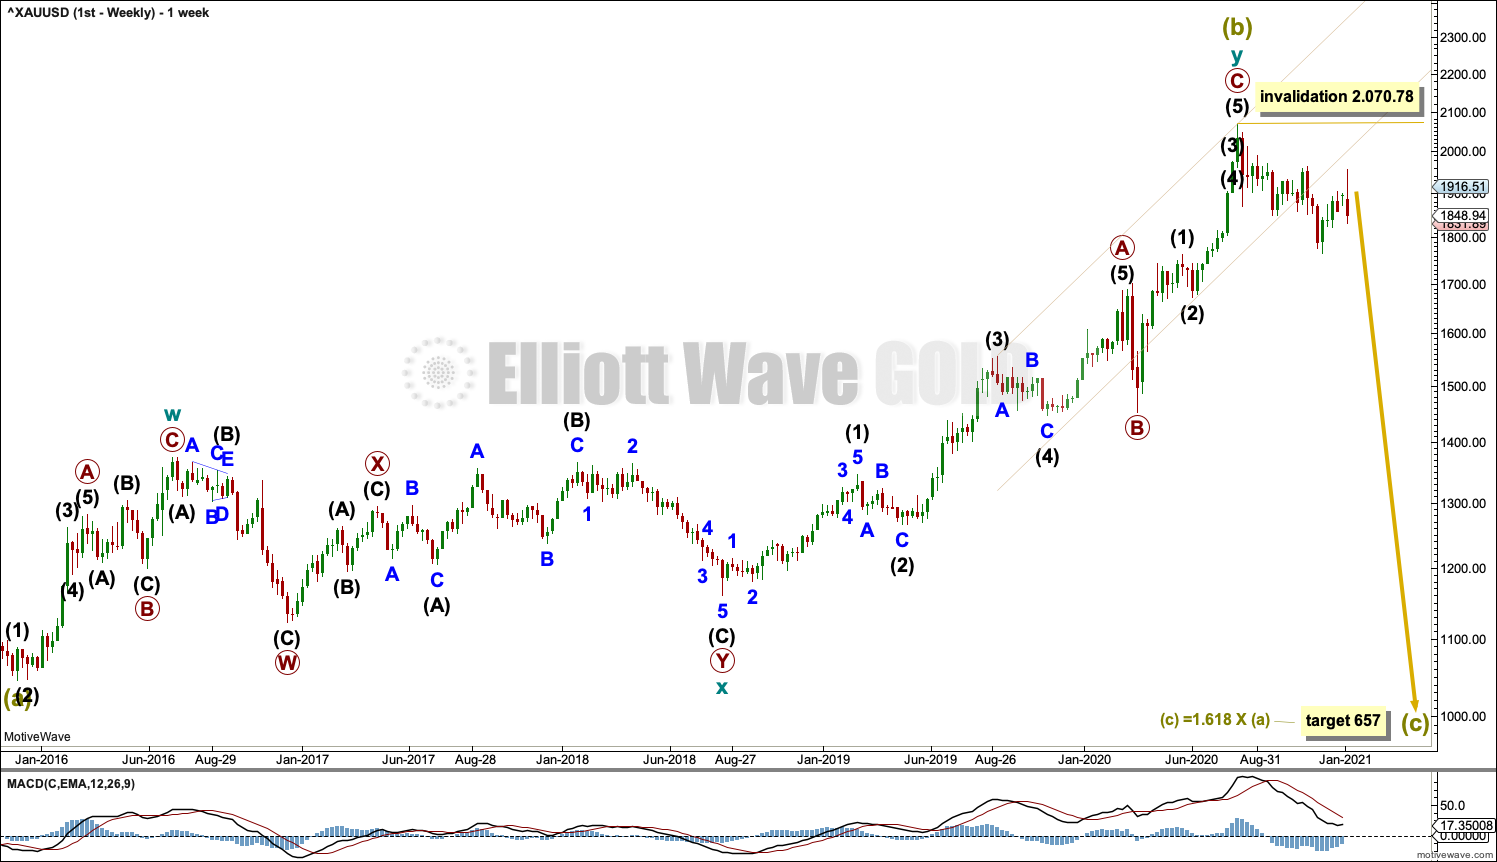
The bigger picture for this first Elliott wave count sees Gold as still within a bear market, in a three steps back pattern that is labelled Grand Super Cycle wave IV on monthly charts. Grand Super Cycle wave IV may be subdividing as an expanded flat pattern.
Super Cycle wave (b) within Grand Super Cycle wave IV may be a complete double zigzag. This wave count expects Super Cycle wave (c) to move price below the end of Super Cycle wave (a) at 1,046.27 to avoid a truncation and a very rare running flat. The target calculated expects a common Fibonacci ratio for Super Cycle wave (c).
The first zigzag in the double is labelled cycle wave w. The double is joined by a three in the opposite direction, a combination labelled cycle wave x. The second zigzag in the double is labelled cycle wave y.
The purpose of the second zigzag in a double is to deepen the correction. Cycle wave y has achieved this purpose.
A best fit channel is drawn about primary wave C to contain as much of this movement as possible. This channel is now clearly breached, which suggests the upwards wave labelled cycle wave y may be over.
DAILY CHART
Click chart to enlarge.
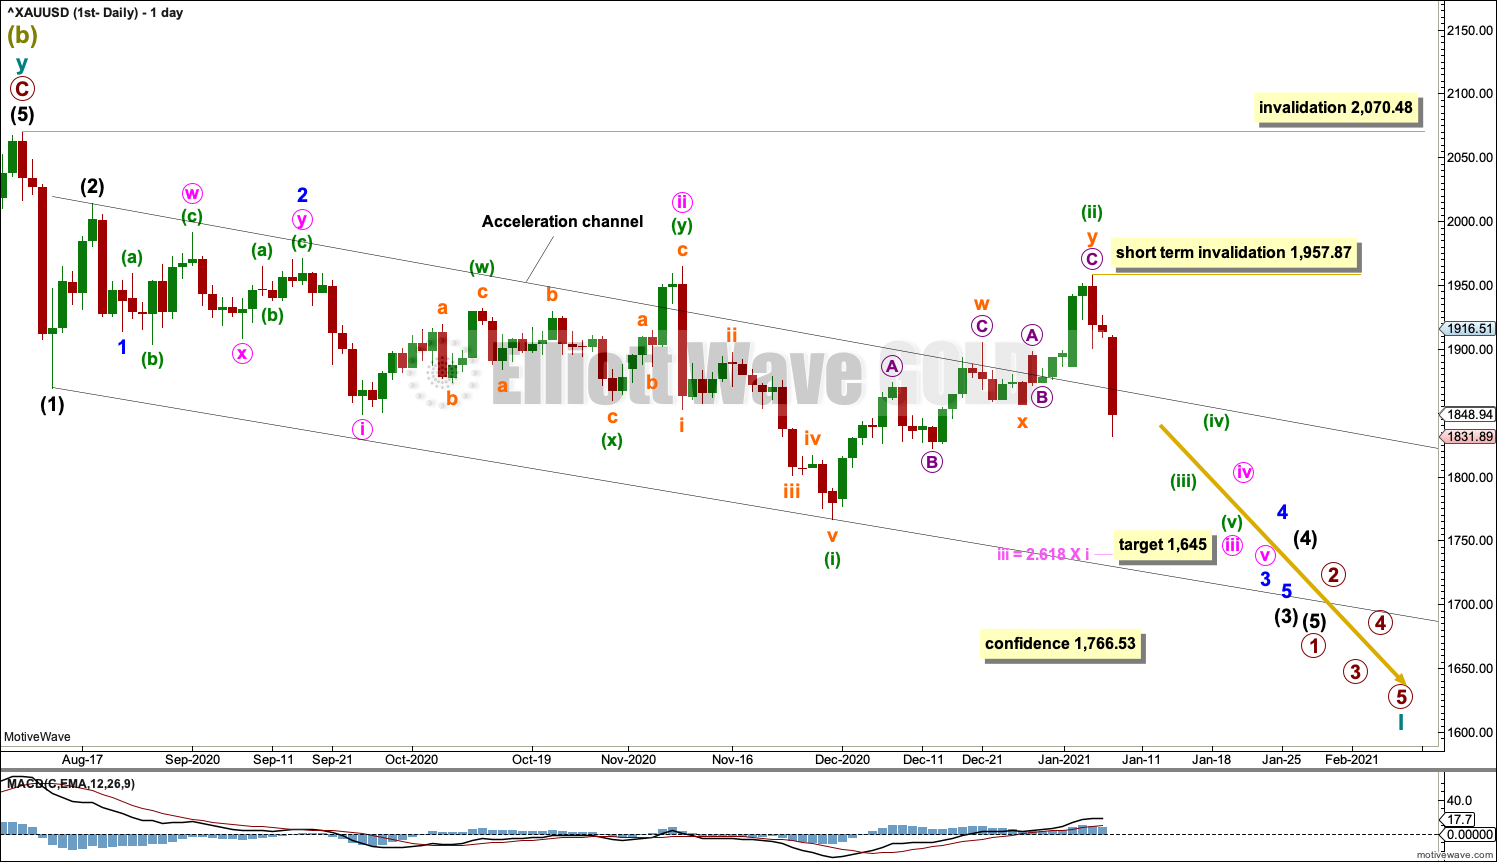
Within a new bear market, primary wave 1 may be an incomplete five wave impulse.
Primary wave 2 within the new downwards trend may not move beyond the start of primary wave 1 above 2,070.48.
Gold typically exhibits extended and strong fifth waves; this tendency is especially prevalent for fifth waves to end third wave impulses one degree higher. One or more of minuette wave (v), minute wave v and minor wave 5 may exhibit this tendency; there may be one or more selling climaxes along the way down. Minute wave iv and minor wave 4 may be relatively brief and shallow.
Draw an acceleration channel about downwards movement and keep redrawing the channel as price makes new lows. Draw the first trend line from the end of intermediate wave (1) to the last low, then place a parallel copy on the end of intermediate wave (2). When intermediate wave (3) may be complete, then this channel would be drawn using Elliott’s technique about primary wave 1. The upper edge of this channel has again been breached. The upper edge of this channel was breached at the end of minute wave ii and yet price continued lower from there; the upper edge of the channel may not perfectly show were price finds resistance. This is common for Gold early in a new trend as its impulses are often curved in form with deep and time consuming second wave corrections. If the lower edge of the channel is breached, then it would indicate a third wave down underway.
Minuette wave (ii) may have continued higher as a double zigzag. No second wave correction within minuette wave (iii) may move beyond its start above 1,957.87.
A new low below 1,766.53 would add reasonable confidence to this wave count.
HOURLY CHART

Click chart to enlarge.
Subminuette wave i to start minuette wave (iii) may be complete at the low for this week. It has a typical curved look of Gold’s impulses.
Subminuette wave ii may be more shallow than second waves often are as the downwards pull of the middle of a third wave forces it to be. A preferred target for subminuette wave ii may be the 0.382 Fibonacci ratio of subminuette wave i at 1,880.01.
Subminuette wave ii may not move beyond the start of subminuette wave i above 1,957.87.
SECOND ELLIOTT WAVE COUNT
WEEKLY CHART
Click chart to enlarge.
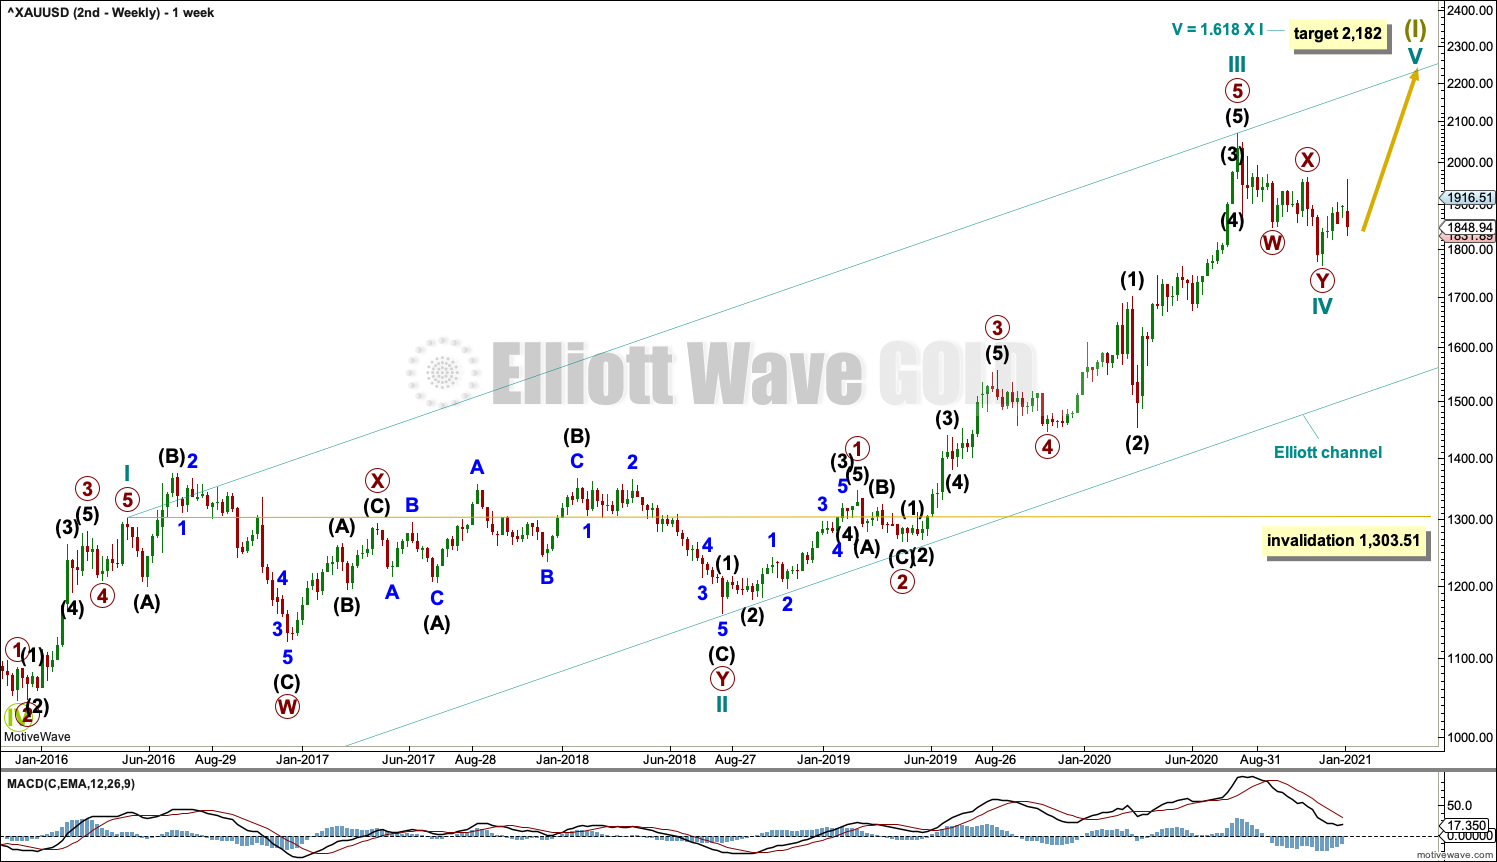
This wave count sees the the bear market complete at the last major low for Gold on 3 December 2015.
If Gold is in a new bull market, then it should begin with a five wave structure upwards on the weekly chart.
Cycle wave I fits as a five wave impulse with reasonably proportionate corrections for primary waves 2 and 4.
Cycle wave II fits as a double flat. However, within the first flat correction labelled primary wave W, this wave count needs to ignore what looks like an obvious triangle from July to September 2016 (this can be seen labelled as a triangle on the first wave count above). This movement must be labelled as a series of overlapping first and second waves. Ignoring this triangle reduces the probability of this wave count in Elliott wave terms.
Cycle waves III and IV may be complete.
Cycle wave IV may be a complete double zigzag. It is also possible that cycle wave IV may continue sideways as a flat or lower as a triple zigzag. For this reason the invalidation point is at the end of cycle wave I. Cycle wave IV may not move into cycle wave I price territory below 1,303.51.
Draw an Elliott channel about this impulse as shown. Cycle wave V may find resistance about the upper edge.
DAILY CHART
Click chart to enlarge.
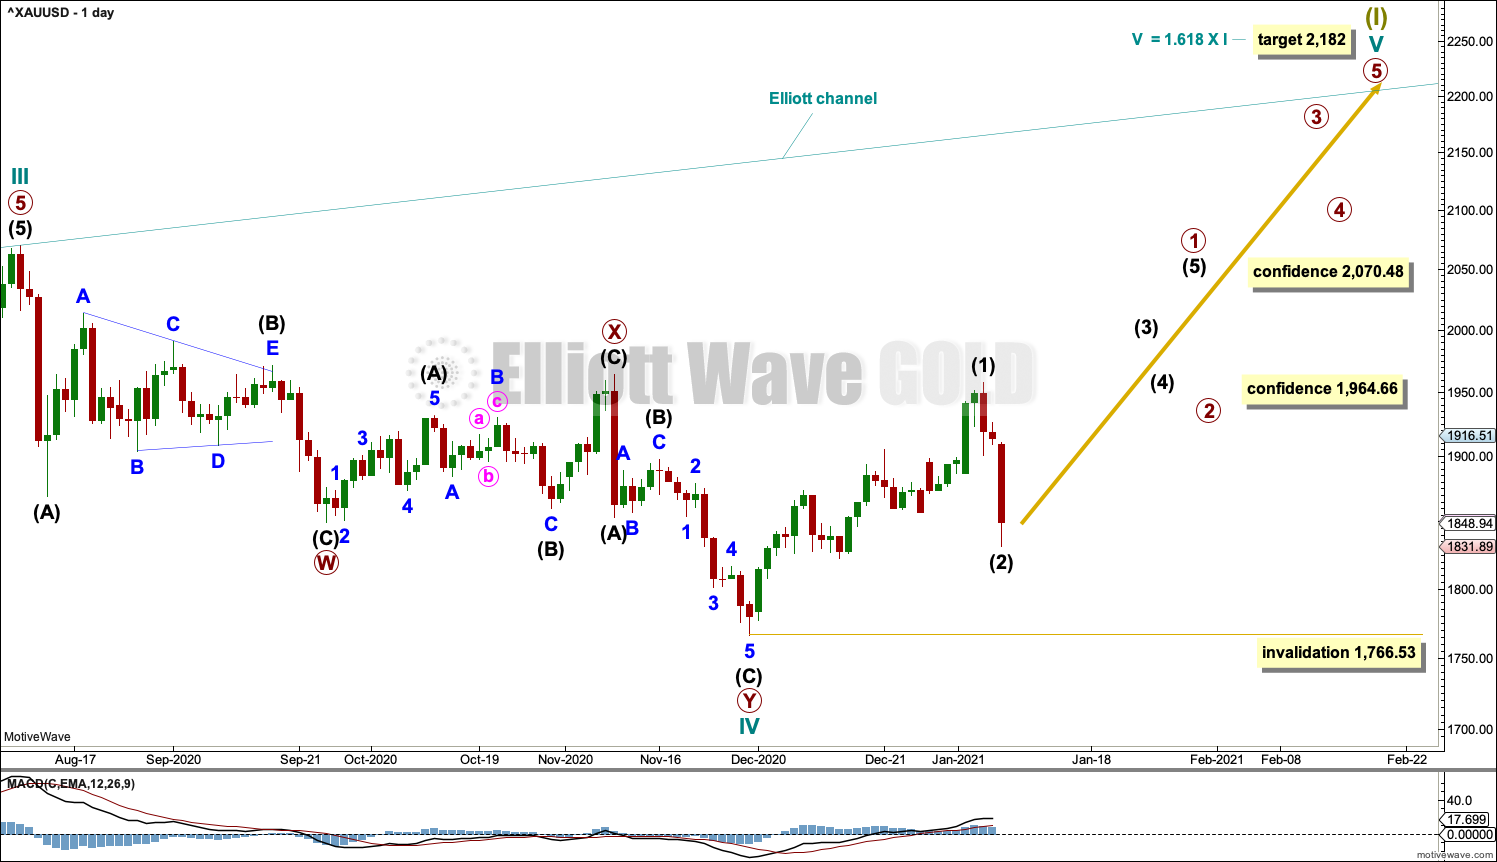
Cycle wave IV may be over as a double zigzag.
A new swing high above 1,964.66 would add reasonable confidence to this wave count. Finally, a new all time high would add strong confidence to this wave count.
If cycle wave IV is complete, then it would have lasted only 17 weeks compared to 119 weeks for cycle wave II. While it is normal for Gold to exhibit fourth waves that are more brief than their counterpart second waves, a difference this great is unusual. This reduces the probability of this wave count.
When primary wave 1 within cycle wave V is complete, then primary wave 2 may not move beyond the start of primary wave 1 below 1,766.53.
Intermediate wave (1) may have ended at this week’s high. Intermediate wave (1) will subdivide on lower time frames as a five wave structure, but at the daily chart level it does not look like a normal five wave impulse, which reduces the probability of this wave count.
Downwards movement over the last few days may be intermediate wave (2). Intermediate wave (2) may not move beyond the start of intermediate wave (1) below 1,766.53.
HOURLY CHART

Click chart to enlarge.
Intermediate wave (2) may be a complete zigzag, ending close to the 0.618 Fibonacci ratio of intermediate wave (1).
Draw a best fit channel about intermediate wave (2). If the upper edge is breached by upwards movement, then that may indicate the pullback for intermediate wave (2) may be over and a third wave up may then be underway. A breach of this channel does not confirm this wave count; both wave counts would still remain valid.
TECHNICAL ANALYSIS
WEEKLY CHART
Click chart to enlarge. Chart courtesy of StockCharts.com.
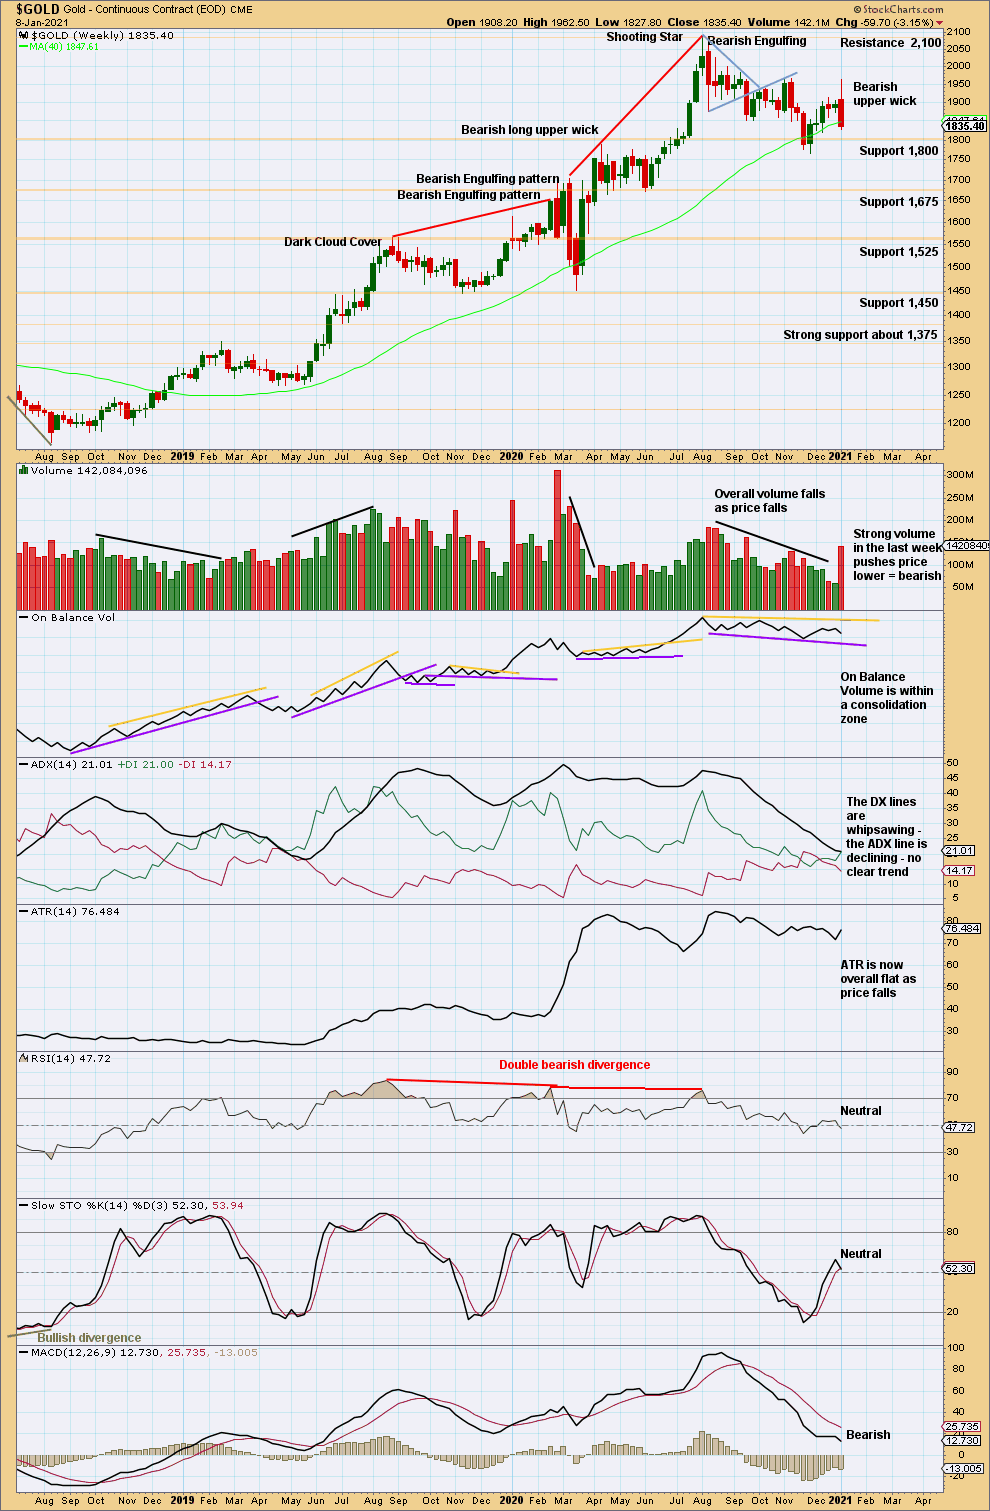
At the last high were two bearish candlestick patterns with overbought RSI exhibiting double bearish divergence. It is possible there may have been a 180° trend change at the high. A new swing low below 1,671.70 would add confidence in that view.
To end this week the series of lower swing highs and lower swing lows continues. Importantly, this week’s upwards movement could not exceed the last swing high at 1,966.10. The week ends with strong volume and a bearish upper wick.
DAILY CHART
Click chart to enlarge. Chart courtesy of StockCharts.com.
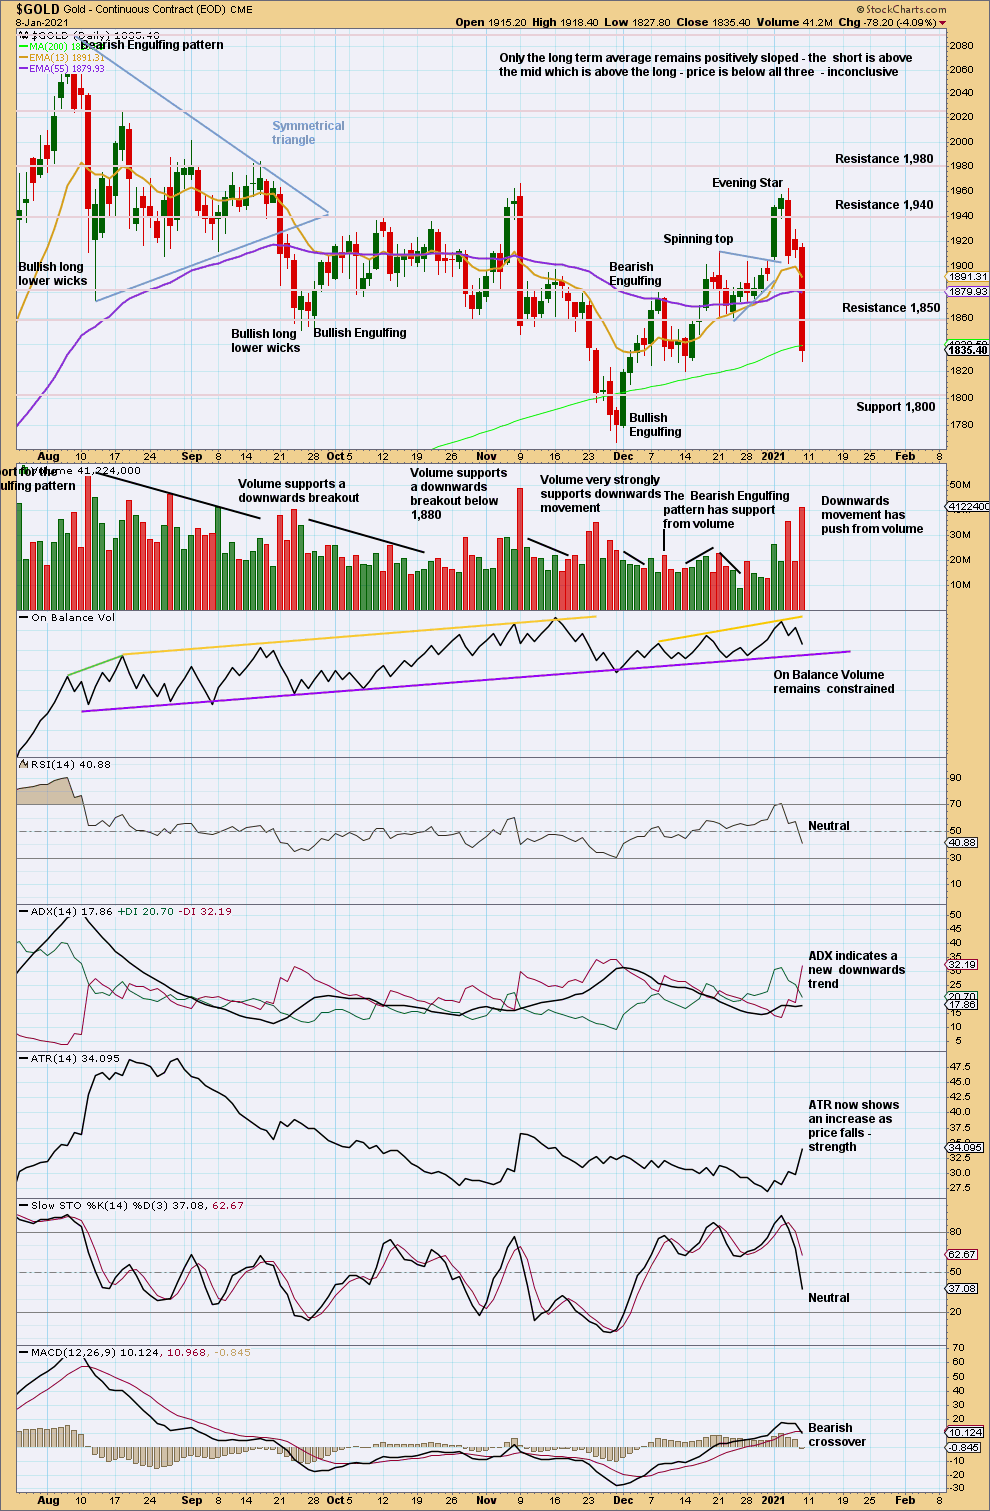
From the high on August 7, 2020, there has been a series of lower lows and lower highs. The last swing high at 1,966.10 on the 9th of November remains intact.
There is strength in downwards movement with push from volume and increasing ATR. ADX gives a strong bearish signal.
GDX WEEKLY CHART
Click chart to enlarge. Chart courtesy of StockCharts.com.
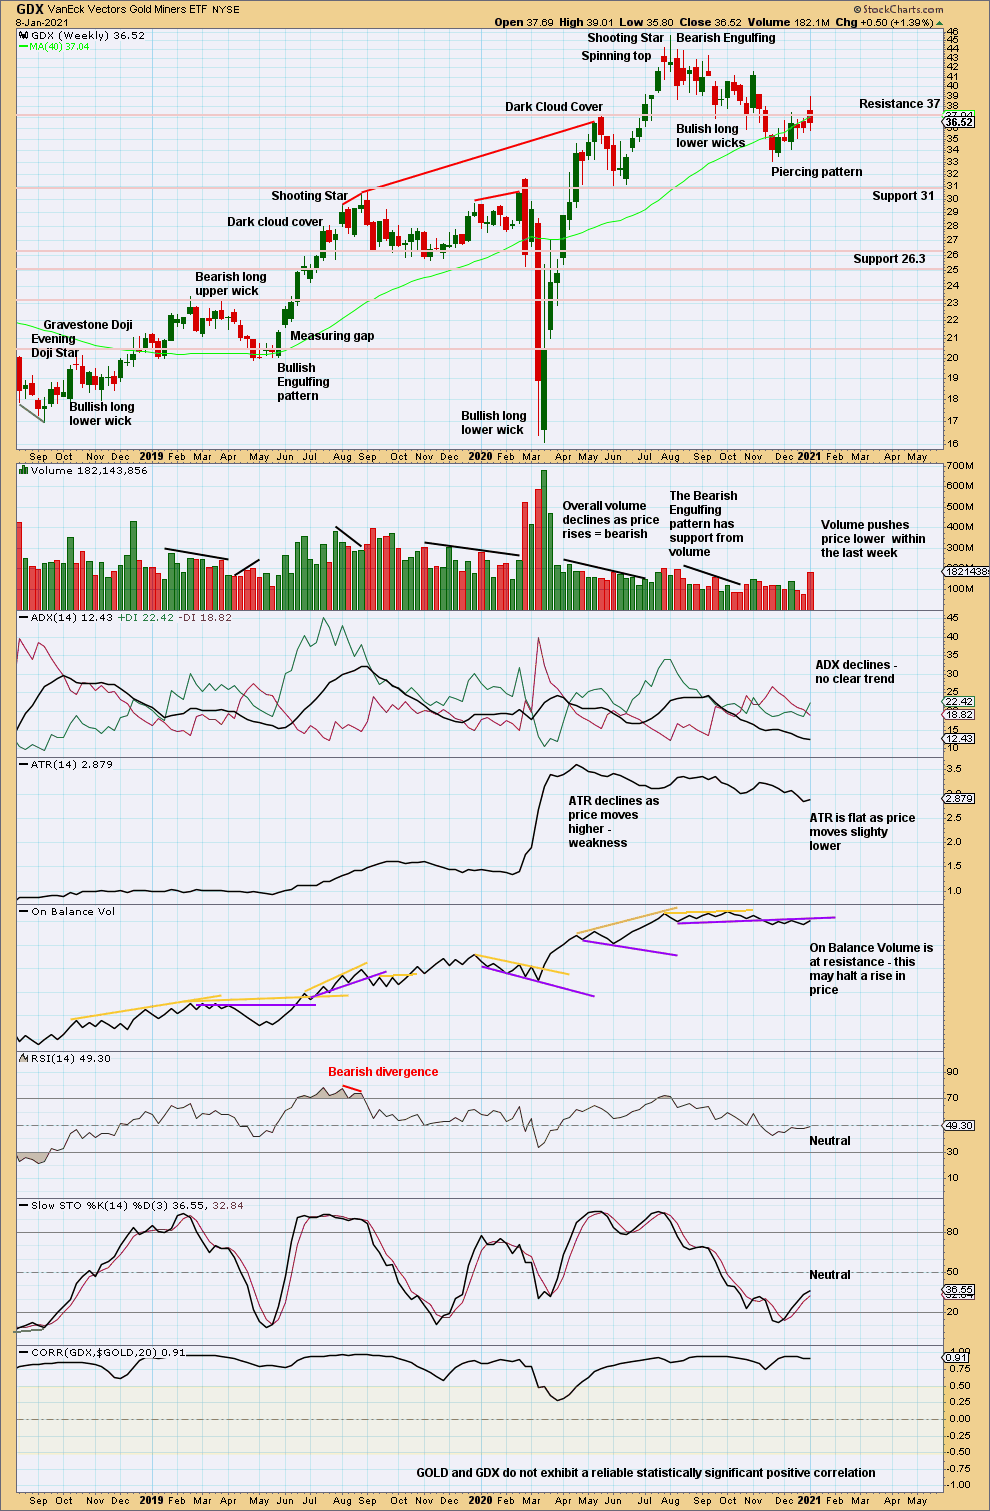
If GDX makes a new swing high above 41.59 and On Balance Volume breaks above resistance, then the pullback of the last several weeks may be considered over. This week price remains below the last swing high, and On Balance Volume remains below resistance.
GDX DAILY CHART
Click chart to enlarge. Chart courtesy of StockCharts.com.
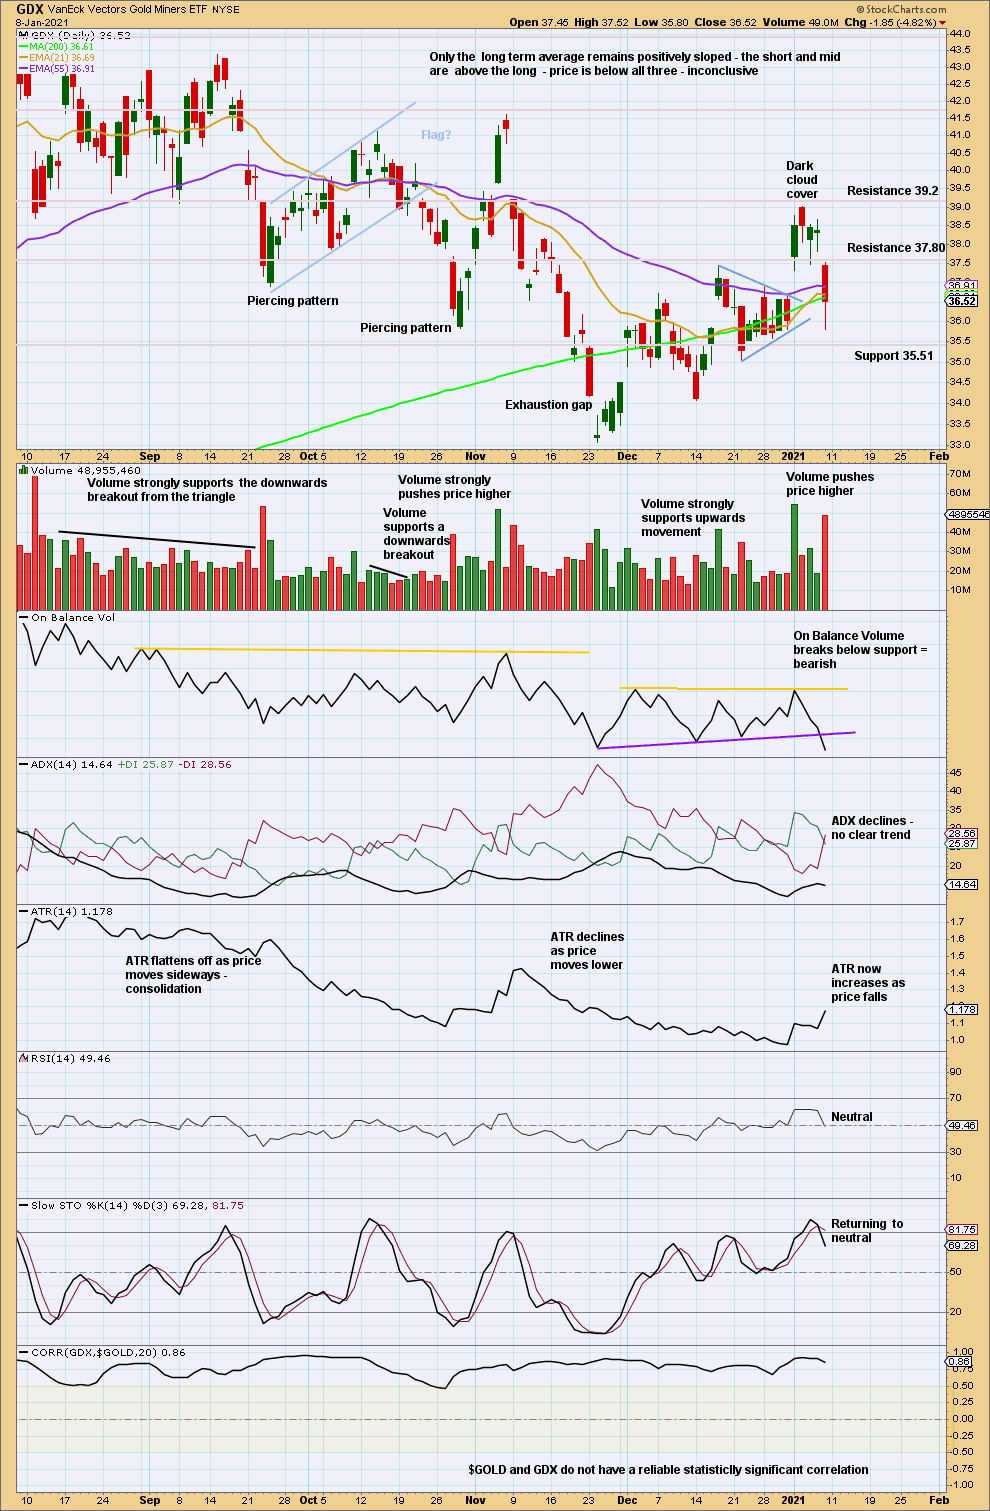
Overall, from the high on August 5th, there is still a series of lower lows and lower highs, the basic definition of a downwards trend. For this view to change a new high above 41.59 would have to be seen.
A new low below 36.68 has closed the last gap and is bearish.
Published @ 06:35 p.m. ET.
—
Careful risk management protects your trading account(s).
Follow my two Golden Rules:
1. Always trade with stops.
2. Risk only 1-5% of equity on any one trade.
—
New updates to this analysis are in bold.