
US OIL: Elliott Wave and Technical Analysis | Charts – January 8, 2021
The upwards trend was expected to continue. Price continues to move higher towards the Elliott wave target.
Summary: An upwards trend may continue. A short-term classic analysis target from a pennant pattern is at 53.03. A new short-term Elliott wave target is at 55.40, where a pullback or consolidation to last at least two weeks may begin.
A longer-term target for a third wave is at 87.90 or 121.43.
Oil may have found a major sustainable low in April 2020.
ELLIOTT WAVE COUNT
MONTHLY CHART
Click chart to enlarge.
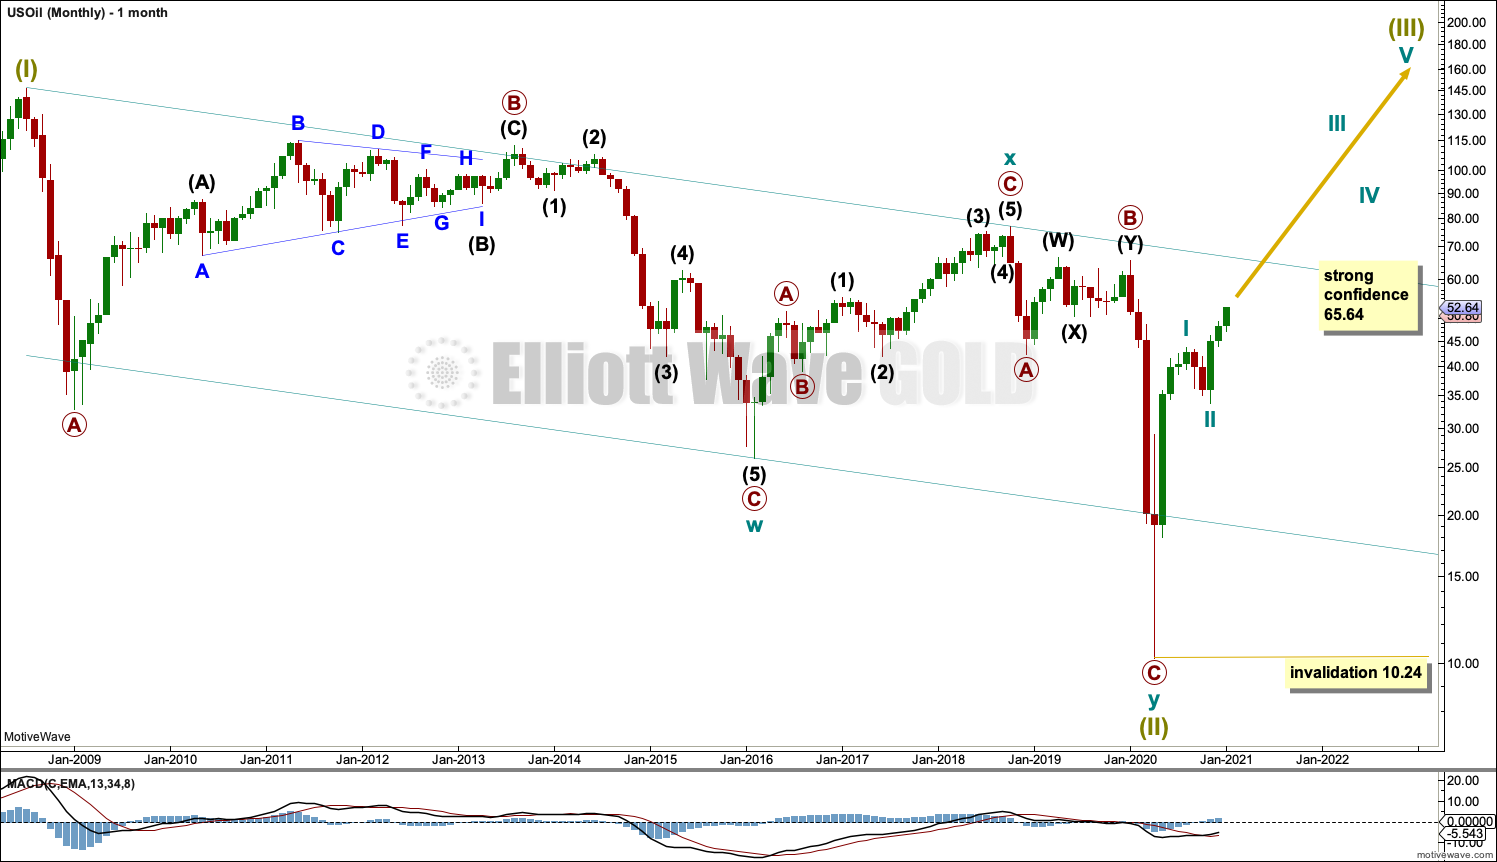
The basic Elliott wave structure is five steps forward and three steps back. This Elliott wave count expects that US Oil has completed a three steps back pattern, which began in July 2008. The Elliott wave count expects that the bear market for US Oil may now be over.
Following Super Cycle wave (III), which was a correction (three steps back), Super Cycle wave (III), which may have begun, should be five steps up when complete. Super Cycle wave (III) may last a generation and must make a new high above the end of Super Cycle wave (I) at 146.73.
A channel is drawn about Super Cycle wave (II): draw the first trend line from the start of cycle wave w to the end of cycle wave x, then place a parallel copy on the end of cycle wave w. This trend line is breached, which is a typical look for the end of a movement for a commodity.
The upper edge of the channel may provide resistance.
Super Cycle wave (III) may only subdivide as a five wave impulse. New trends for Oil usually start out very slowly with short first waves and deep time consuming second wave corrections. However, while this is a common tendency, it is not always seen and may not have been seen in this instance. The first reasonably sized pullback may be over already.
WEEKLY CHART

Click chart to enlarge.
Super Cycle wave (III) must subdivide as an impulse. Cycle wave I within the impulse may be complete. Cycle wave II may also now be complete, and cycle wave III upwards may now have begun. If cycle wave II continues lower, then it may not move beyond the start of cycle wave I below 10.24.
This week there is only one daily chart following this main weekly chart. An alternate is presented below on a weekly chart.
DAILY CHART
Click chart to enlarge.
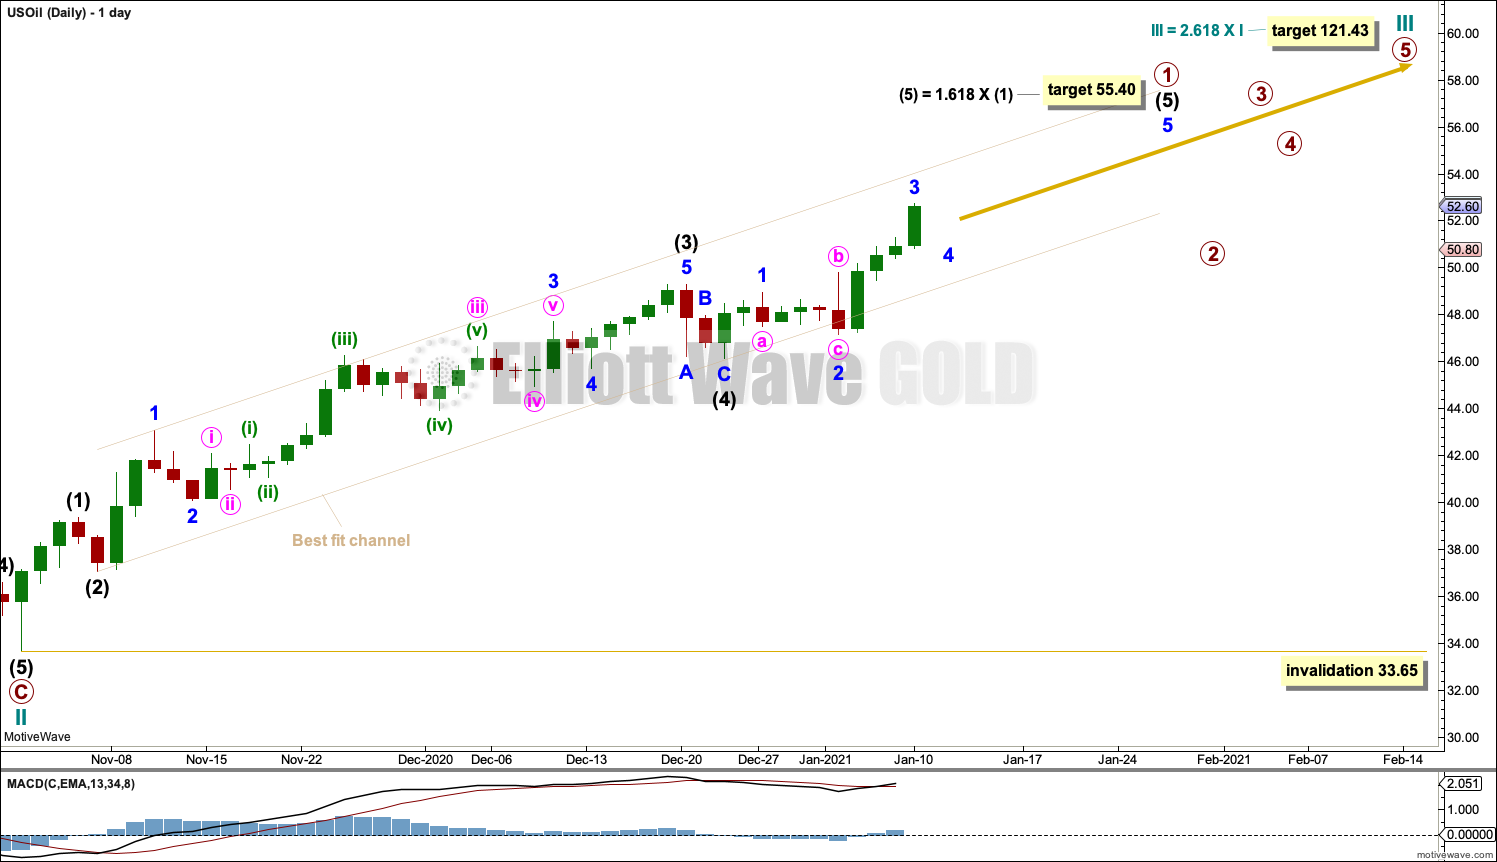
Cycle wave III may only subdivide as an impulse. Within the impulse: Primary wave 1 may be incomplete, and primary wave 2 may not move beyond the start of primary wave 1 below 33.65.
Intermediate wave (4) may have continued as a small zigzag. Intermediate wave (5) may have begun.
Intermediate wave (5) must subdivide as a five wave motive structure, either an impulse or an ending diagonal. So far it looks like it may be unfolding as a more common impulse. Minor waves 1 and 2 within the impulse may be complete. Strong upwards movement to end this week may be minor wave 3 within intermediate wave (5).
Intermediate wave (5) has passed equality in length with intermediate wave (1), and the structure is incomplete. The next Fibonacci ratio in the sequence is used to calculate a new target for intermediate wave (5).
When primary wave 1 is complete, then a multi-week pullback or consolidation for primary wave 2 should begin. The best fit channel may help as a guide to when primary wave 1 may be over. When this channel is breached by at least one full daily candlestick of downwards movement below and not touching the lower edge, then it may indicate a trend change.
ALTERNATE WEEKLY CHART
Click chart to enlarge.
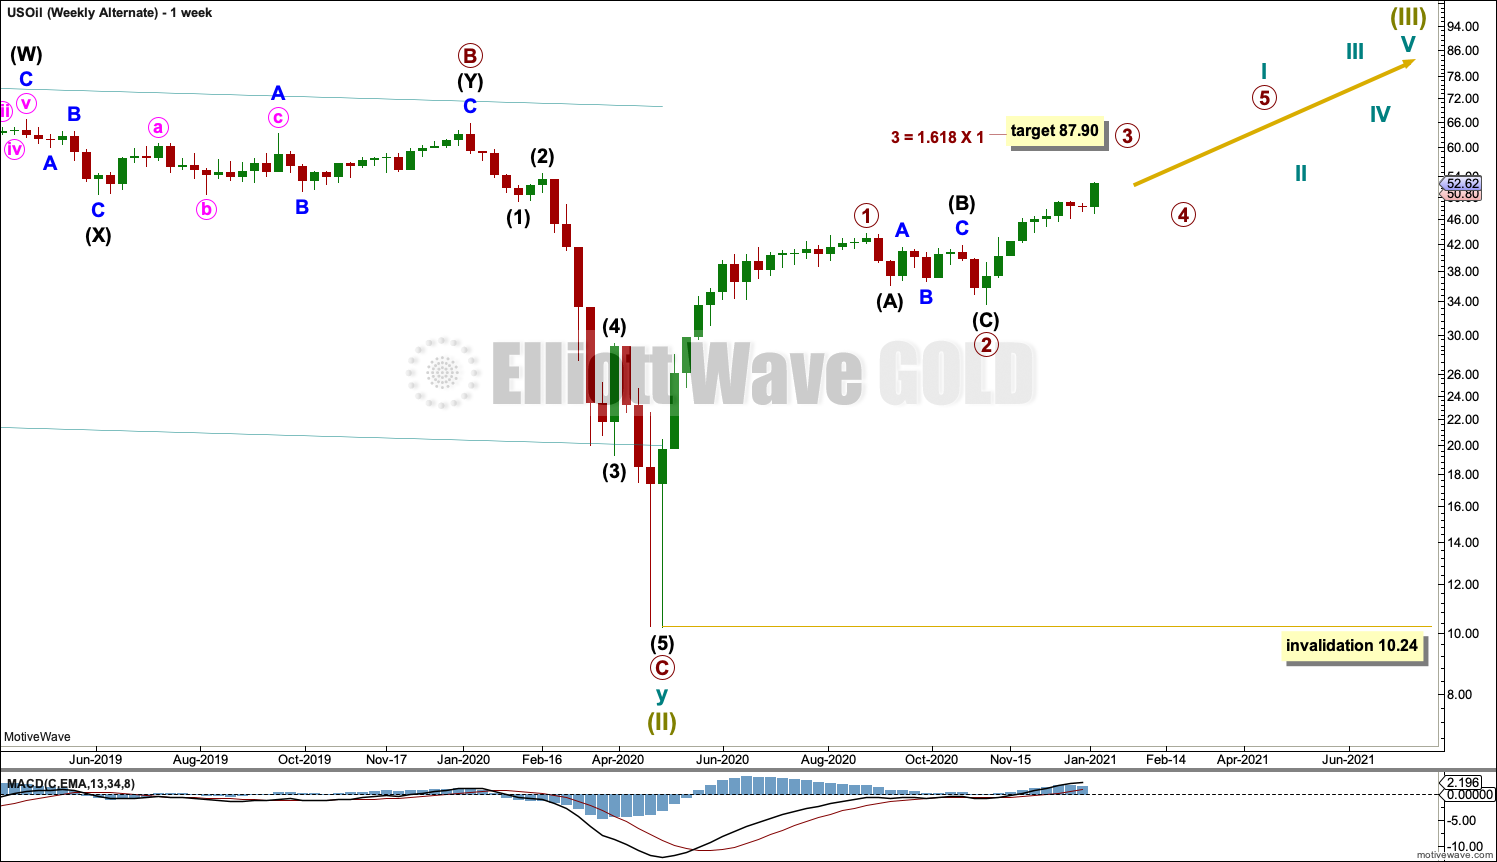
This alternate wave count moves the degree of labelling within the start of the bull market down one degree. It is possible that cycle wave I is incomplete.
The target for primary wave 3 is lower than the target on the first wave count.
TECHNICAL ANALYSIS
WEEKLY CHART
Click chart to enlarge. Chart courtesy of StockCharts.com.
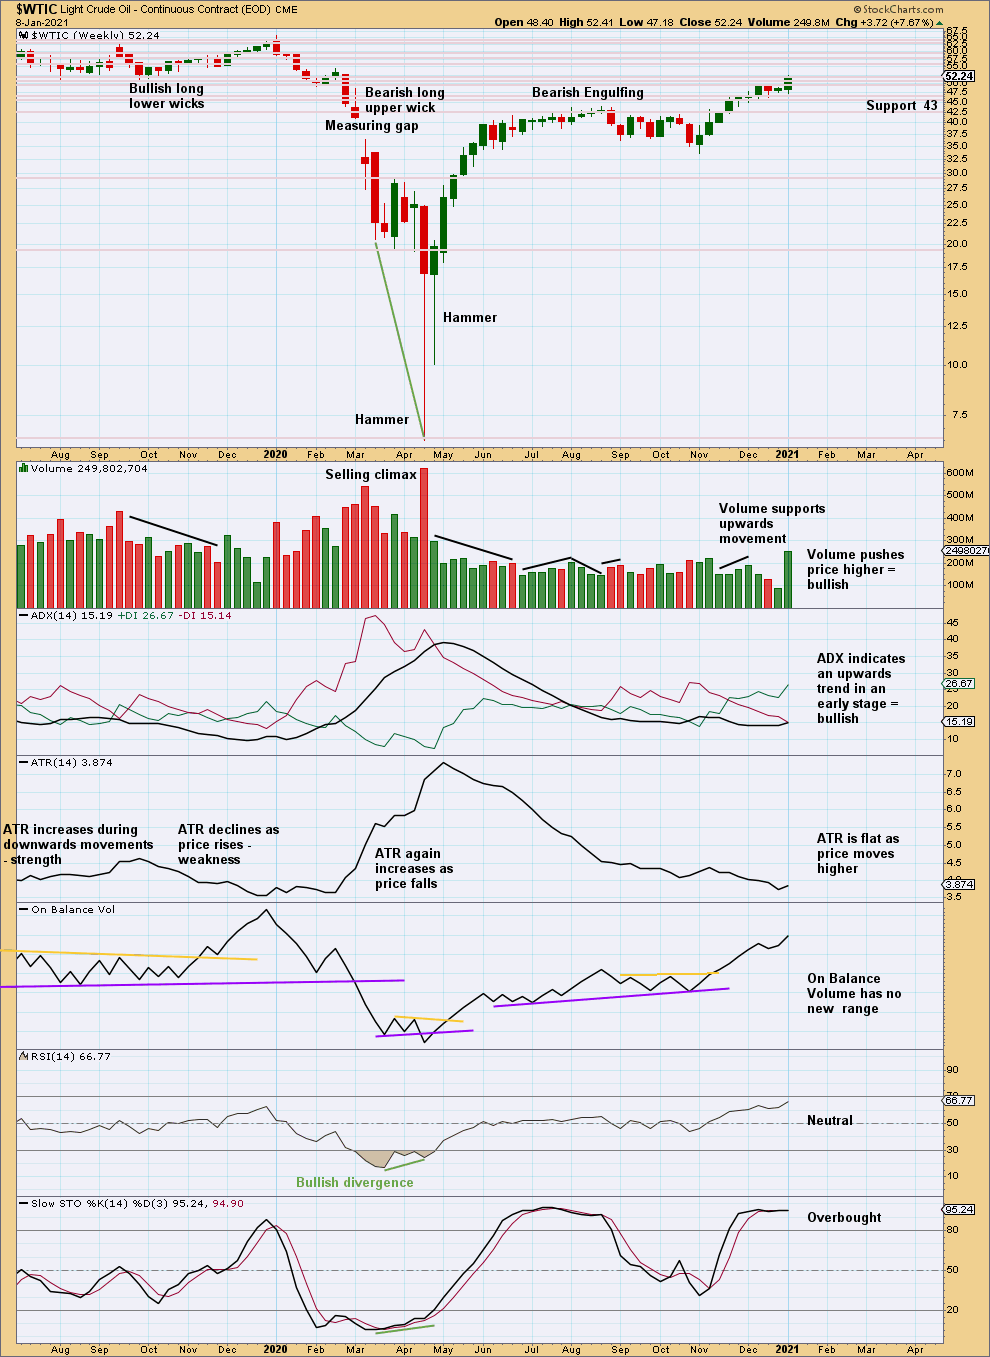
Price is within a cluster of resistance and support; this may slow it down.
ADX gives a strong bullish signal this week. There is a lot of room for an upwards trend to continue as RSI and ADX are not extreme.
DAILY CHART
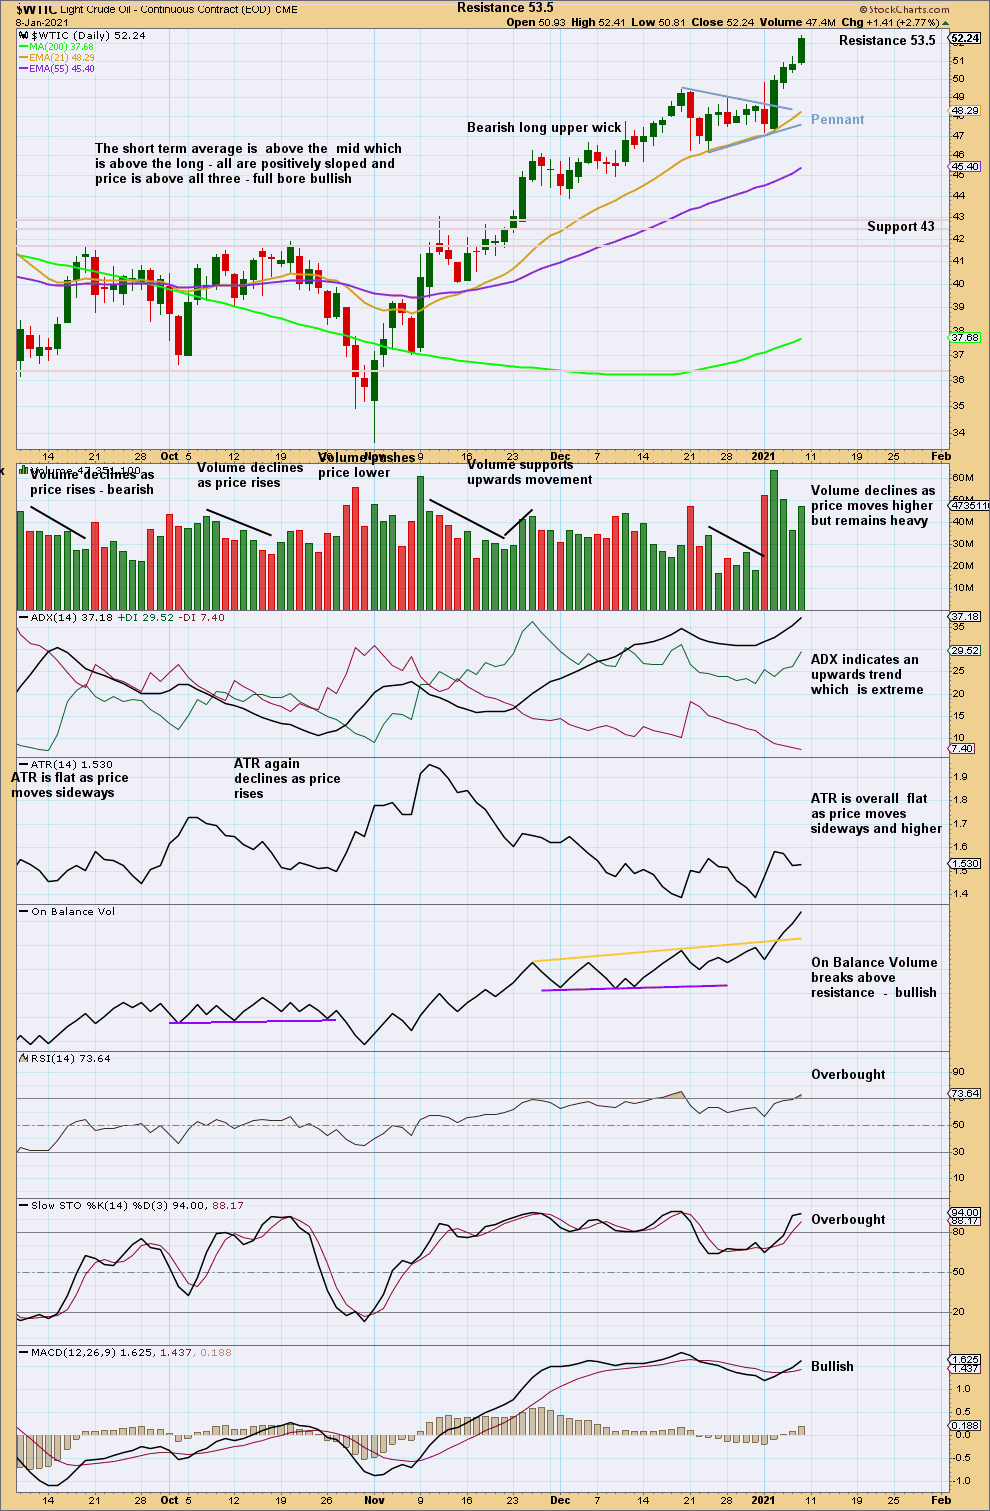
Click chart to enlarge. Chart courtesy of StockCharts.com.
A small pennant pattern may have completed. A target would be at 53.03.
At the daily chart level, this upwards trend is now extreme and RSI is overbought. However, this market can sustain extreme conditions for some time while price travels a reasonable distance. Look for a bearish candlestick pattern to indicate a trend change to down or sideways.
Published @ 06:17 p.m. ET.
—
Careful risk management protects your trading account(s).
Follow my two Golden Rules:
1. Always trade with stops.
2. Risk only 1-5% of equity on any one trade.
—
New updates to this analysis are in bold.