
GOLD: Elliott Wave and Technical Analysis | Charts – February 15, 2021
A very small range inside day today leaves the analysis the same.
Summary: The first wave count is bearish for the bigger picture and has only one daily chart. This wave count expects a multi-year bear market may be in its early stages to end below 1,046.
Downwards movement may increase in momentum. A short-term target is at 1,645. A long-term target is at 657. Some confidence may be had in this bearish wave count if price makes a new low below 1,766.53. This wave count may be discarded if price makes a new high above 1,957.87.
The second wave count is bullish for the bigger picture. It now expects that the pullback was over at the last low and the bull market for Gold has resumed to a new short-term target at 2,086, and with a mid-term target at 2,182. Confidence may be had in this second wave count if price makes a new high above 1,957.87.
For GDX, a target for downwards movement is calculated at 29.95.
Grand SuperCycle analysis is here.
Last analysis of monthly charts is here.
FIRST ELLIOTT WAVE COUNT
WEEKLY CHART
Click chart to enlarge.
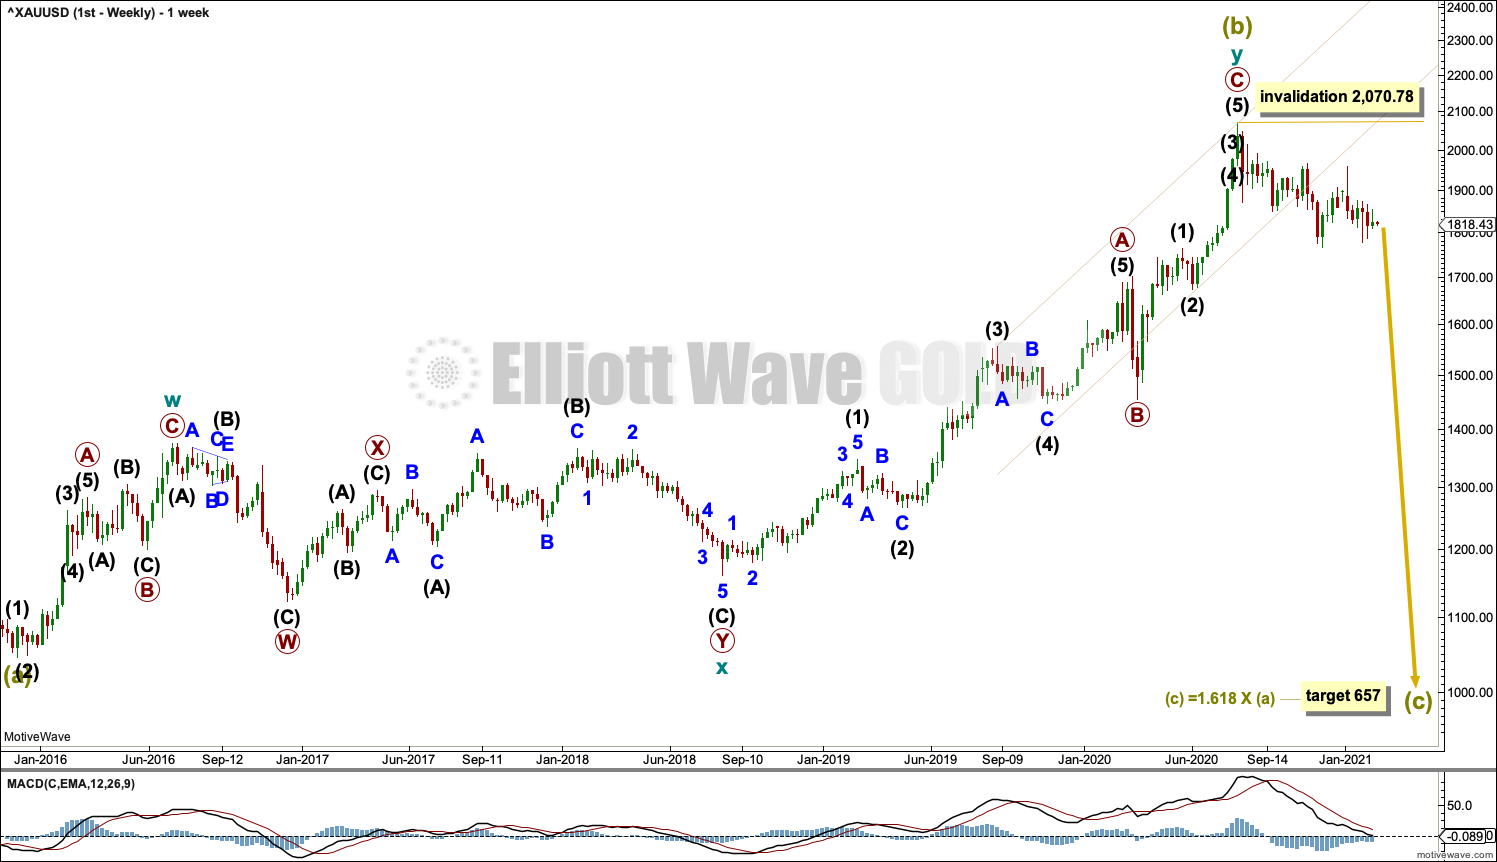
The bigger picture for this first Elliott wave count sees Gold as still within a bear market, in a three steps back pattern that is labelled Grand Super Cycle wave IV on monthly charts. Grand Super Cycle wave IV may be subdividing as an expanded flat pattern.
Super Cycle wave (b) within Grand Super Cycle wave IV may be a complete double zigzag. This wave count expects Super Cycle wave (c) to move price below the end of Super Cycle wave (a) at 1,046.27 to avoid a truncation and a very rare running flat. The target calculated expects a common Fibonacci ratio for Super Cycle wave (c).
The first zigzag in the double is labelled cycle wave w. The double is joined by a three in the opposite direction, a combination labelled cycle wave x. The second zigzag in the double is labelled cycle wave y.
The purpose of the second zigzag in a double is to deepen the correction. Cycle wave y has achieved this purpose.
A best fit channel is drawn about primary wave C to contain as much of this movement as possible. This channel is now clearly breached, which suggests the upwards wave labelled cycle wave y may be over.
DAILY CHART
Click chart to enlarge.
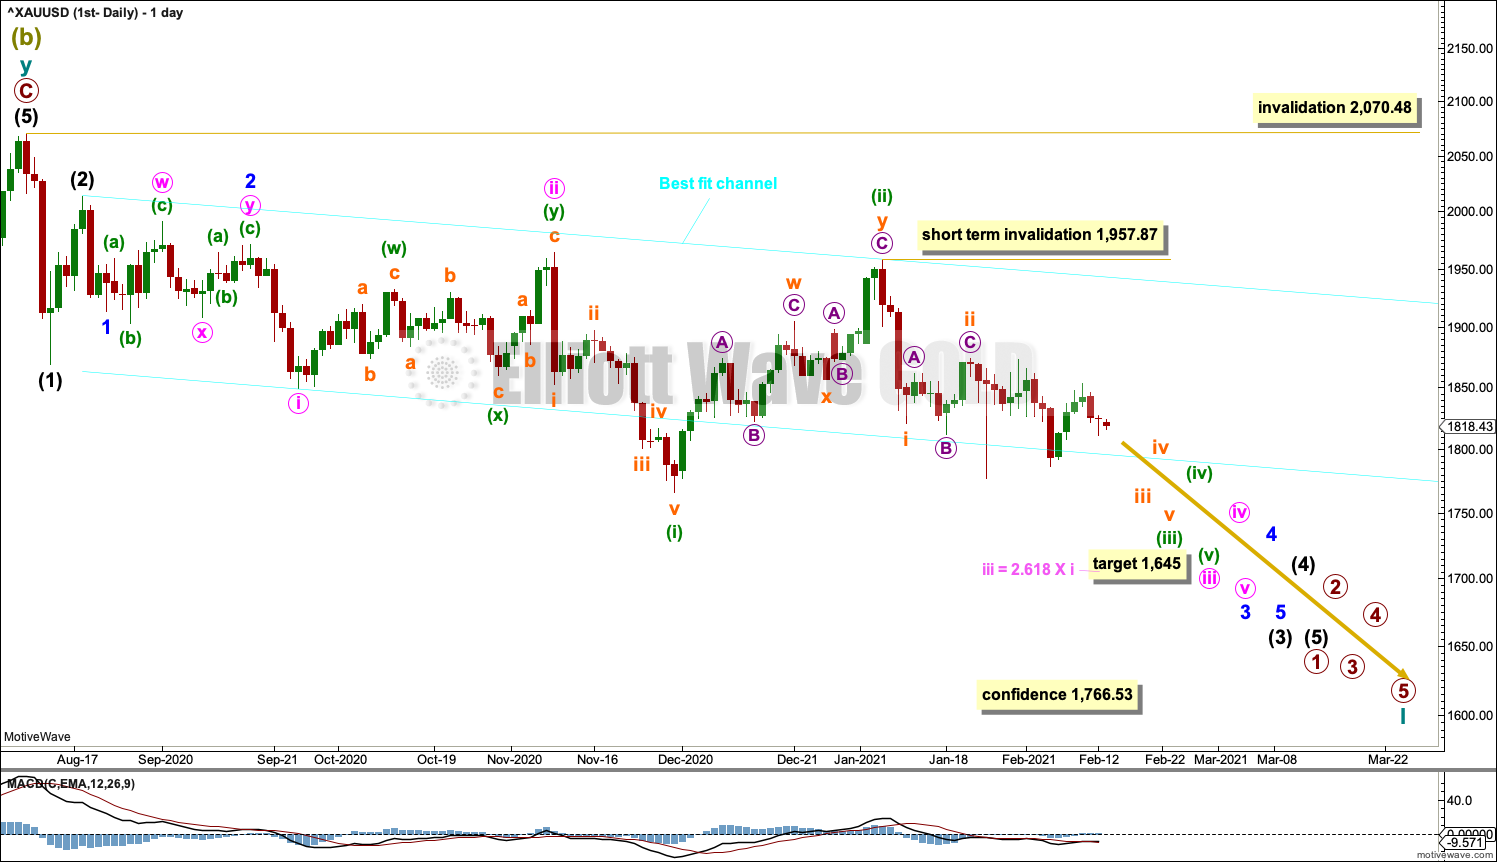
Within a new bear market, primary wave 1 may be an incomplete five wave impulse.
Primary wave 2 within the new downwards trend may not move beyond the start of primary wave 1 above 2,070.48.
Gold typically exhibits extended and strong fifth waves; this tendency is especially prevalent for fifth waves to end third wave impulses one degree higher. One or more of minuette wave (v), minute wave v and minor wave 5 may exhibit this tendency; there may be one or more selling climaxes along the way down. Minute wave iv and minor wave 4 may be relatively brief and shallow.
A best fit channel is drawn as shown. The upper edge may be used as a guide for resistance of any deeper bounces. The lower edge is no longer showing where price is finding resistance or support.
Minuette wave (ii) may be complete as a double zigzag. If subminuette wave ii continues higher, then it may not move beyond the start of subminuette wave i above 1,957.87.
A new swing low below 1,766.53 would add reasonable confidence to this wave count.
HOURLY CHART
Click chart to enlarge.
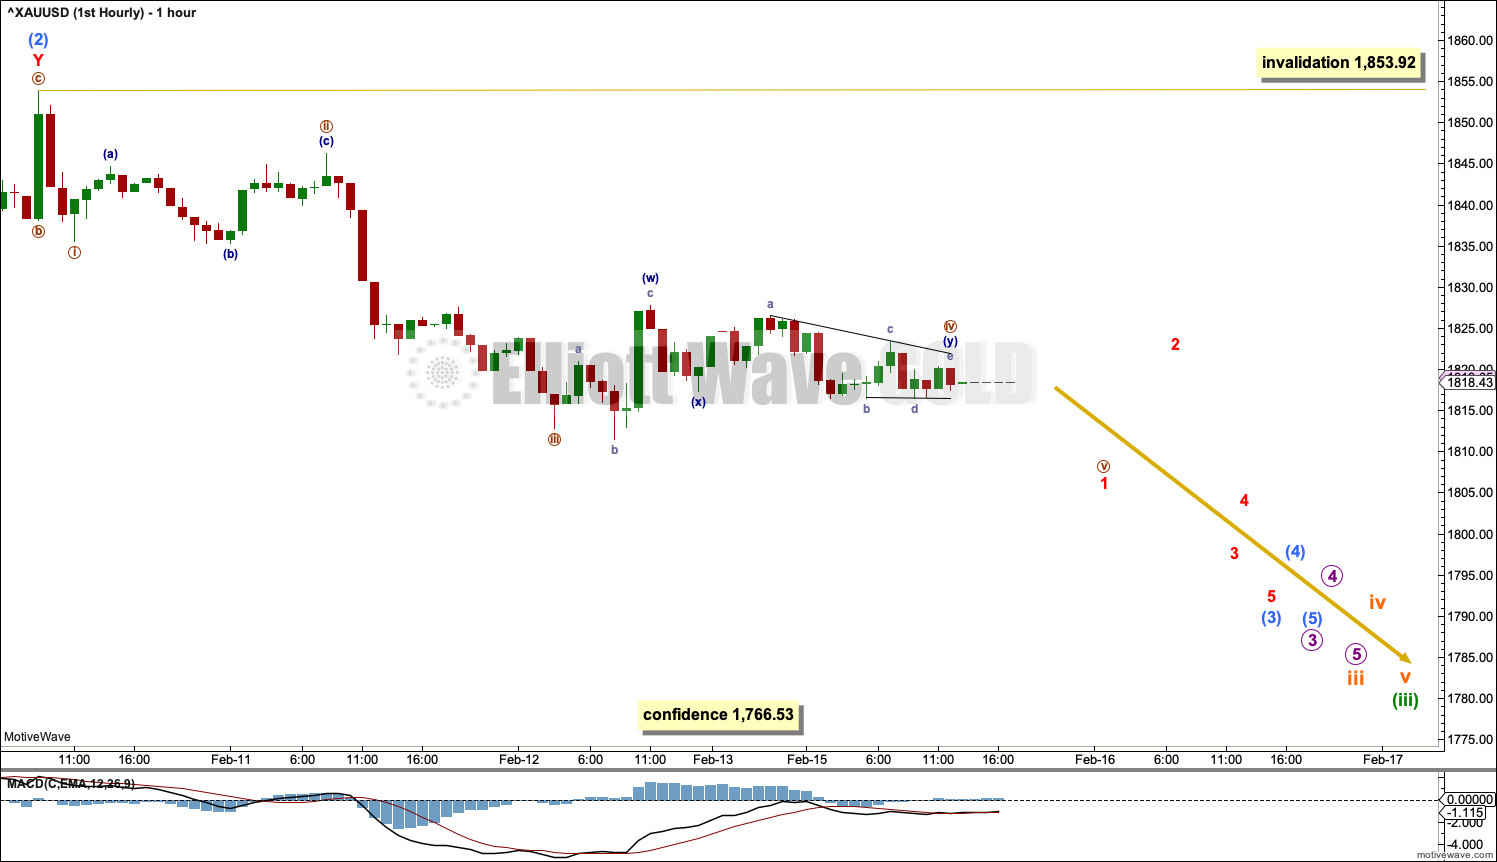
A third wave down at eight degrees may have just begun. This wave count expects to see an increase in downwards momentum as price approaches the middle of a third wave.
Minuscule wave 2 within sub-micro wave (3) may not move beyond the start of minuscule wave 1 above 1,853.92.
ALTERNATE HOURLY CHART
Click chart to enlarge.
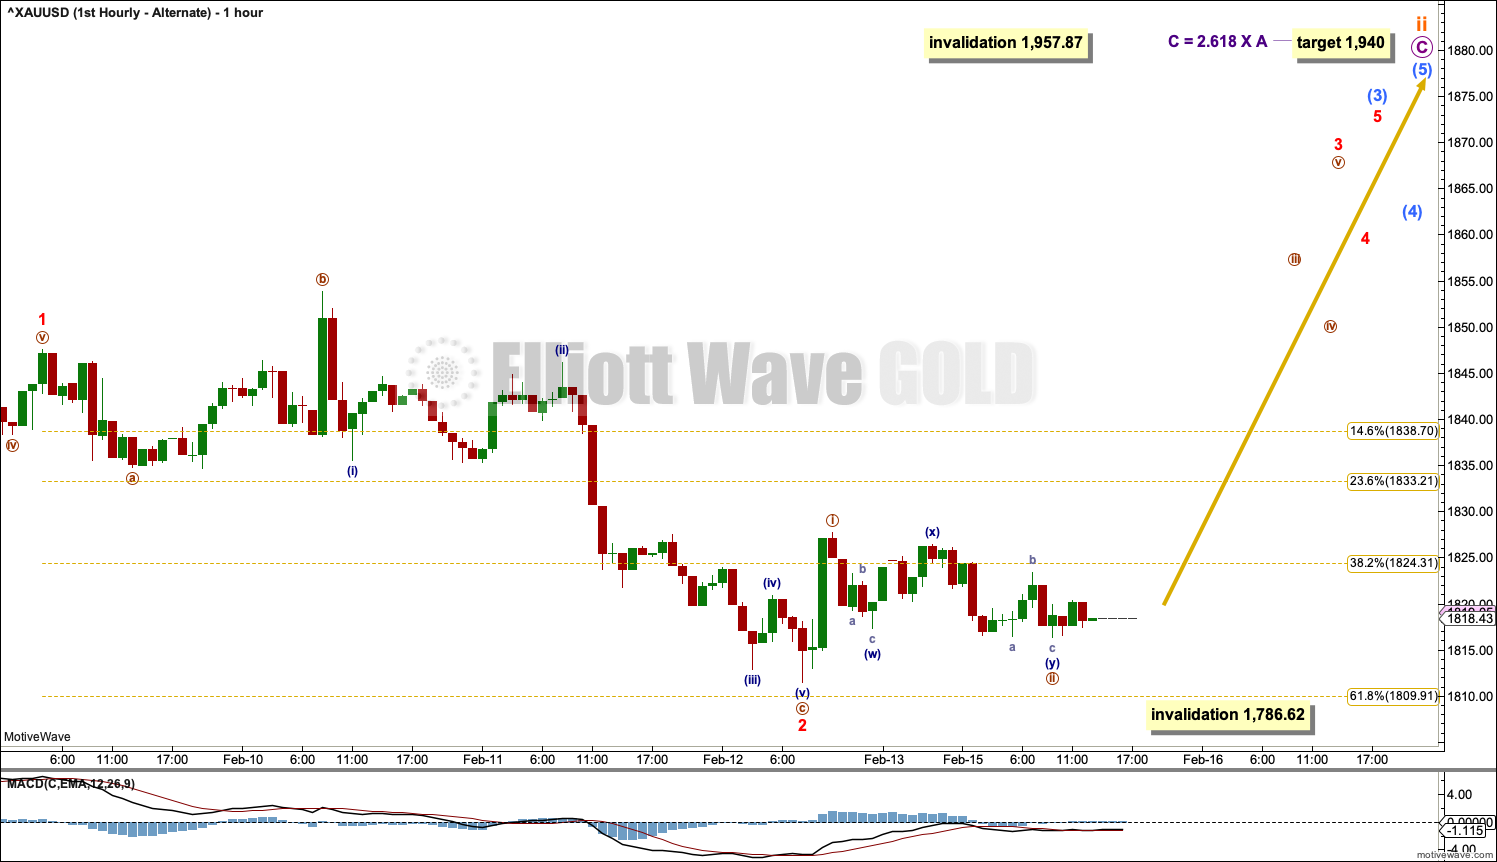
It remains possible that subminuette wave ii may continue higher as an expanded flat.
Micro wave B within the expanded flat would be a 1.55 length of micro wave A. This is beyond the common range of up to 1.38 but within an allowable guideline of up to 2.
A target is calculated for micro wave C.
Submicro waves (1) and (2) within micro wave C may be complete. Minuscule wave 2 may be complete as an expanded flat.
If it continues lower, then minuscule wave 2 may not move beyond the start of minuscule wave 1 below 1,786.62.
SECOND ELLIOTT WAVE COUNT
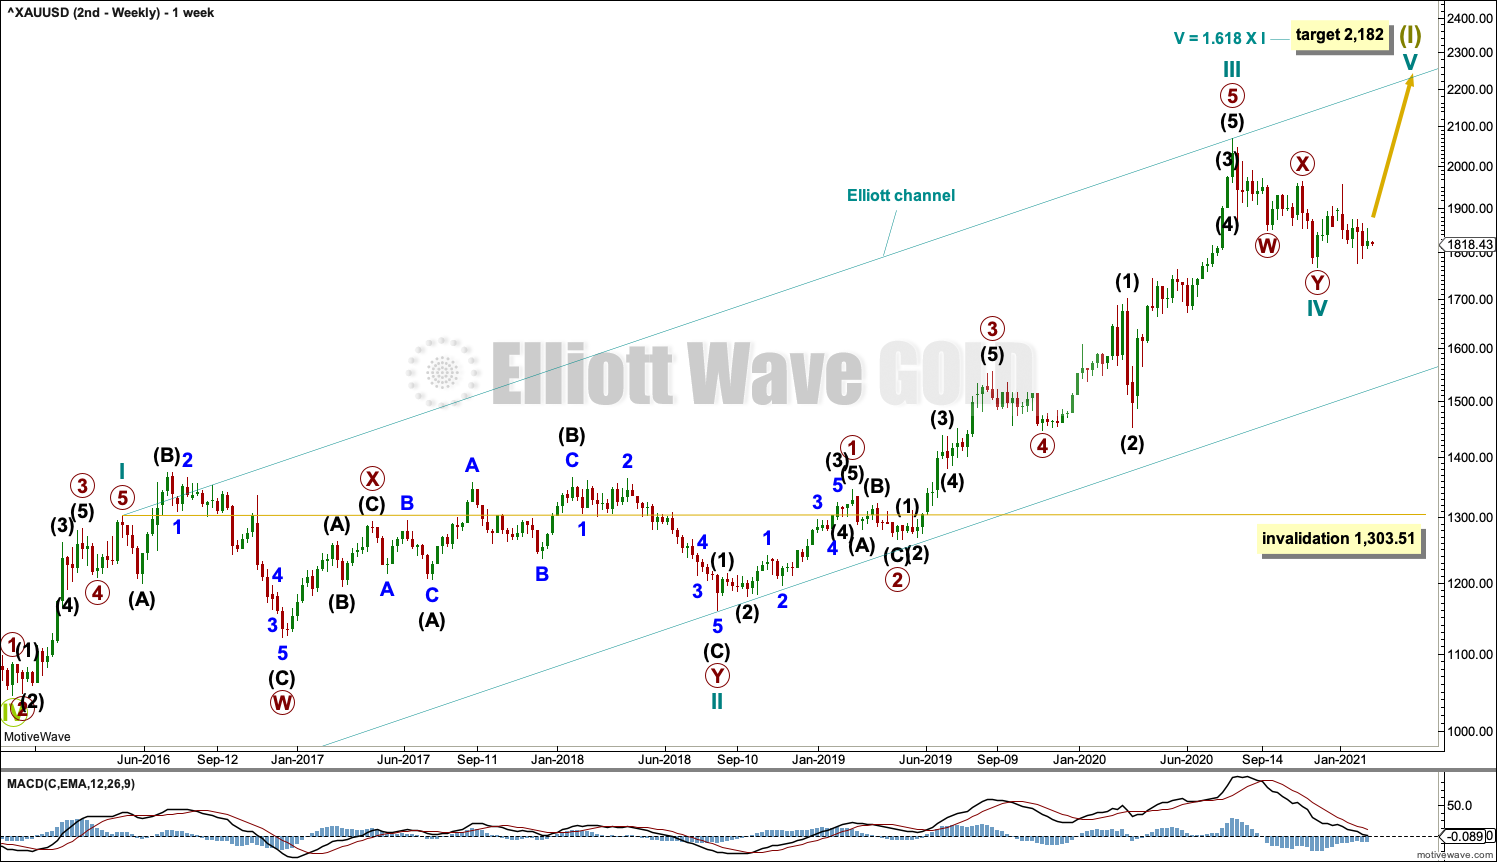
WEEKLY CHART
Click chart to enlarge.
This wave count sees the the bear market complete at the last major low for Gold on 3 December 2015.
If Gold is in a new bull market, then it should begin with a five wave structure upwards on the weekly chart.
Cycle wave I fits as a five wave impulse with reasonably proportionate corrections for primary waves 2 and 4.
Cycle wave II fits as a double flat. However, within the first flat correction labelled primary wave W, this wave count needs to ignore what looks like an obvious triangle from July to September 2016 (this can be seen labelled as a triangle on the first wave count above). This movement must be labelled as a series of overlapping first and second waves. Ignoring this triangle reduces the probability of this wave count in Elliott wave terms.
Cycle waves III and IV may be complete.
Cycle wave IV may be a complete double zigzag. It is also possible that cycle wave IV may continue sideways as a flat or lower as a triple zigzag. For this reason the invalidation point is at the end of cycle wave I. Cycle wave IV may not move into cycle wave I price territory below 1,303.51.
Draw an Elliott channel about this impulse as shown. Cycle wave V may find resistance about the upper edge.
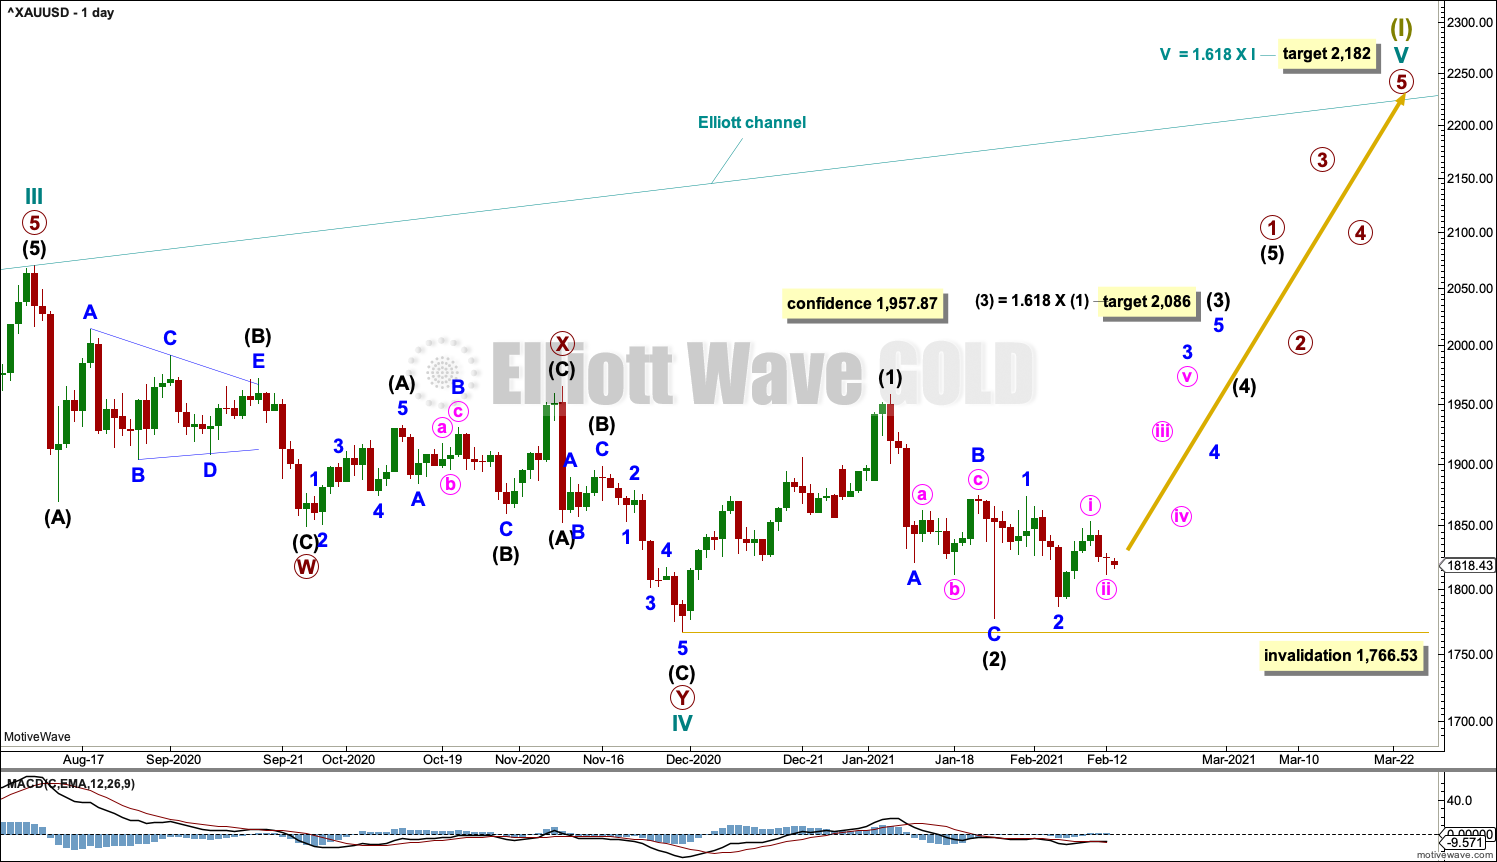
DAILY CHART
Click chart to enlarge.
Cycle wave IV may be over as a double zigzag.
A new swing high above 1,957.87 would add reasonable confidence to this wave count. Finally, a new all time high would add strong confidence to this wave count.
If cycle wave IV is complete, then it would have lasted only 17 weeks compared to 119 weeks for cycle wave II. While it is normal for Gold to exhibit fourth waves that are more brief than their counterpart second waves, a difference this great is unusual. This reduces the probability of this wave count.
When primary wave 1 within cycle wave V is complete, then primary wave 2 may not move beyond the start of primary wave 1 below 1,766.53.
Intermediate wave (1) may have ended at the last swing high. Intermediate wave (1) will subdivide on lower time frames as a five wave structure, but at the daily chart level it does not look like a normal five wave impulse, which reduces the probability of this wave count.
Intermediate wave (2) may have completed as a zigzag. If it continues lower, as a double combination or a double zigzag, then intermediate wave (2) may not move beyond the start of intermediate wave (1) below 1,766.53.
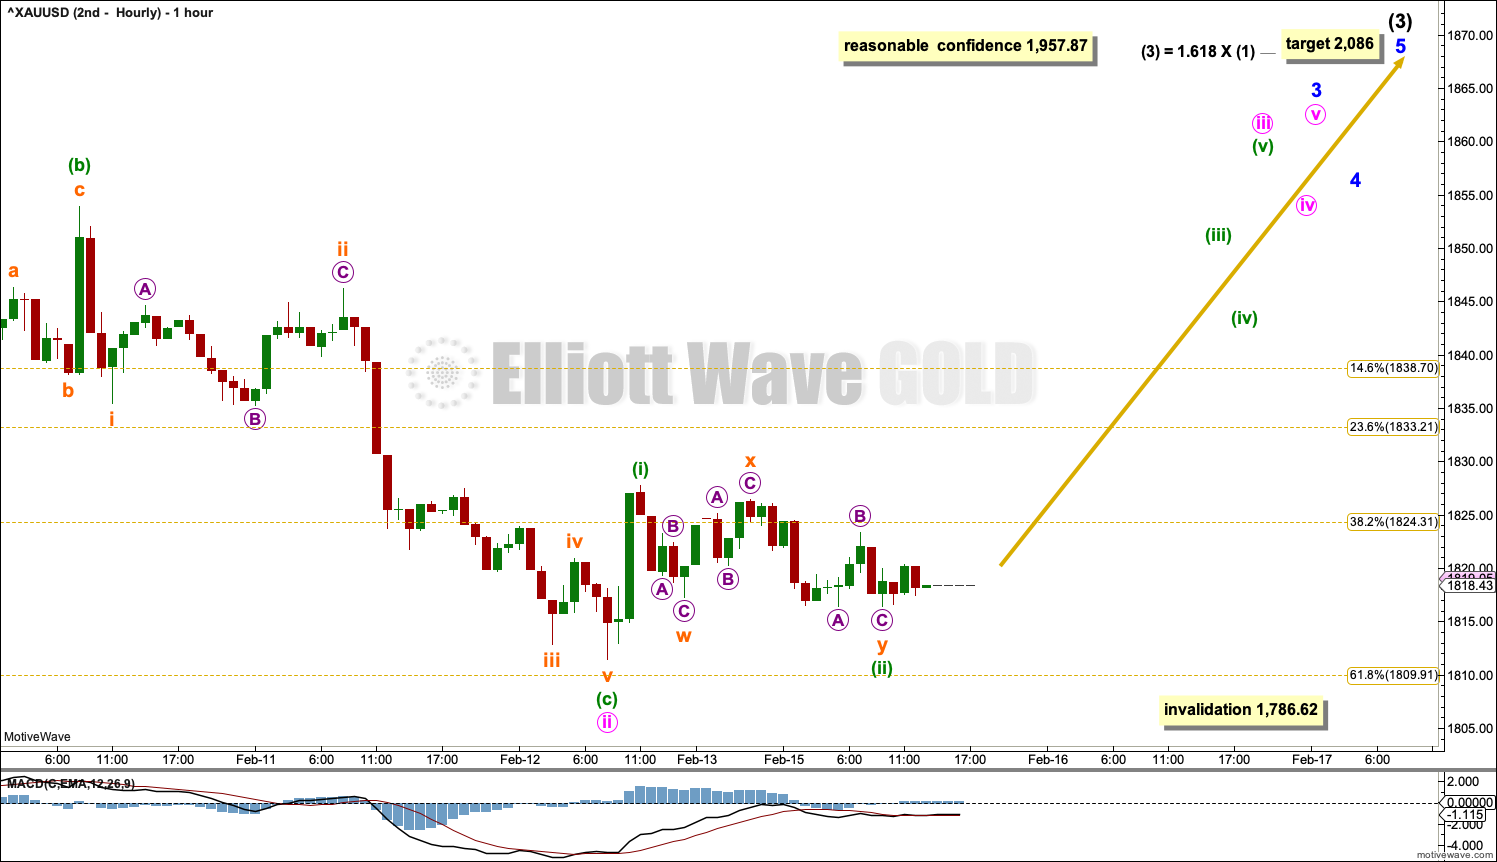
HOURLY CHART
Click chart to enlarge.
Intermediate wave (3) may have begun. A target is calculated for intermediate wave (3) that expects a common Fibonacci ratio and fits with the higher target for cycle wave V on the daily chart.
Intermediate wave (3) and minor wave 3 may only subdivide as impulses. The low labelled minute wave ii may be seen labelled on the daily chart.
If minute wave ii within minor wave 3 continues any lower, then it may not move beyond the start of minute wave i below 1,786.62.
SECOND ELLIOTT WAVE COUNT
ALTERNATE WEEKLY CHART

Click chart to enlarge.
It is possible for the second wave count that cycle wave III may be an incomplete impulse. Primary wave 5 within the impulse may be underway.
If primary wave 4 continues lower, then it may not move into primary wave 1 price territory below 1,687.92.
Primary wave 3 is longer than primary wave 1 (the chart is on a semi-log scale, which gives the illusion that primary wave 3 is shorter). There is no Fibonacci ratio between primary waves 3 and 1.
There is alternation between an expanded flat of primary wave 2 and a double zigzag of primary wave 4. Both are of a similar depth. Primary wave 2 lasted 3 weeks while primary wave 4 lasted 17 weeks. It is unusual for Gold to exhibit fourth waves that are much longer lasting than counterpart second waves. The probability of this wave count is reduced.
TECHNICAL ANALYSIS
Note: Stockcharts data is New York session only. With New York closed on Monday for President’s Day, there is no new technical analysis today.
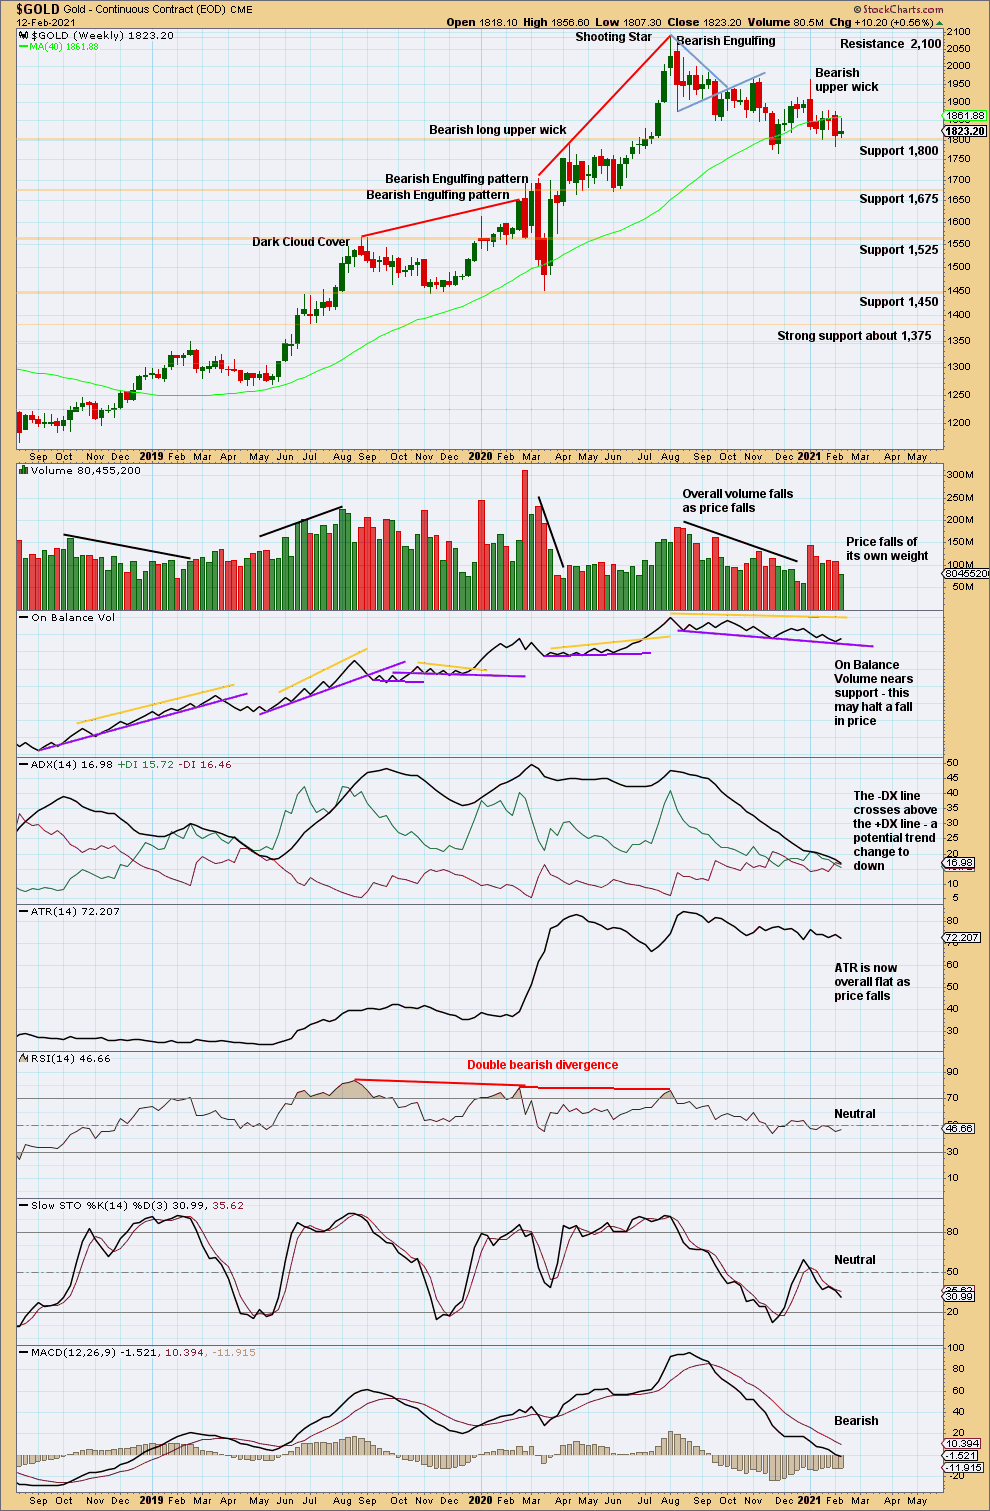
WEEKLY CHART
Click chart to enlarge. Chart courtesy of StockCharts.com.
At the last high were two bearish candlestick patterns with overbought RSI exhibiting double bearish divergence. It is possible there may have been a 180° trend change at the high. A new swing low below 1,671.70 would add confidence in that view.
From the all time high is now a series of two lower swing highs and three lower swing lows, which may be a new downwards trend. However, downwards movement from the all time high has now lasted long enough to bring ADX and RSI down from extreme, so there is again room for an upwards trend to continue.
Price and On Balance Volume both remain above support.
It remains possible that either the bullish or bearish Elliott wave count may be correct. An open mind for both possibilities is still required.
DAILY CHART
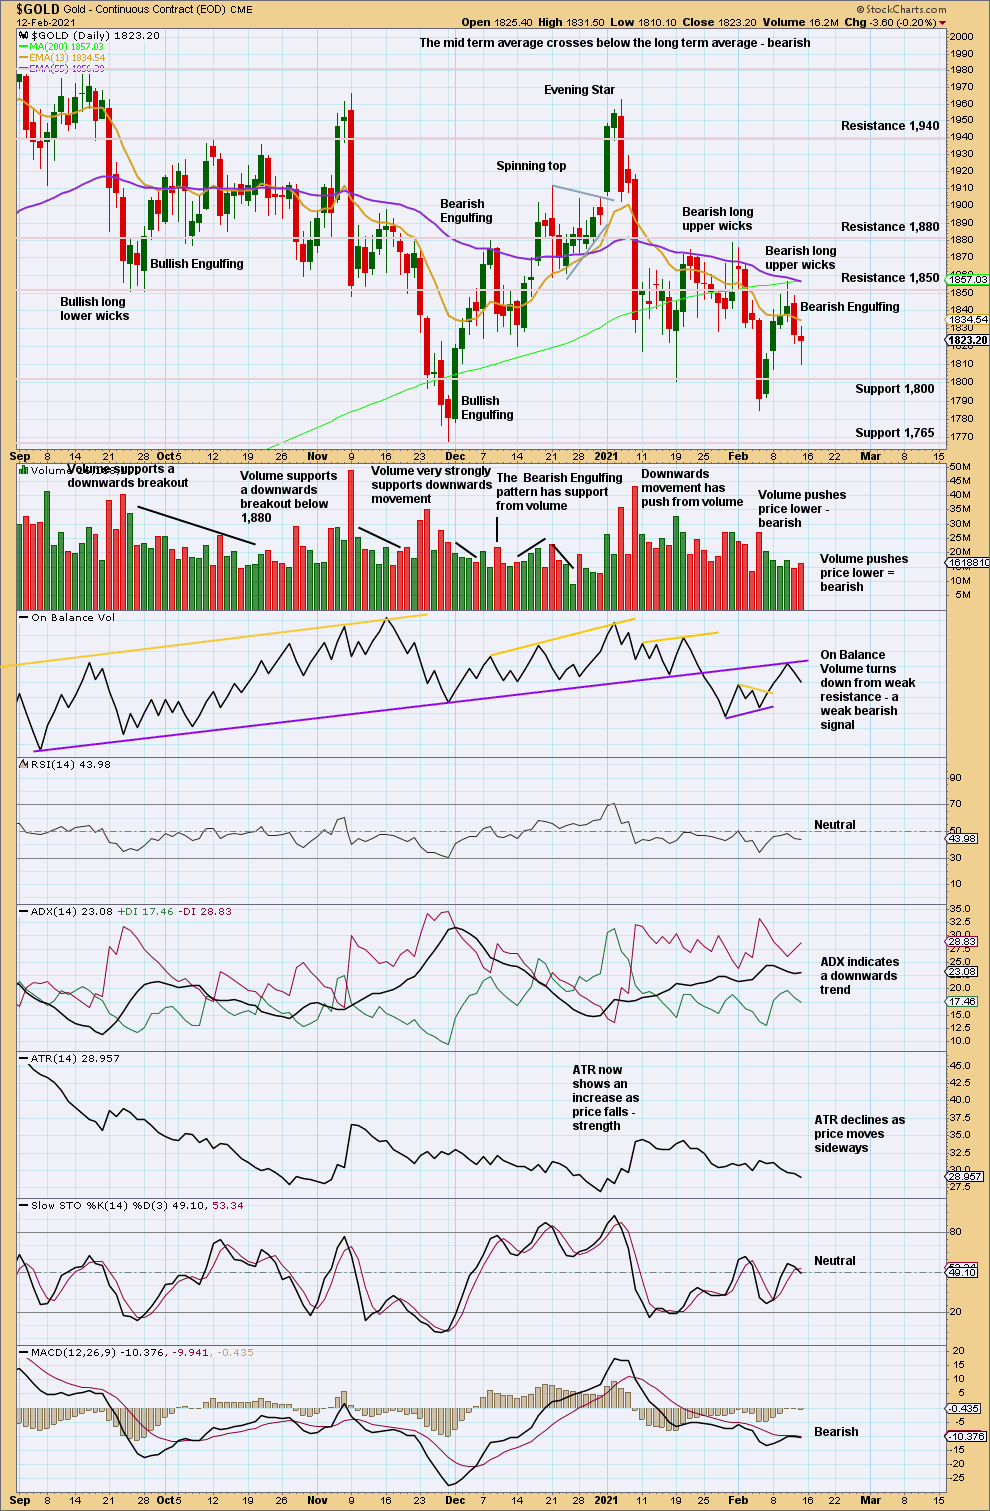
Click chart to enlarge. Chart courtesy of StockCharts.com.
From the high on August 7, 2020, there has been a series of lower lows and lower highs. While the last swing high now on the 6th of January at 1,962.50 remains intact, then this view of a possible downwards trend, at least at the daily chart level, should remain dominant.
Downwards movement has strong push from volume and increasing ATR.
Overall, this chart remains bearish. There is still most likely a downwards trend, but within this trend are deep and time consuming bounces. RSI is not oversold, and the trend is not extreme.
This week the 50 day moving average has crossed below the 200 day moving average, a “death cross”. This adds a little more support to a bearish Elliott wave count.
GDX WEEKLY CHART
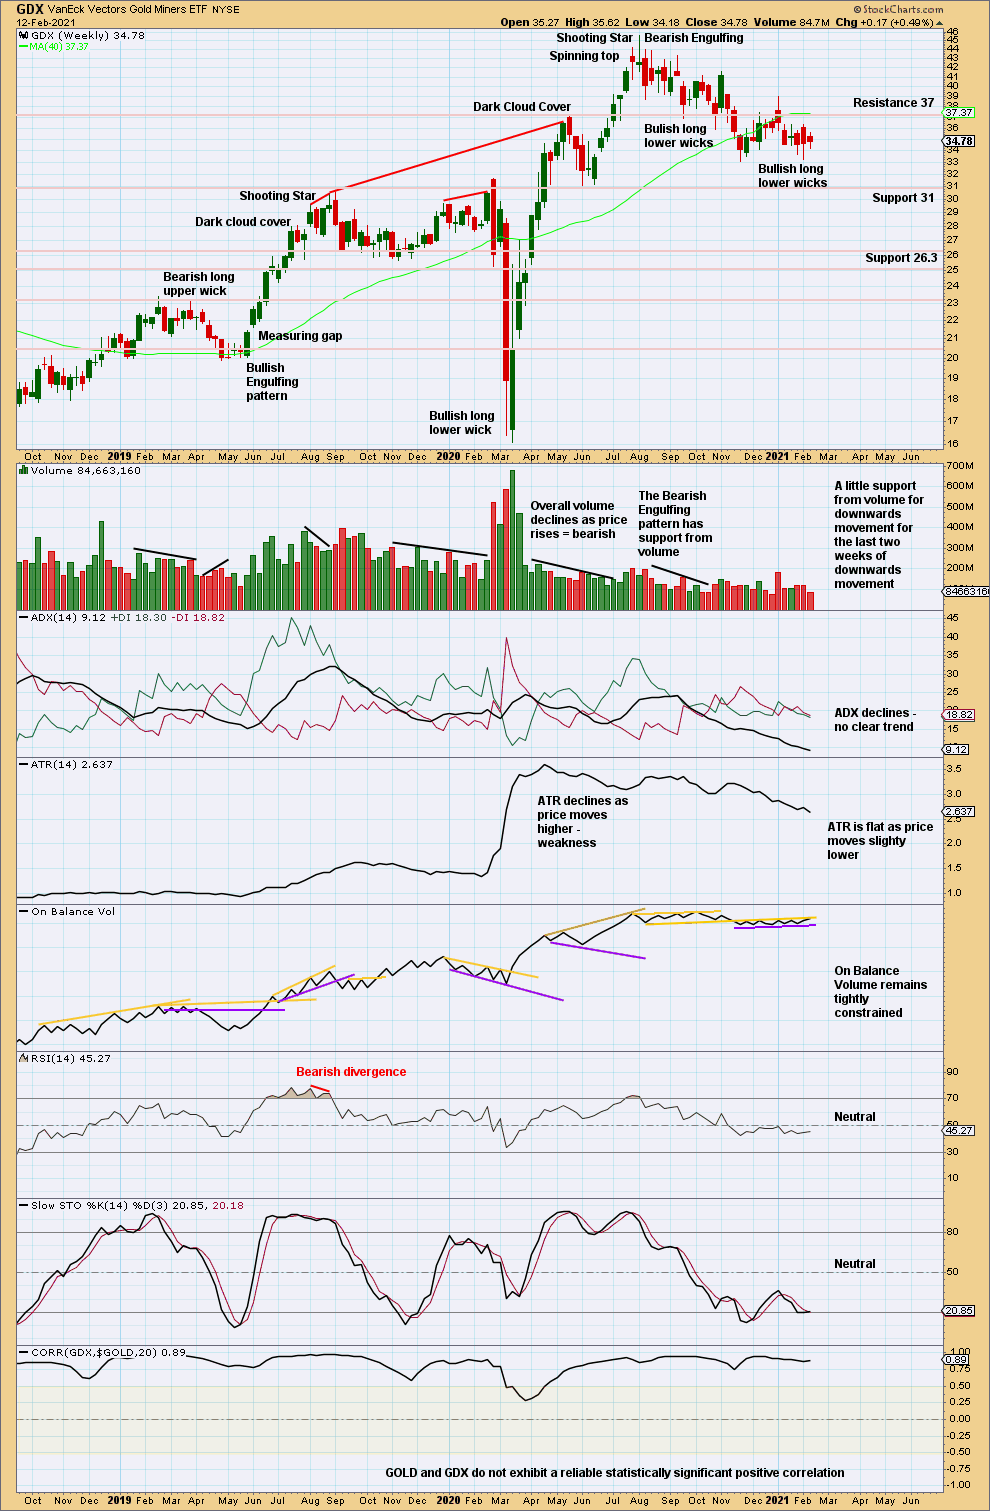
Click chart to enlarge. Chart courtesy of StockCharts.com.
If GDX makes a new swing high above 41.59 and On Balance Volume breaks above resistance, then the pullback of the last several weeks since the high in August 2020 may be considered over.
Currently, GDX is consolidating. A breakout is required for confidence in the next direction.
GDX DAILY CHART
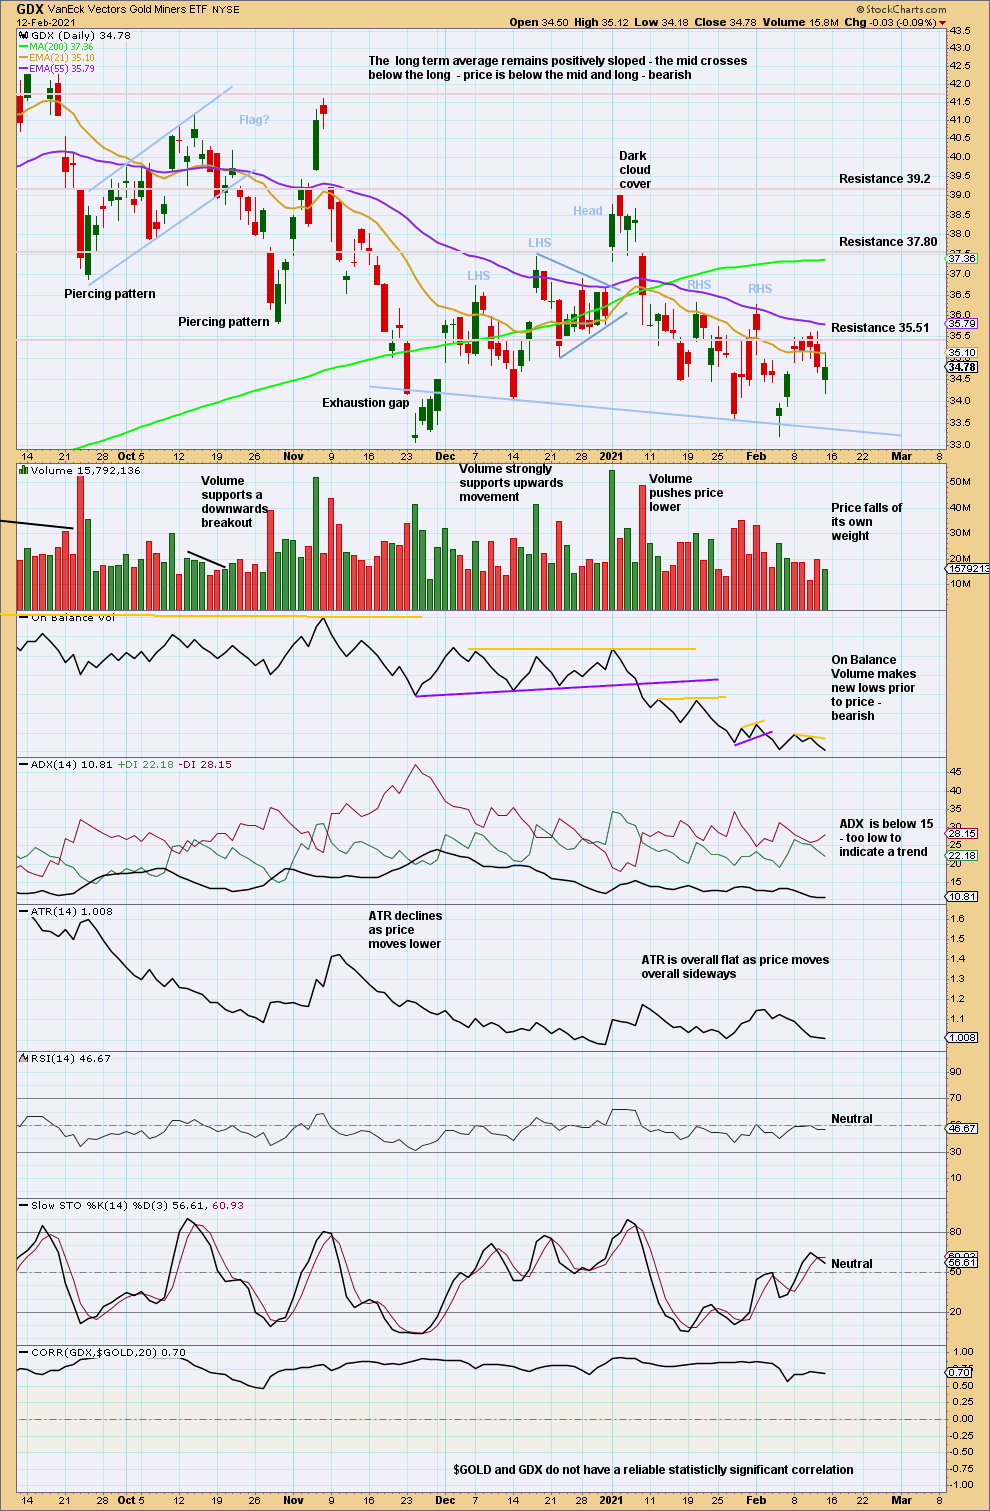
Click chart to enlarge. Chart courtesy of StockCharts.com.
Overall, from the high on August 5th, there is still a series of lower lows and lower highs, the basic definition of a downwards trend. For this view to change a new high above 39.01 would have to be seen.
The mid-term 55 day average has crossed below the long-term 200 day average. This crossover is bearish.
A possible complex Head and Shoulders pattern is identified. The neck line is drawn from the two troughs between the outer shoulders. A target calculated from the height of the pattern is about 28.30. This pattern requires a downwards breakout, with a close below the neckline, before the target may be used.
Published @ 06:22 p.m. ET.
—
Careful risk management protects your trading account(s).
Follow my two Golden Rules:
1. Always trade with stops.
2. Risk only 1-5% of equity on any one trade.
—
New updates to this analysis are in bold.