
Lara’s Weekly: Elliott Wave and Technical Analysis of S&P500 and Gold and US Oil | Charts – February 12, 2021

S&P 500
Since October 8, 2020, this analysis has been bullish for the main Elliott wave count. Since that date the S&P 500 has added another 488 points.
Price continues to move higher towards the next target.
Summary: For the very short term, price is still at a resistance line (the beige Elliott channel) that was initiated in October 2020 and has initiated multiple pullbacks. There is still a risk here of another multi-day pullback while price remains below the resistance line. If price closes above this line on a daily basis, then that would be a bullish signal. Any pullback here would still be expected to be short term in nature.
Both main and alternate wave counts expect the low of the 30th of October to not be breached for many months.
The next target zone for the upwards trend is at 4,585 – 4,608. About this target zone another multi-week pullback or consolidation may develop.
An alternate wave count at the weekly chart level has an about even probability with the main weekly chart.
The biggest picture, Grand Super Cycle analysis, is here.
Last monthly charts are here. Video is here.
MAIN WAVE COUNT
WEEKLY CHART
Click chart to enlarge.
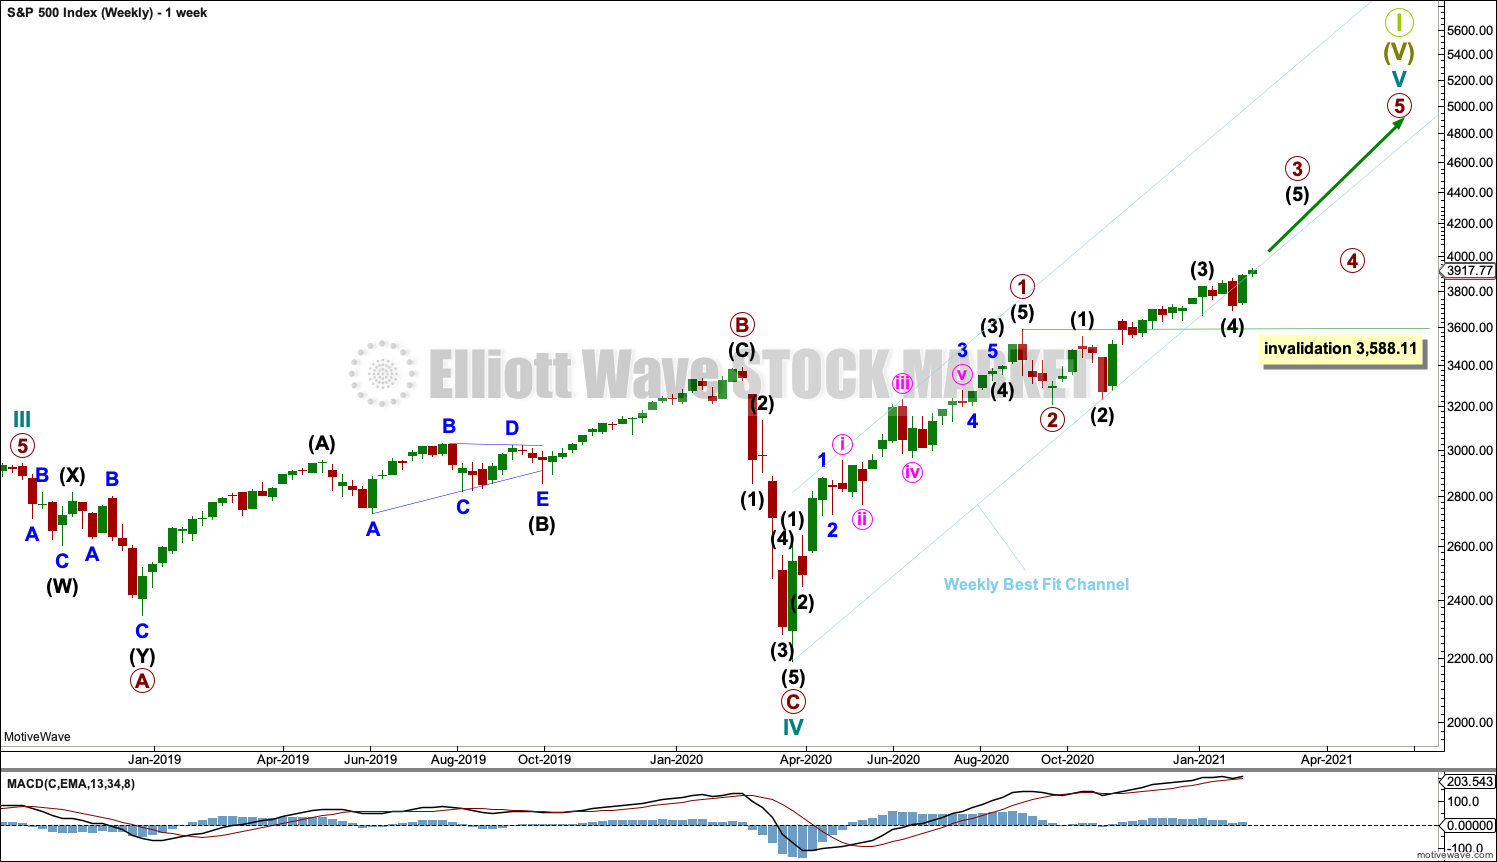
Cycle wave V may last from one to several years. So far it is in its tenth month.
This wave count may allow time for the AD line to diverge from price as price makes final highs before the end of the bull market. The AD line most commonly diverges a minimum of 4 months prior to the end of a bull market. A longer divergence is positively correlated with a deeper bear market. A shorter divergence is positively correlated with a more shallow bear market. With zero divergence at this stage, if a surprise bear market does develop here, then it would likely be shallow.
Cycle wave V would most likely subdivide as an impulse. But if overlapping develops, then an ending diagonal should be considered. This chart considers the more common impulse.
Primary waves 1 and 2 may be complete.
Primary wave 3 may only subdivide as an impulse. Targets for primary wave 3 are now on the daily chart.
Primary wave 3 has now moved well above the end of primary wave 1. Primary wave 4 may not move into primary wave 1 price territory below 3,588.11.
There is already a Fibonacci ratio between cycle waves I and III within Super Cycle wave (V). The S&P500 often exhibits a Fibonacci ratio between two of its actionary waves but rarely between all three; it is less likely that cycle wave V would exhibit a Fibonacci ratio. The target for Super Cycle wave (V) to end would best be calculated at primary degree, but that cannot be done until all of primary waves 1, 2, 3 and 4 are complete.
DAILY CHART
Click chart to enlarge.
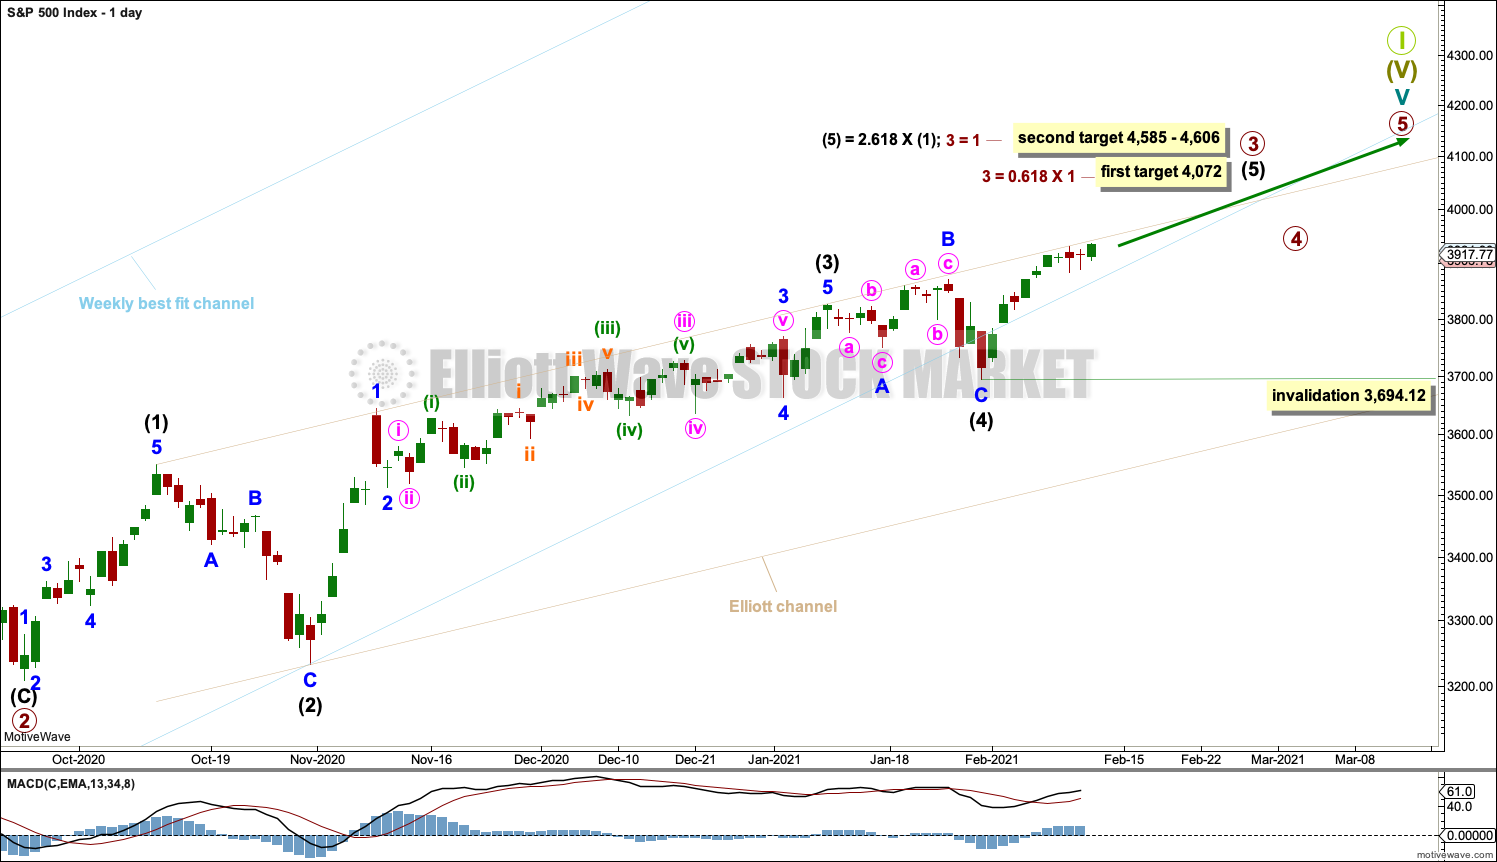
The daily chart focusses on the unfolding impulse of primary wave 3.
Primary wave 3 may only subdivide as an impulse.
Intermediate waves (1) through to (4) may be complete. Intermediate wave (5) may be underway.
Intermediate wave (2) was a very deep zigzag lasting 14 sessions. Intermediate wave (4) was an expanded flat lasting 14 sessions. There is alternation and perfect proportion between intermediate waves (4) and (2).
An Elliott channel is added in beige about primary wave 3. The upper edge may provide resistance and initiate pullbacks, which normally occur within an upwards trend.
The first target for primary wave 3 may have a better fit with a short-term target for minor wave 3 at 3,966. As price approaches the first target for primary wave 3, if the structure is incomplete or price keeps rising, then the second target may be used.
Primary wave 1 looks extended. The second target for primary wave 3 expects it to also be extended.
No second wave correction within intermediate wave (5) may move beyond its start below 3,694.12.
ALTERNATE WAVE COUNT
WEEKLY CHART
Click chart to enlarge.
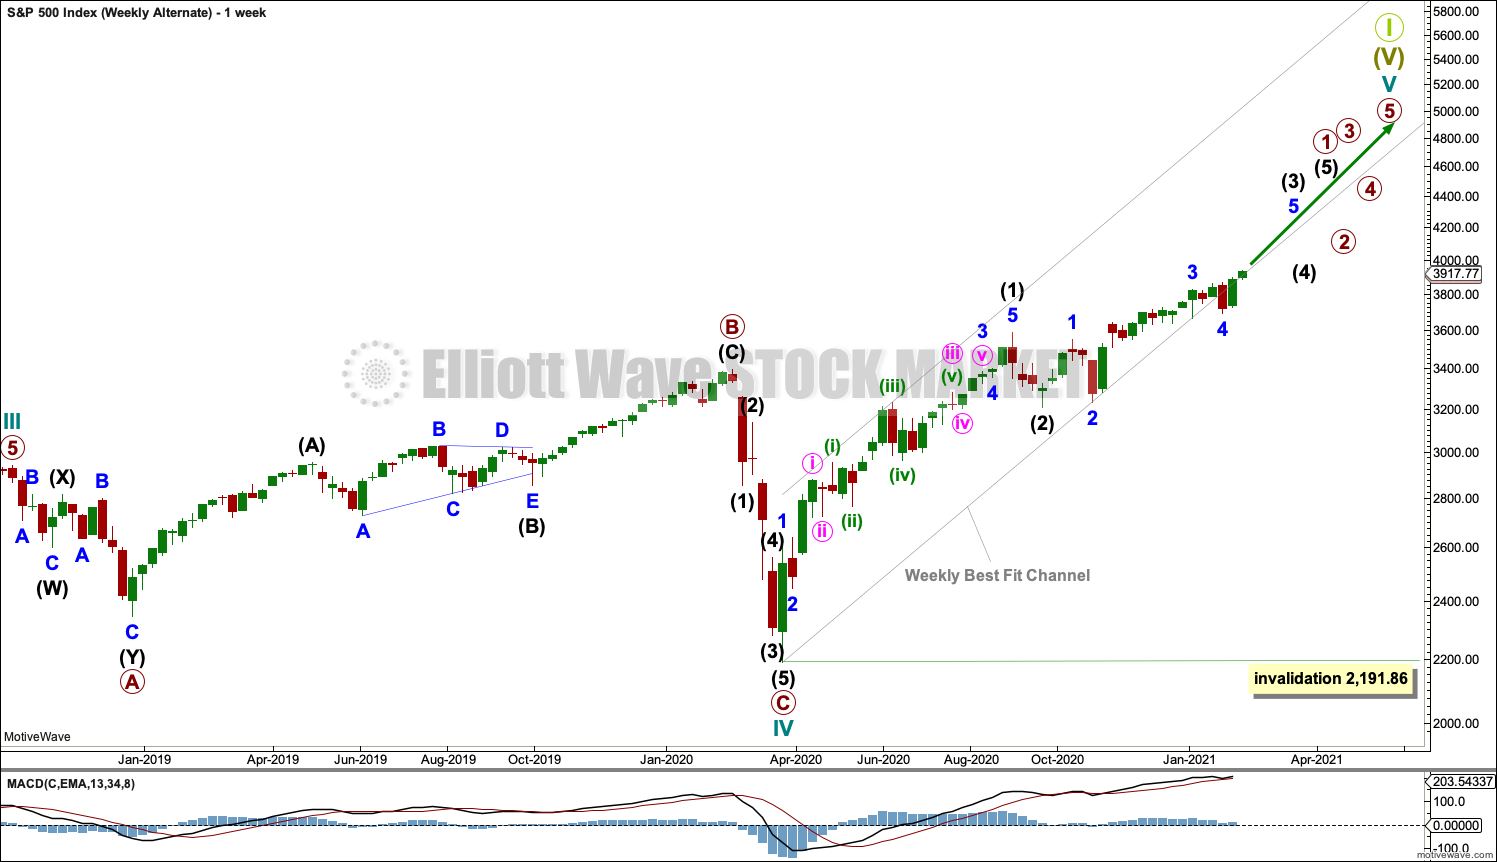
This wave count is the same as the first weekly chart with the exception of the degree of labelling within cycle wave V.
If the degree of labelling within cycle wave V is moved down one degree, then only primary wave 1 may be currently unfolding. When primary wave 1 may be complete, then a multi-week pullback or consolidation may begin for primary wave 2. Primary wave 2 may not move beyond the start of primary wave 1 below 2,191.86.
This wave count is more bullish than the main weekly chart. It expects that cycle wave V may be in an earlier stage and may yet last many more years than the main weekly chart expects it to. These two weekly wave counts are of an even probability. In coming months to years classic technical analysis will be used to judge the probability of these two weekly wave counts.
DAILY CHART
Click chart to enlarge.
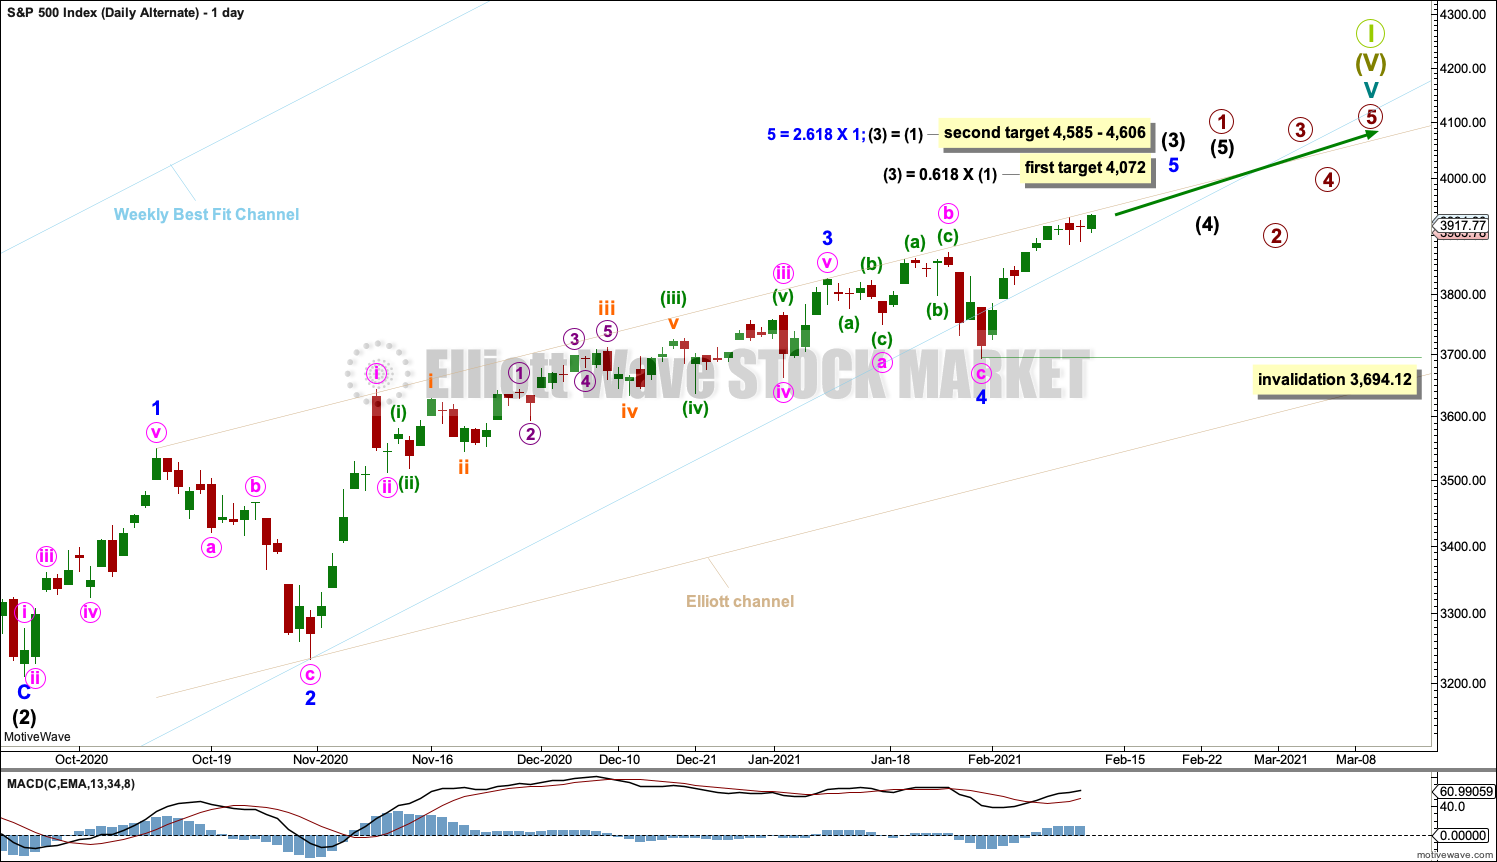
This wave count is the same as the first daily chart except the degree of labelling is one degree lower within primary wave 1.
The targets for a third wave up to end is the same.
TECHNICAL ANALYSIS
WEEKLY CHART
Click chart to enlarge. Chart courtesy of StockCharts.com.
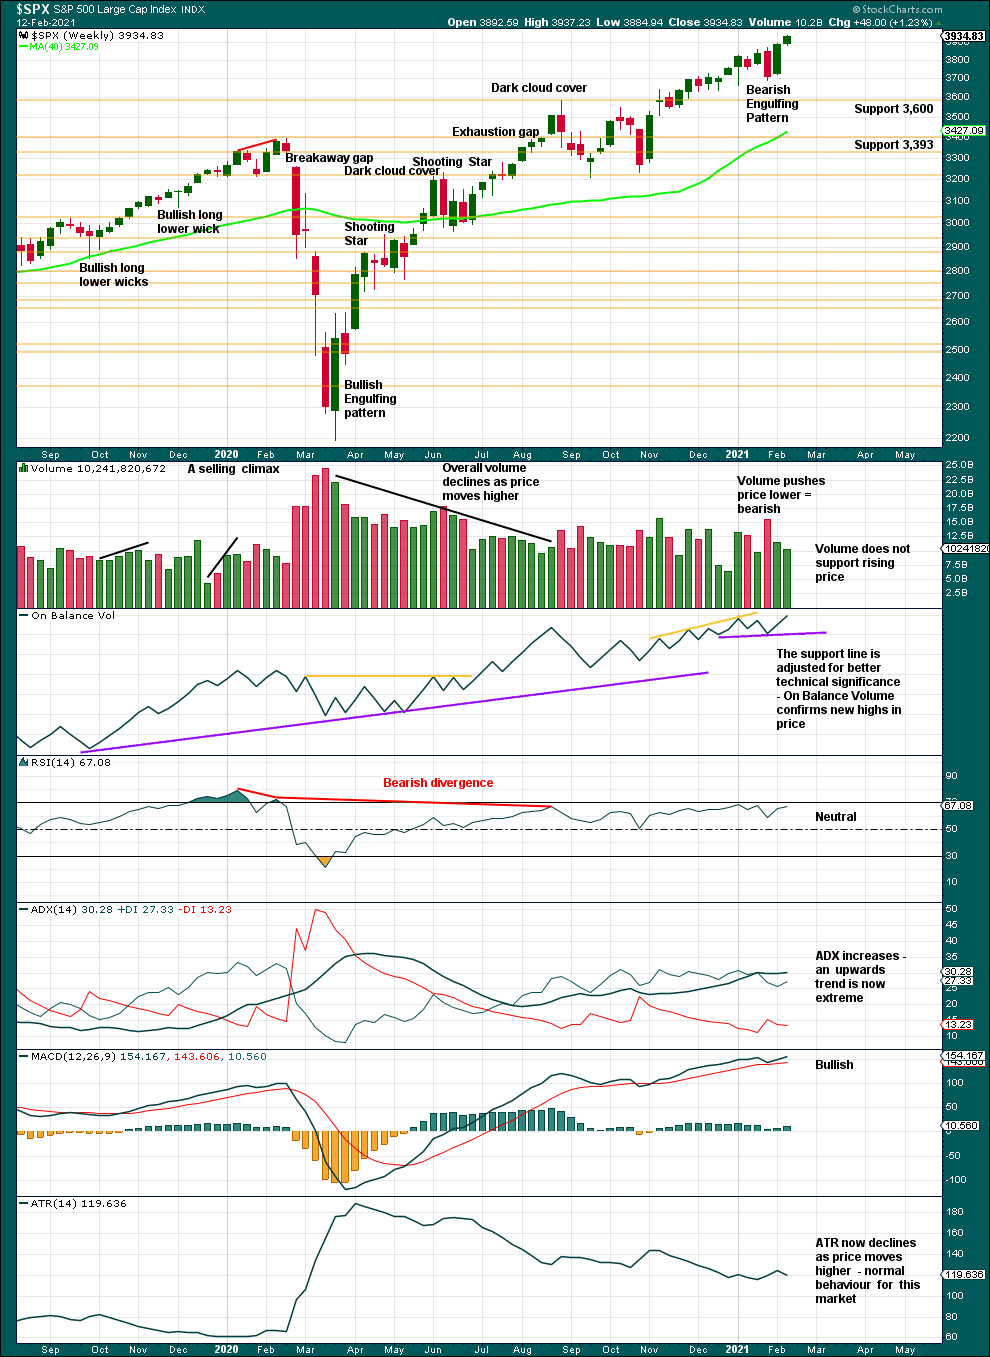
ADX indicates the trend is extreme because the ADX line is above both DX lines, but there is a long way to go before ADX reaches 45 and very extreme. This market has a strong bullish bias and extreme conditions can persist for reasonable periods of time while price travels a considerable distance.
A decline in volume this week is not of a concern in current market conditions. For years now this market has risen sustainably on light and declining volume, so it may yet be sustained for some more years. Eventually, when a bear market arrives, thin volume below may leave little support, which is concerning, but at this time there is no technical evidence of a bear market being imminent. The bull market continues.
DAILY CHART
Click chart to enlarge. Chart courtesy of StockCharts.com.
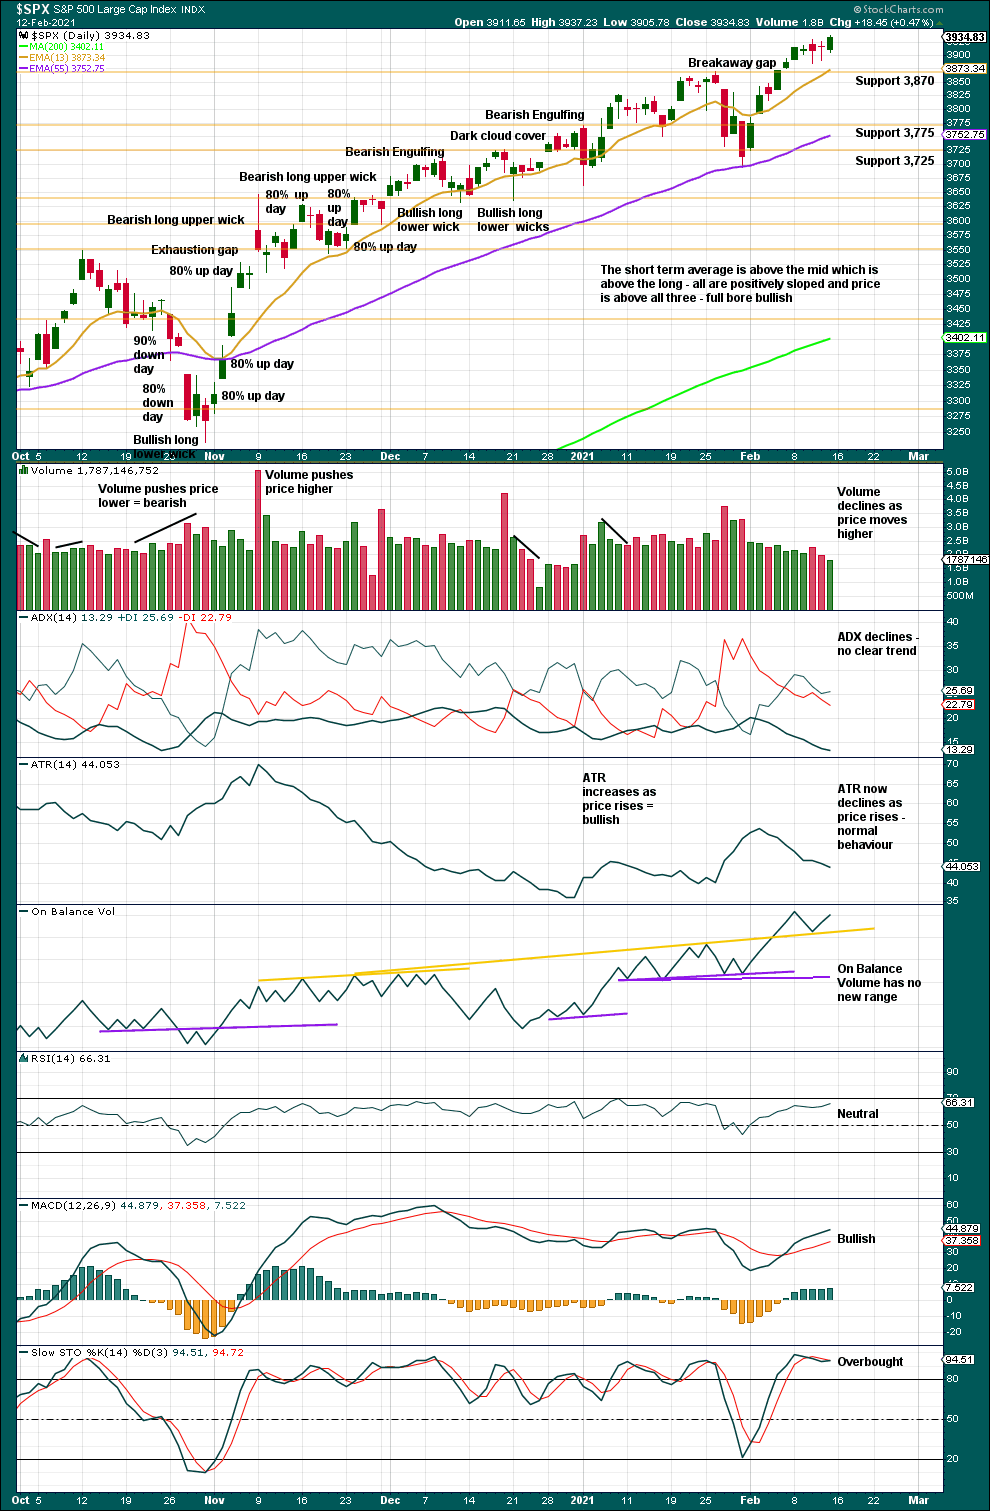
The series of higher highs and higher lows from the low of the 30th of October continues.
ADX is a lagging indicator. The many small pullbacks in this trend are causing it to lag in identifying an obvious upwards trend.
The breakaway gap may provide support for smaller pullbacks at this time. The lower edge of the gap is at 3,872.42.
There is plenty of room for this upwards trend to continue before conditions become extreme.
BREADTH – AD LINE
WEEKLY CHART
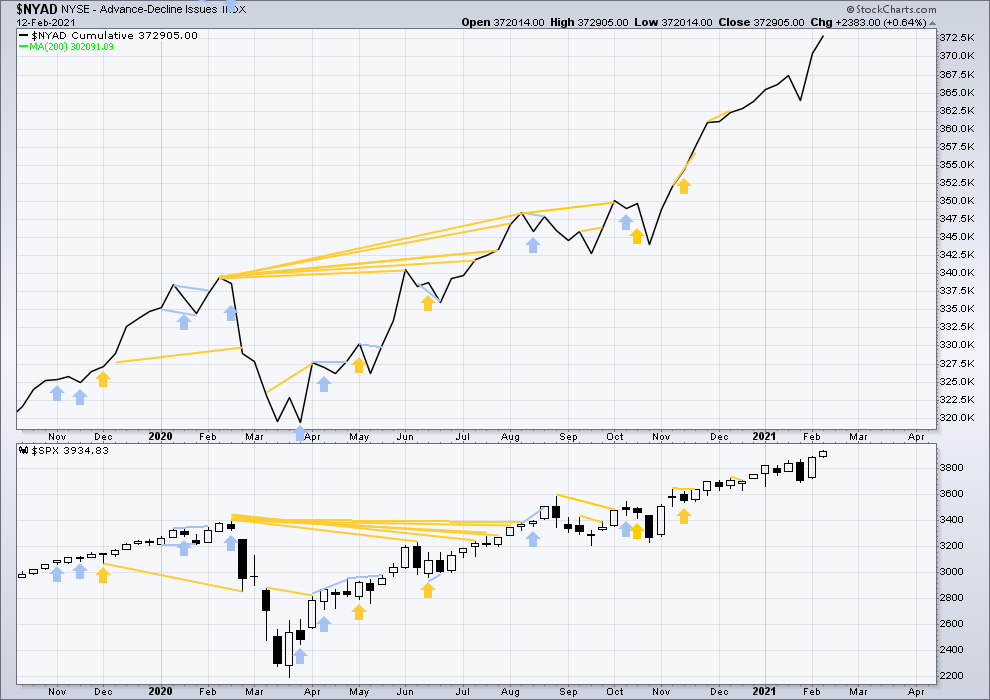
Click chart to enlarge. Chart courtesy of StockCharts.com. So that colour blind members are included, bearish signals will be noted with blue and bullish signals with yellow.
Breadth should be read as a leading indicator.
Lowry’s Operating Companies Only AD line has made a new all time high on the 10th of February. This is a strong bullish signal and supports the main Elliott wave count.
Large caps all time high: 3,937.23 on February 12, 2021.
Mid caps all time high: 2,545.97 on February 12, 2021.
Small caps all time high: 1,305.50 on February 10, 2021.
This week both price and the AD line have made new all time highs. There is no divergence. Upwards movement has support from rising market breadth. This is bullish.
DAILY CHART
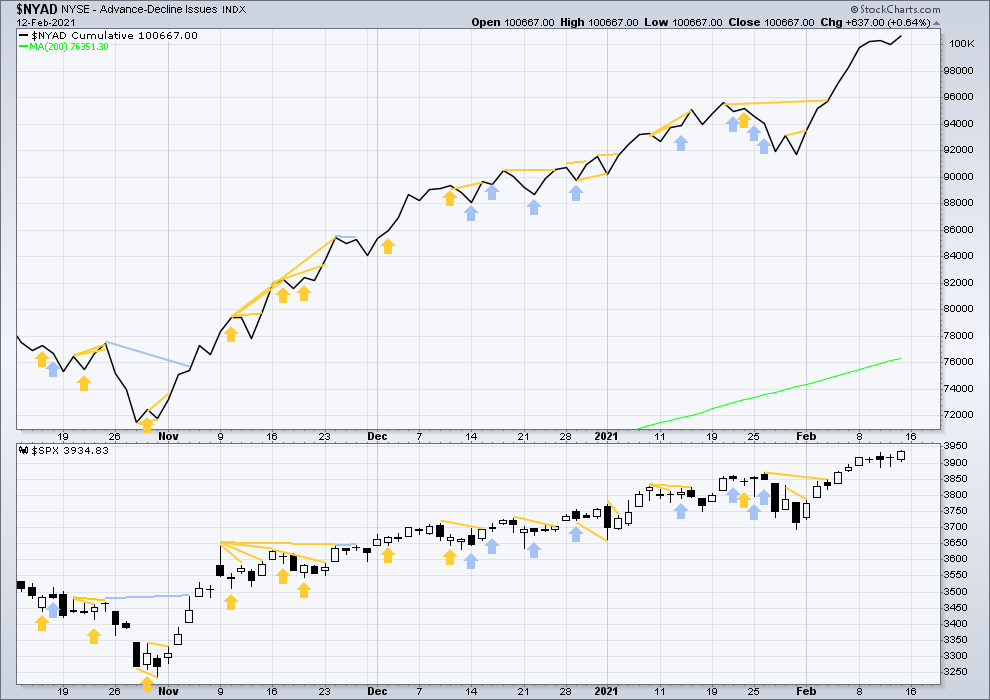
Click chart to enlarge. Chart courtesy of StockCharts.com. So that colour blind members are included, bearish signals will be noted with blue and bullish signals with yellow.
Today both the AD line and price have made new all time highs. There is no new divergence. Upwards movement has support from rising market breadth. This is bullish.
VOLATILITY – INVERTED VIX CHART
WEEKLY CHART
Click chart to enlarge. Chart courtesy of StockCharts.com. So that colour blind members are included, bearish signals will be noted with blue and bullish signals with yellow.
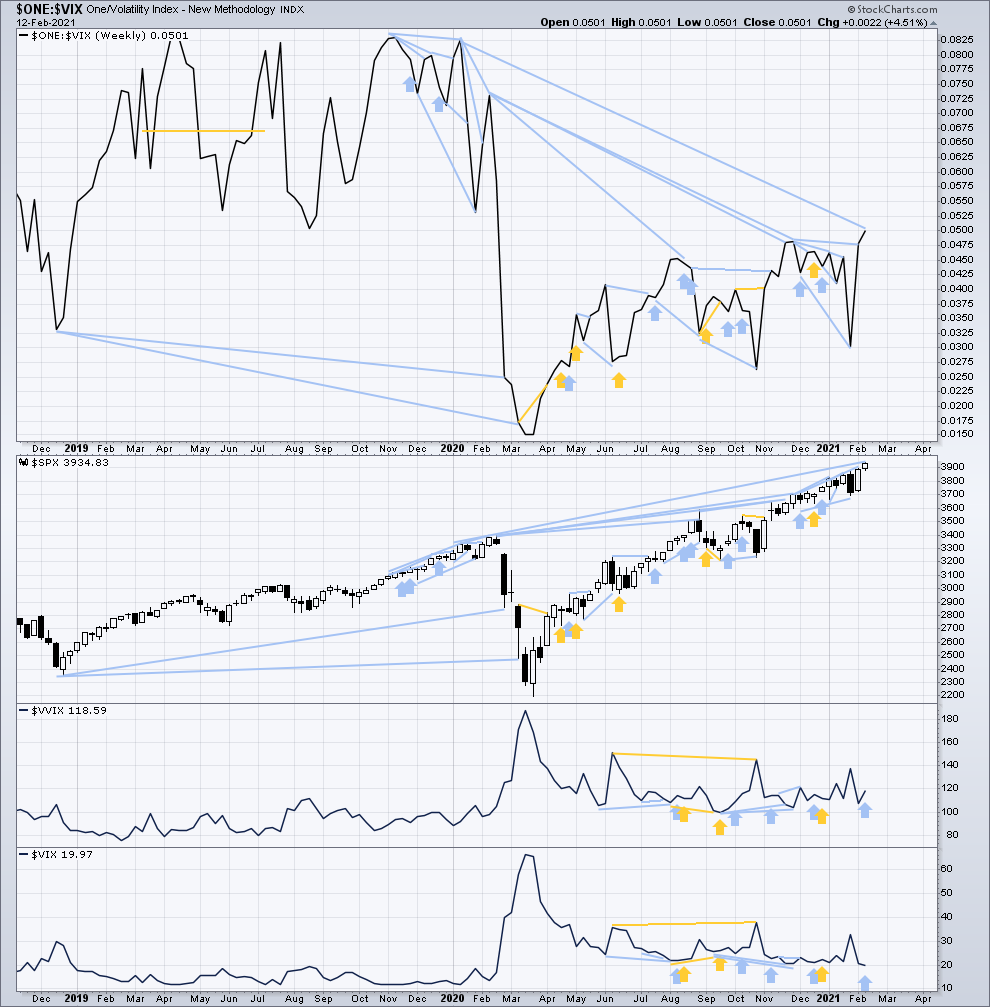
Inverted VIX remains well below all time highs. The all time high for inverted VIX was in the week beginning October 30, 2017. There is over 3 years of bearish divergence between price and inverted VIX. There is all of long, mid and short-term bearish divergence. This bearish divergence may develop further before the bull market ends. It may be a very early indicator of an upcoming bear market, but it is not proving to be useful in timing.
This week both price and inverted VIX have moved higher. Price has made new all time highs, but inverted VIX has not. There is no longer short-term divergence, but mid and long-term bearish divergence remains.
Comparing VIX and VVIX: This week VIX has moved lower as price has moved higher, a normal relationship. However, VVIX has moved higher. This is very short-term bearish divergence for price.
DAILY CHART
Click chart to enlarge. Chart courtesy of StockCharts.com. So that colour blind members are included, bearish signals will be noted with blue and bullish signals with yellow.
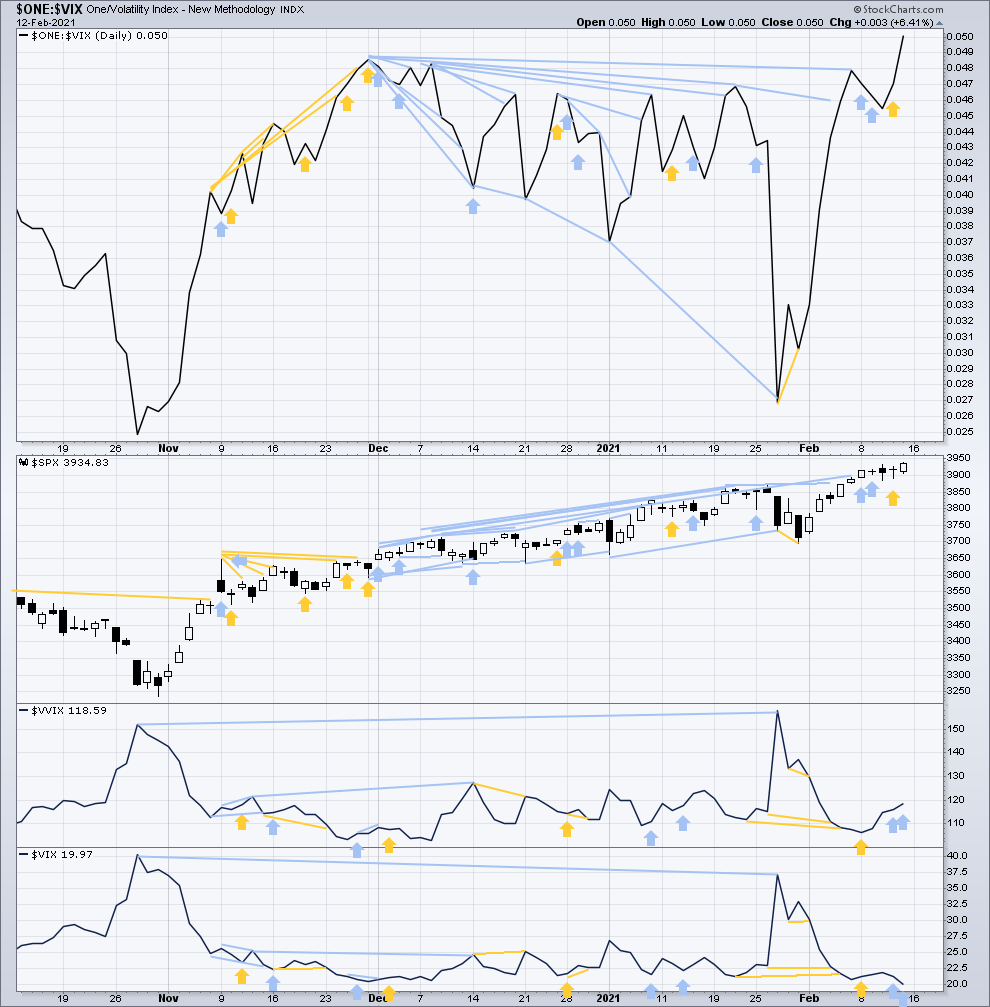
Today price and inverted VIX have both moved higher. There is no longer any short-term bearish divergence.
Comparing VIX and VVIX at the daily chart level: VVIX has made a new high above the high of October 28, 2020, but VIX has not. This divergence remains bearish for the mid term. For the last two sessions VIX has moved lower and VVIX has moved higher. This short-term divergence is bearish for price.
DOW THEORY
Dow Theory confirms a new bull market with new highs made on a closing basis:
DJIA: 29,568.57 – closed above on 16th November 2020.
DJT: 11,623.58 – closed above on 7th October 2020.
Adding in the S&P and Nasdaq for an extended Dow Theory, confirmation of a bull market would require new highs made on a closing basis:
S&P500: 3,393.52 – closed above on 21st August 2020.
Nasdaq: 9,838.37 – closed above on June 8, 2020.
The following major swing lows would need to be seen on a closing basis for Dow Theory to confirm a change from bull to a bear market:
DJIA: 18,213.65
DJT: 6,481.20
Adding in the S&P and Nasdaq for an extended Dow Theory, confirmation of a new bear market would require new lows on a closing basis:
S&P500: 2,191.86
Nasdaq: 6,631.42
GOLD
An inside week leaves all Elliott wave counts unchanged at the weekly and daily chart level.
Both bull and bear scenarios remain valid. An open mind is still required.
Summary: The first wave count is bearish for the bigger picture and has only one daily chart. This wave count expects a multi-year bear market may be in its early stages to end below 1,046.
Downwards movement may increase in momentum. A short-term target is at 1,645. A long-term target is at 657. Some confidence may be had in this bearish wave count if price makes a new low below 1,766.53. This wave count may be discarded if price makes a new high above 1,957.87.
The second wave count is bullish for the bigger picture. It now expects that the pullback was over at the last low and the bull market for Gold has resumed to a new short-term target at 2,086, and with a mid-term target at 2,182. Confidence may be had in this second wave count if price makes a new high above 1,957.87.
For GDX, a target for downwards movement is calculated at 29.95.
Grand SuperCycle analysis is here.
Last analysis of monthly charts is here.
FIRST ELLIOTT WAVE COUNT
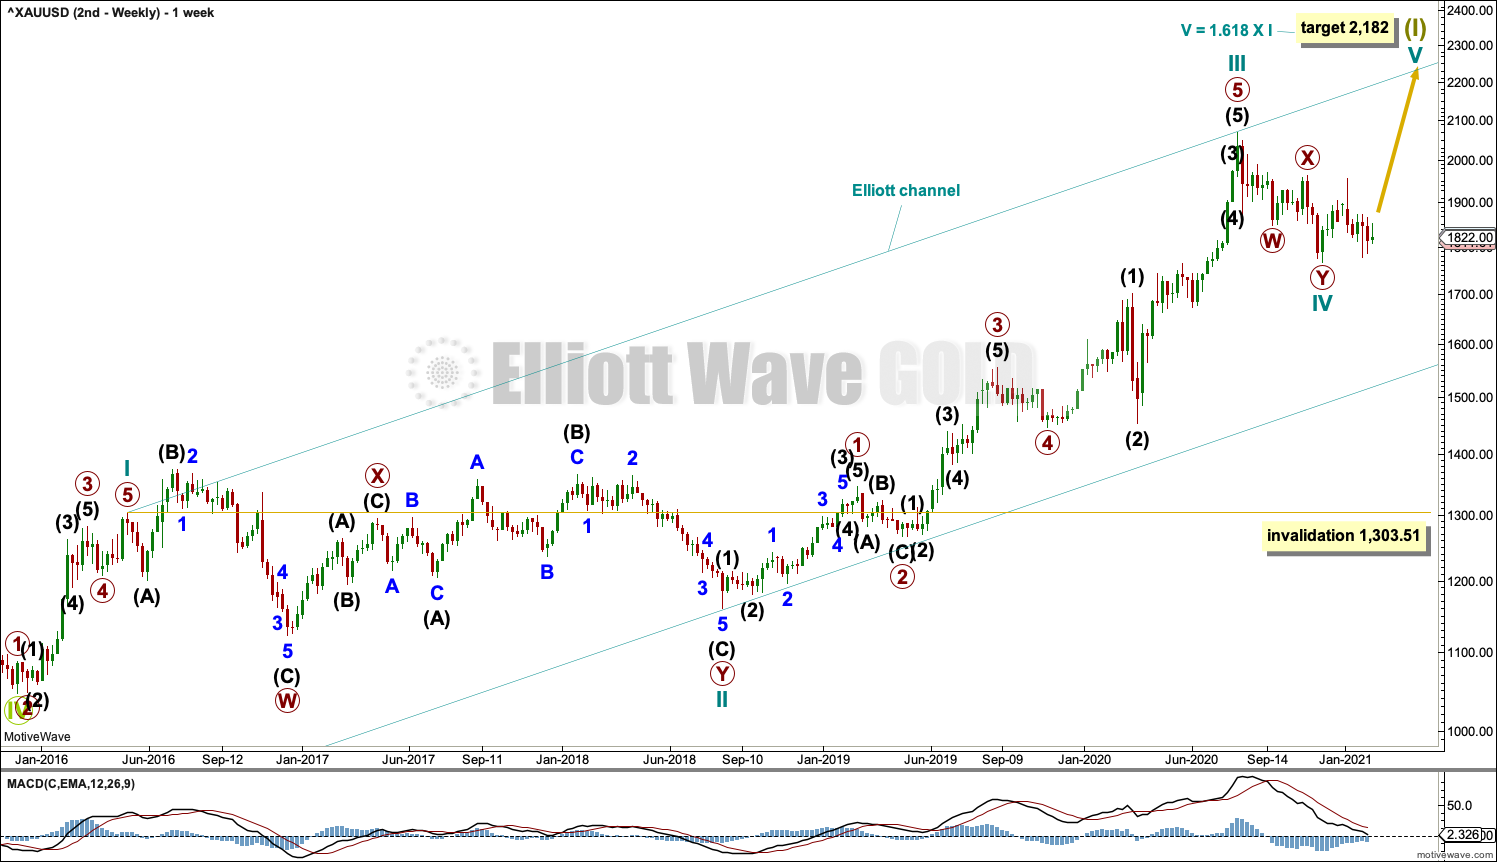
WEEKLY CHART
Click chart to enlarge.
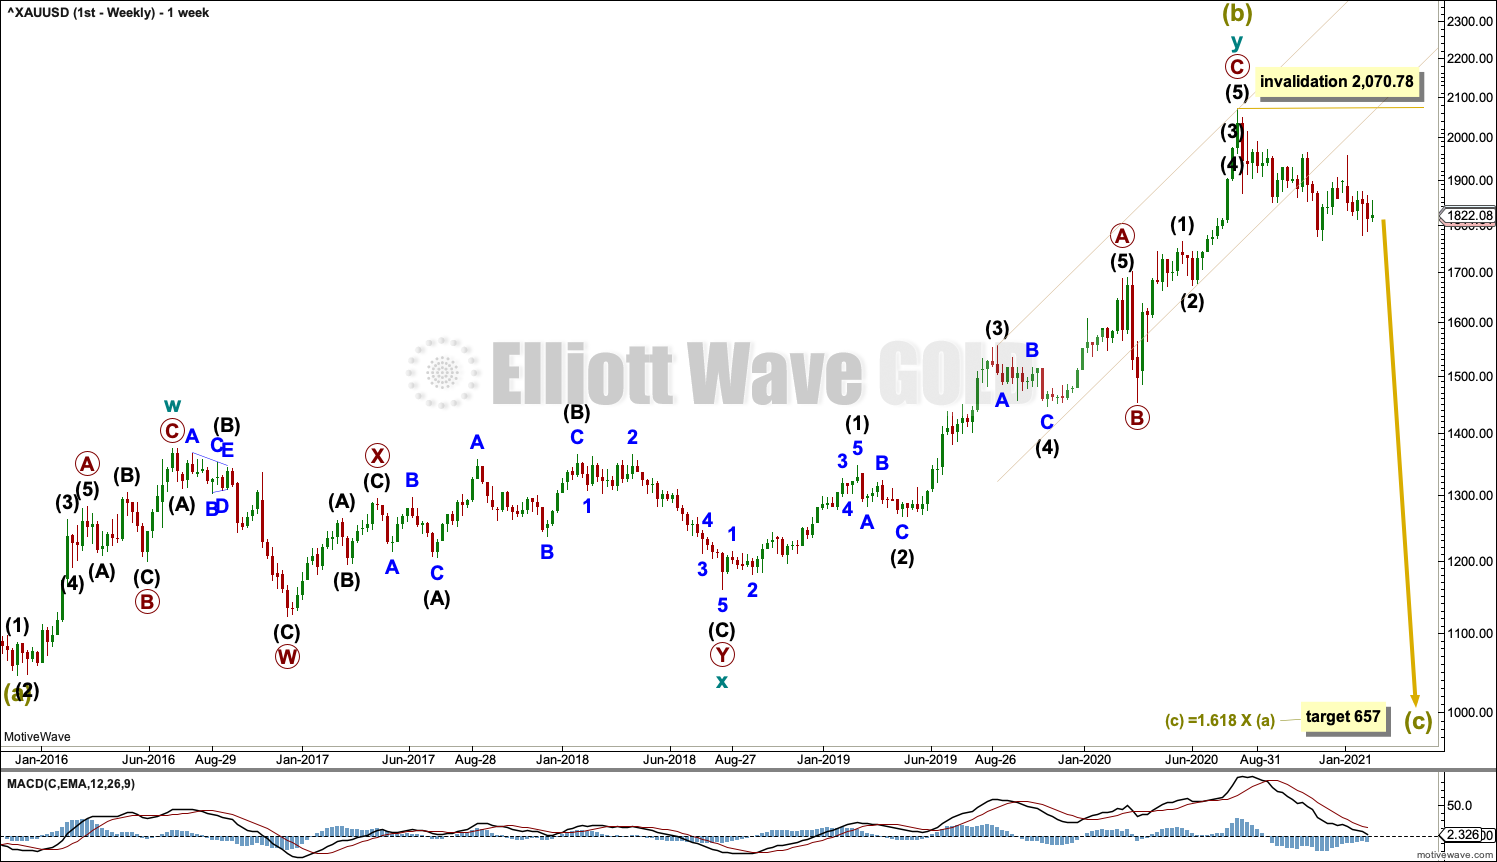
The bigger picture for this first Elliott wave count sees Gold as still within a bear market, in a three steps back pattern that is labelled Grand Super Cycle wave IV on monthly charts. Grand Super Cycle wave IV may be subdividing as an expanded flat pattern.
Super Cycle wave (b) within Grand Super Cycle wave IV may be a complete double zigzag. This wave count expects Super Cycle wave (c) to move price below the end of Super Cycle wave (a) at 1,046.27 to avoid a truncation and a very rare running flat. The target calculated expects a common Fibonacci ratio for Super Cycle wave (c).
The first zigzag in the double is labelled cycle wave w. The double is joined by a three in the opposite direction, a combination labelled cycle wave x. The second zigzag in the double is labelled cycle wave y.
The purpose of the second zigzag in a double is to deepen the correction. Cycle wave y has achieved this purpose.
A best fit channel is drawn about primary wave C to contain as much of this movement as possible. This channel is now clearly breached, which suggests the upwards wave labelled cycle wave y may be over.
DAILY CHART
Click chart to enlarge.
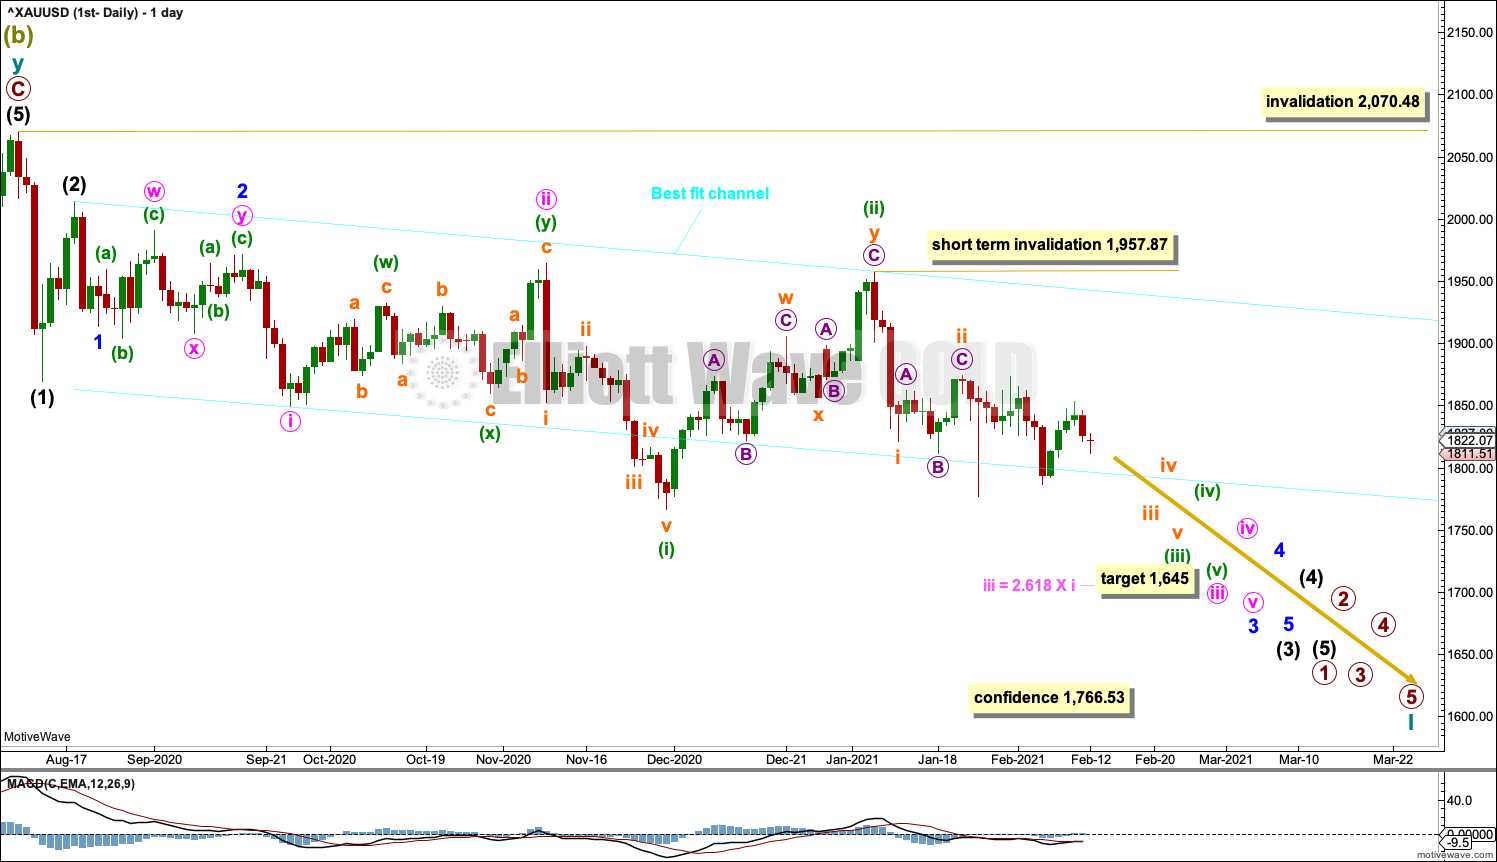
Within a new bear market, primary wave 1 may be an incomplete five wave impulse.
Primary wave 2 within the new downwards trend may not move beyond the start of primary wave 1 above 2,070.48.
Gold typically exhibits extended and strong fifth waves; this tendency is especially prevalent for fifth waves to end third wave impulses one degree higher. One or more of minuette wave (v), minute wave v and minor wave 5 may exhibit this tendency; there may be one or more selling climaxes along the way down. Minute wave iv and minor wave 4 may be relatively brief and shallow.
A best fit channel is drawn as shown. The upper edge may be used as a guide for resistance of any deeper bounces. The lower edge is no longer showing where price is finding resistance or support.
Minuette wave (ii) may be complete as a double zigzag. If subminuette wave ii continues higher, then it may not move beyond the start of subminuette wave i above 1,957.87.
A new swing low below 1,766.53 would add reasonable confidence to this wave count.
SECOND ELLIOTT WAVE COUNT
WEEKLY CHART
Click chart to enlarge.
This wave count sees the the bear market complete at the last major low for Gold on 3 December 2015.
If Gold is in a new bull market, then it should begin with a five wave structure upwards on the weekly chart.
Cycle wave I fits as a five wave impulse with reasonably proportionate corrections for primary waves 2 and 4.
Cycle wave II fits as a double flat. However, within the first flat correction labelled primary wave W, this wave count needs to ignore what looks like an obvious triangle from July to September 2016 (this can be seen labelled as a triangle on the first wave count above). This movement must be labelled as a series of overlapping first and second waves. Ignoring this triangle reduces the probability of this wave count in Elliott wave terms.
Cycle waves III and IV may be complete.
Cycle wave IV may be a complete double zigzag. It is also possible that cycle wave IV may continue sideways as a flat or lower as a triple zigzag. For this reason the invalidation point is at the end of cycle wave I. Cycle wave IV may not move into cycle wave I price territory below 1,303.51.
Draw an Elliott channel about this impulse as shown. Cycle wave V may find resistance about the upper edge.
DAILY CHART
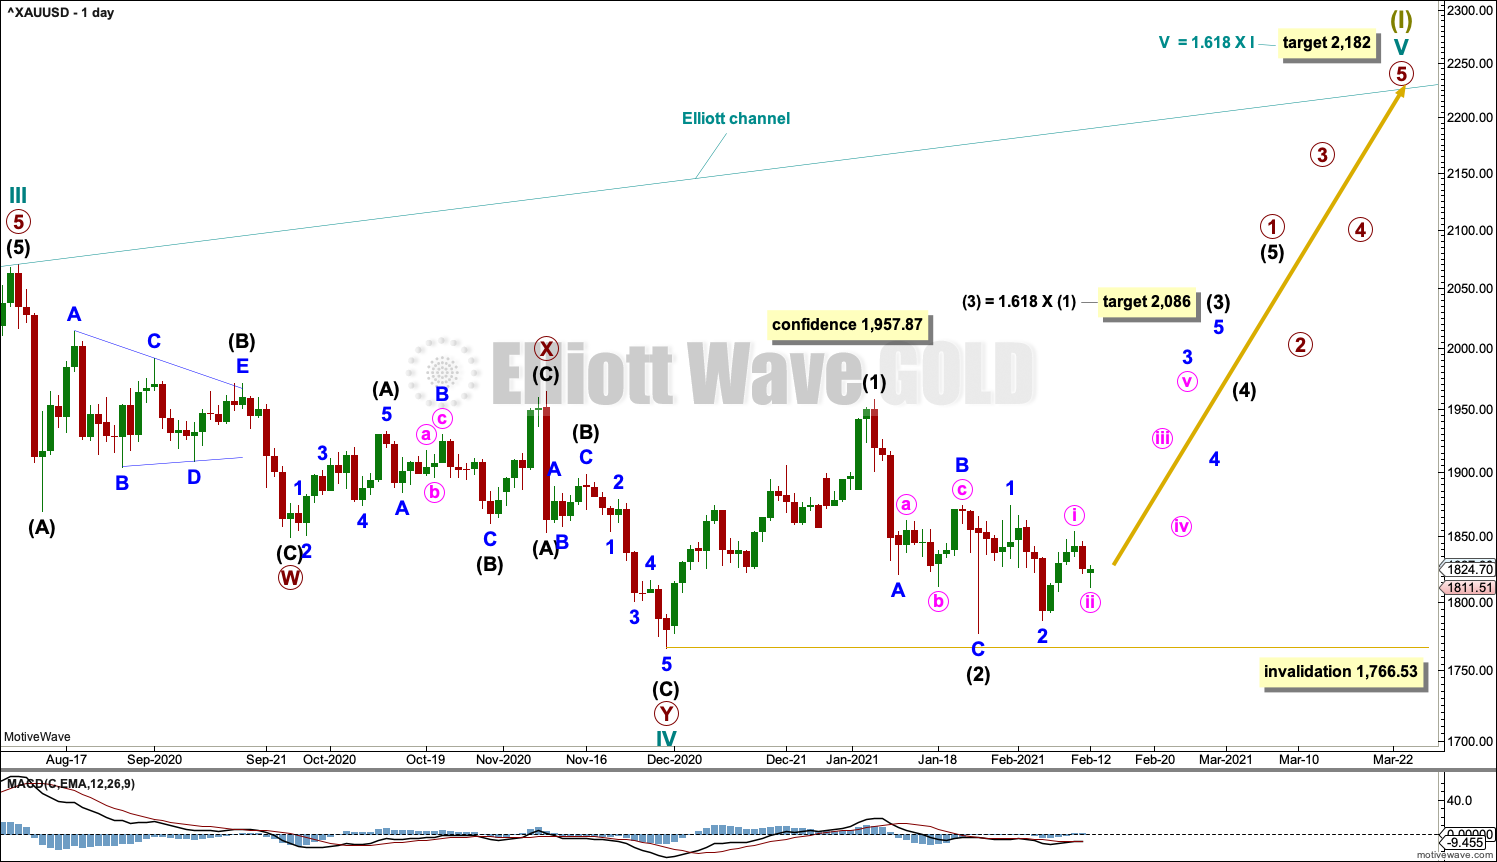
Click chart to enlarge.
Cycle wave IV may be over as a double zigzag.
A new swing high above 1,957.87 would add reasonable confidence to this wave count. Finally, a new all time high would add strong confidence to this wave count.
If cycle wave IV is complete, then it would have lasted only 17 weeks compared to 119 weeks for cycle wave II. While it is normal for Gold to exhibit fourth waves that are more brief than their counterpart second waves, a difference this great is unusual. This reduces the probability of this wave count.
When primary wave 1 within cycle wave V is complete, then primary wave 2 may not move beyond the start of primary wave 1 below 1,766.53.
Intermediate wave (1) may have ended at the last swing high. Intermediate wave (1) will subdivide on lower time frames as a five wave structure, but at the daily chart level it does not look like a normal five wave impulse, which reduces the probability of this wave count.
Intermediate wave (2) may have completed as a zigzag. If it continues lower, as a double combination or a double zigzag, then intermediate wave (2) may not move beyond the start of intermediate wave (1) below 1,766.53.
SECOND ELLIOTT WAVE COUNT
ALTERNATE WEEKLY CHART
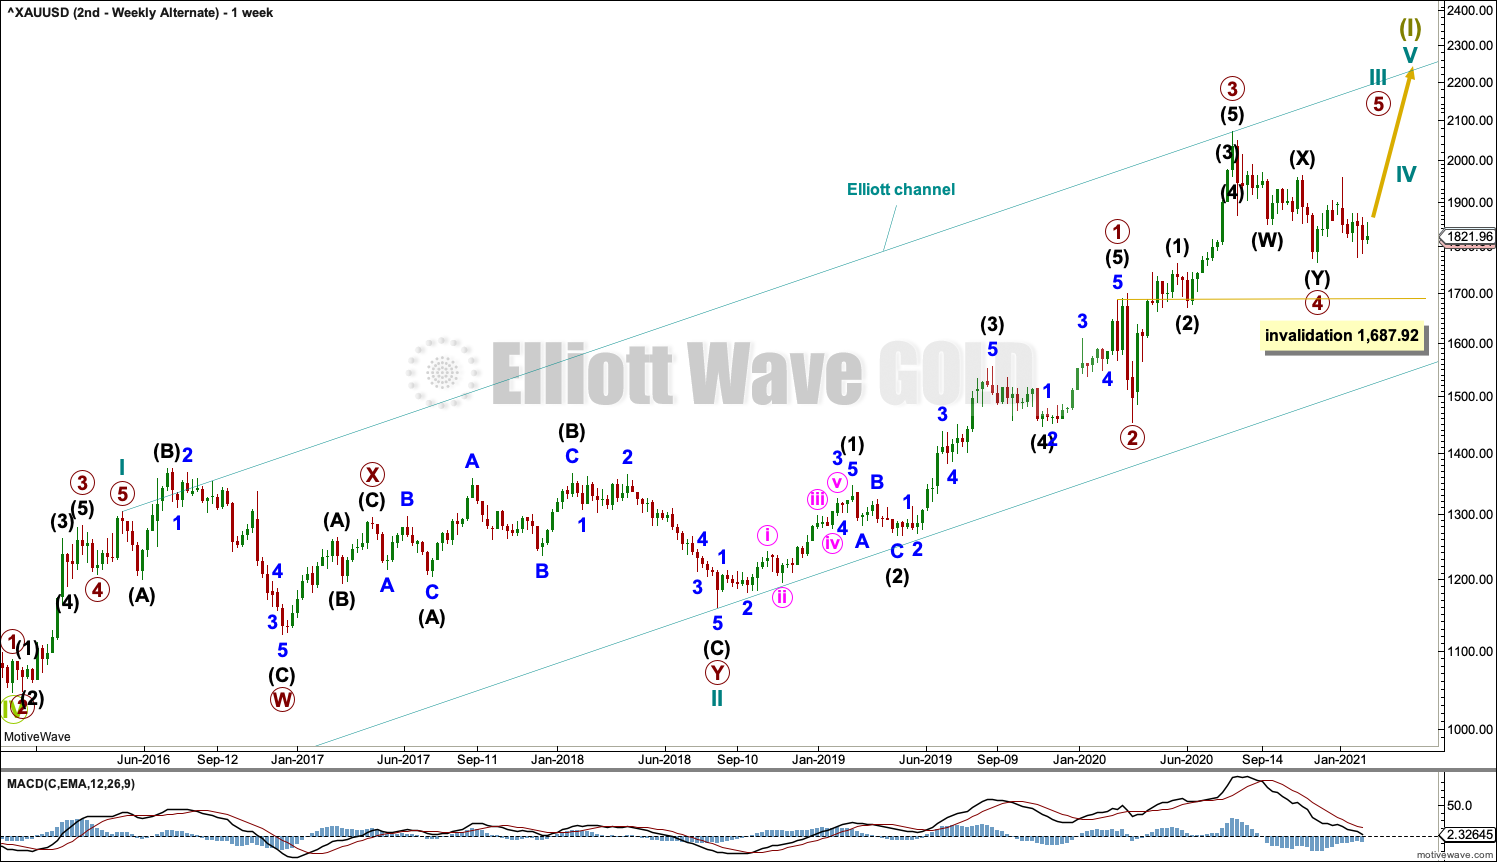
Click chart to enlarge.
It is possible for the second wave count that cycle wave III may be an incomplete impulse. Primary wave 5 within the impulse may be underway.
If primary wave 4 continues lower, then it may not move into primary wave 1 price territory below 1,687.92.
Primary wave 3 is longer than primary wave 1 (the chart is on a semi-log scale, which gives the illusion that primary wave 3 is shorter). There is no Fibonacci ratio between primary waves 3 and 1.
There is alternation between an expanded flat of primary wave 2 and a double zigzag of primary wave 4. Both are of a similar depth. Primary wave 2 lasted 3 weeks while primary wave 4 lasted 17 weeks. It is unusual for Gold to exhibit fourth waves that are much longer lasting than counterpart second waves. The probability of this wave count is reduced.
TECHNICAL ANALYSIS
WEEKLY CHART
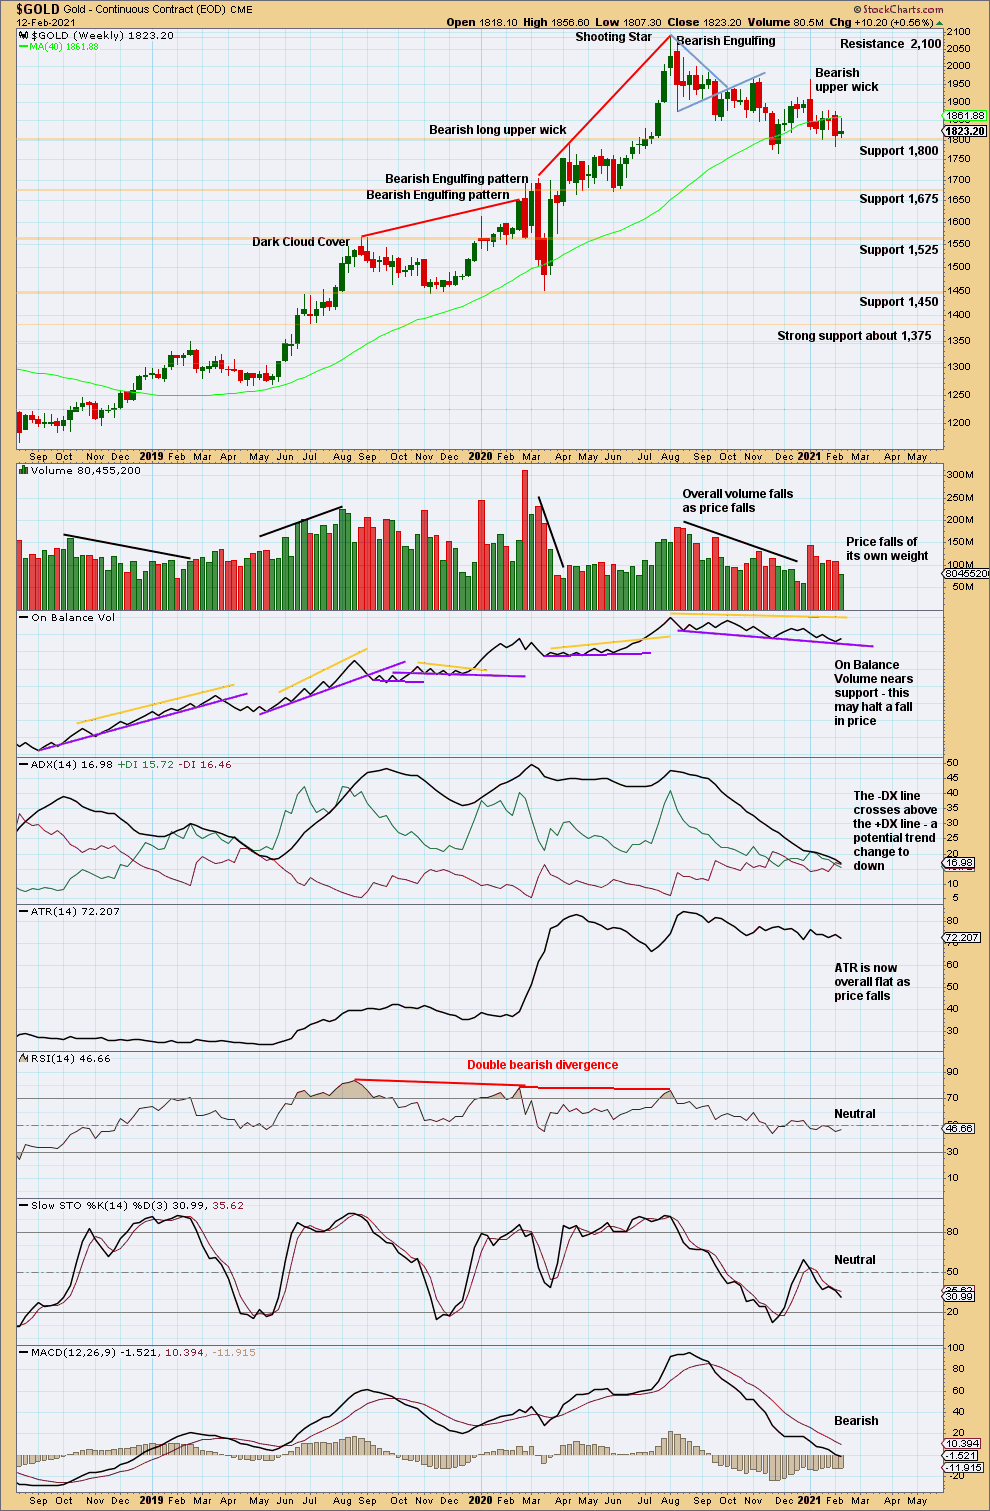
Click chart to enlarge. Chart courtesy of StockCharts.com.
At the last high were two bearish candlestick patterns with overbought RSI exhibiting double bearish divergence. It is possible there may have been a 180° trend change at the high. A new swing low below 1,671.70 would add confidence in that view.
From the all time high is now a series of two lower swing highs and three lower swing lows, which may be a new downwards trend. However, downwards movement from the all time high has now lasted long enough to bring ADX and RSI down from extreme, so there is again room for an upwards trend to continue.
Price and On Balance Volume both remain above support.
It remains possible that either the bullish or bearish Elliott wave count may be correct. An open mind for both possibilities is still required.
DAILY CHART
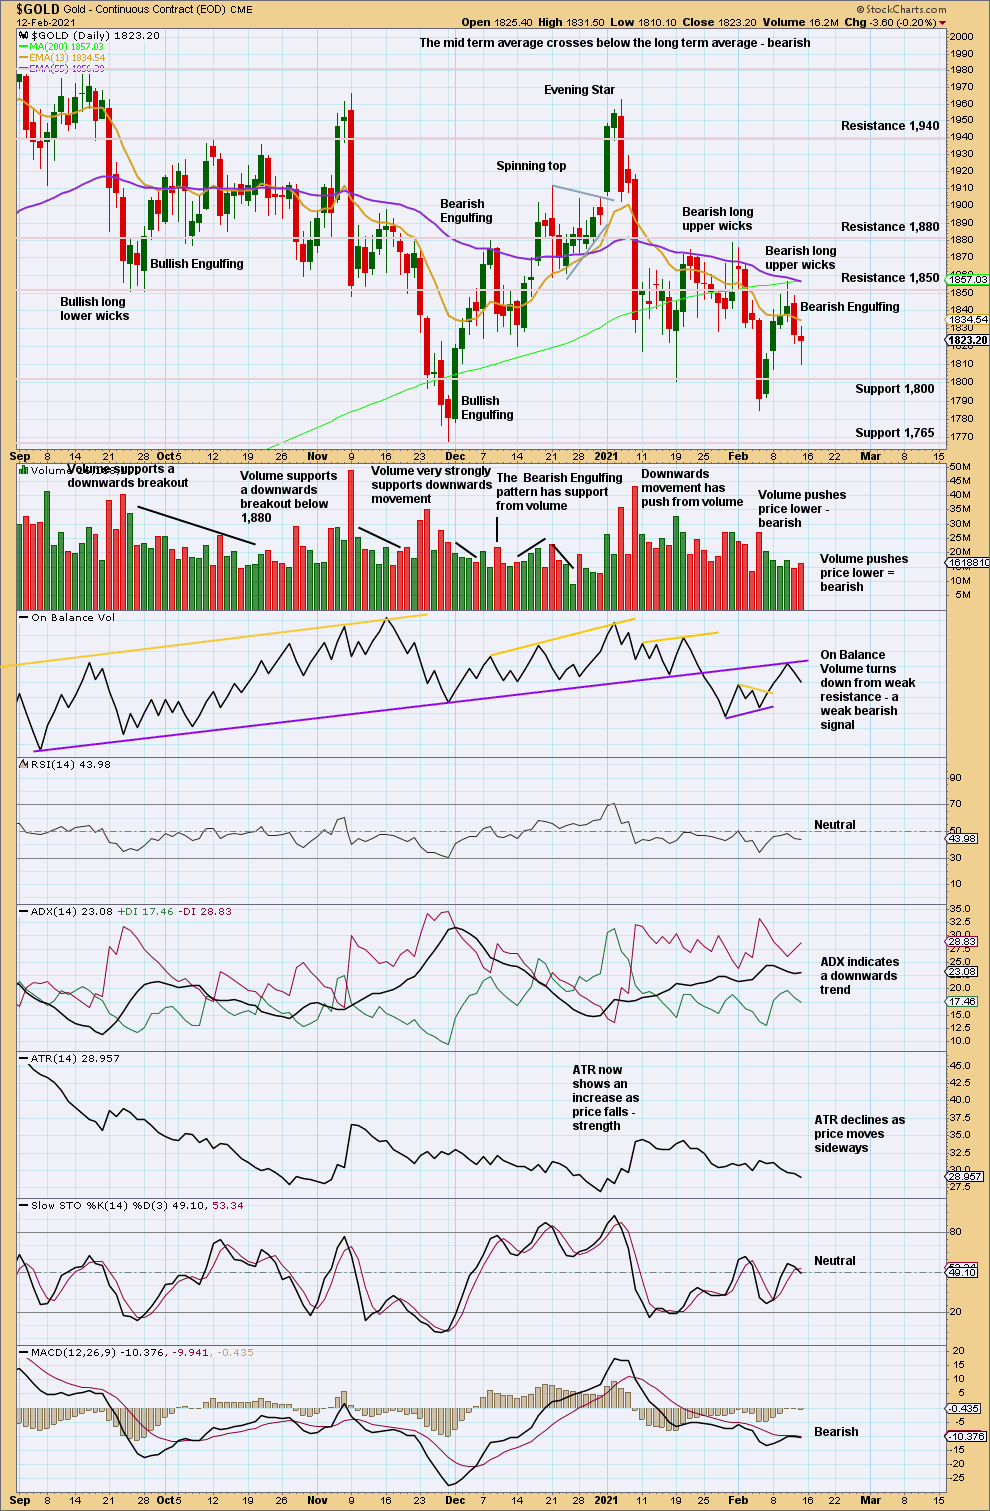
Click chart to enlarge. Chart courtesy of StockCharts.com.
From the high on August 7, 2020, there has been a series of lower lows and lower highs. While the last swing high now on the 6th of January at 1,962.50 remains intact, then this view of a possible downwards trend, at least at the daily chart level, should remain dominant.
Downwards movement has strong push from volume and increasing ATR.
Overall, this chart remains bearish. There is still most likely a downwards trend, but within this trend are deep and time consuming bounces. RSI is not oversold, and the trend is not extreme.
This week the 50 day moving average has crossed below the 200 day moving average, a “death cross”. This adds a little more support to a bearish Elliott wave count.
GDX WEEKLY CHART
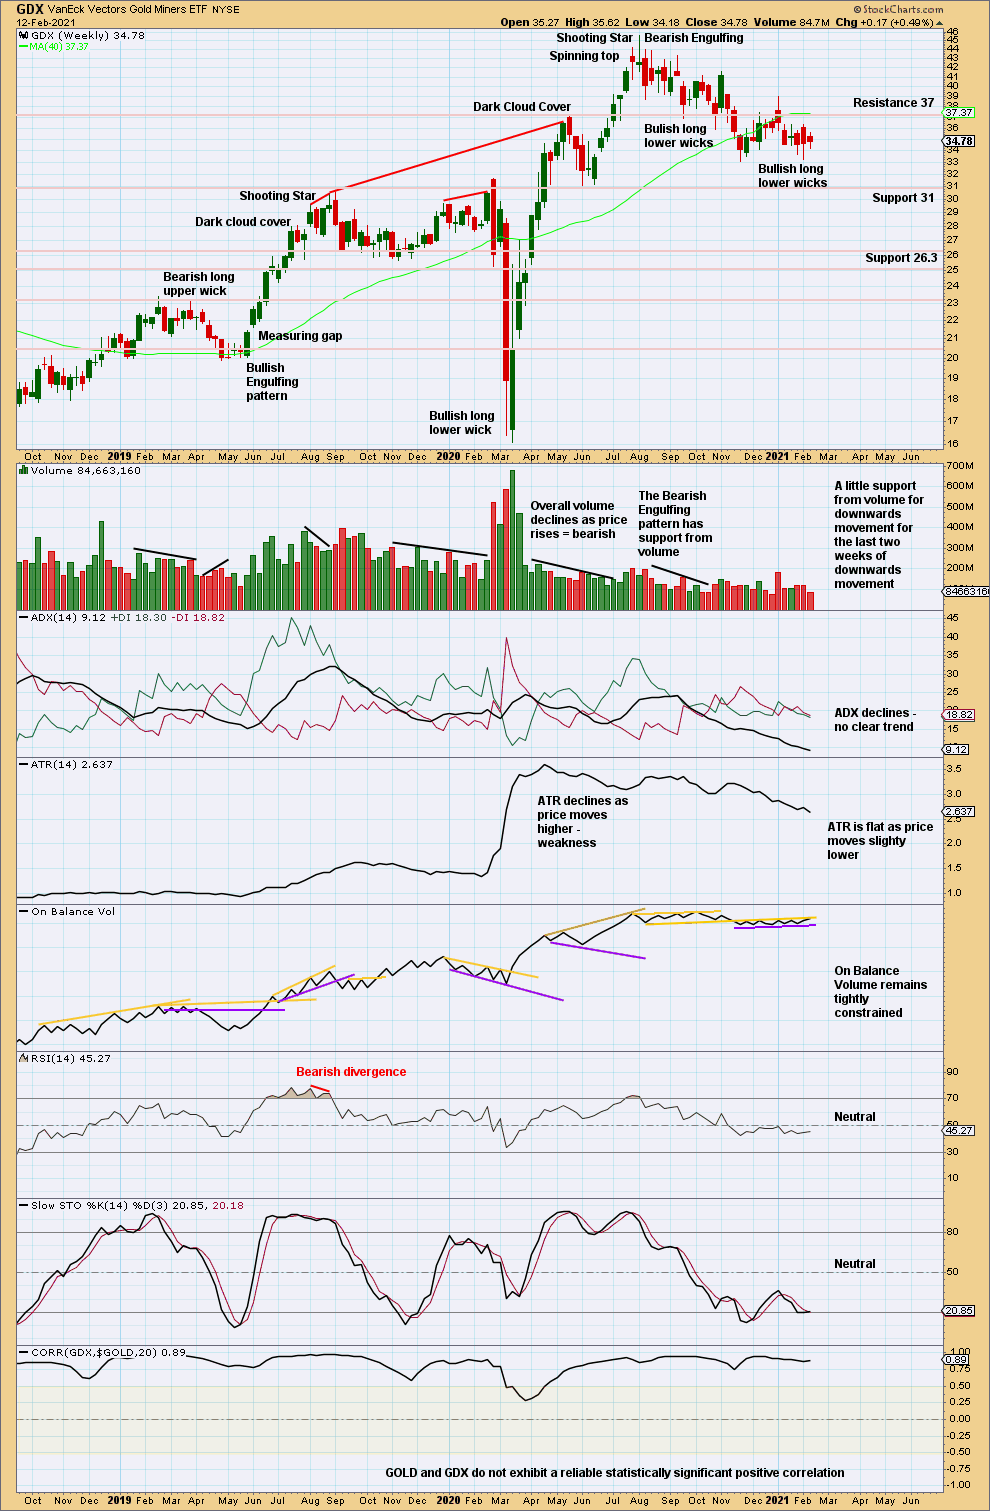
Click chart to enlarge. Chart courtesy of StockCharts.com.
If GDX makes a new swing high above 41.59 and On Balance Volume breaks above resistance, then the pullback of the last several weeks since the high in August 2020 may be considered over.
Currently, GDX is consolidating. A breakout is required for confidence in the next direction.
GDX DAILY CHART
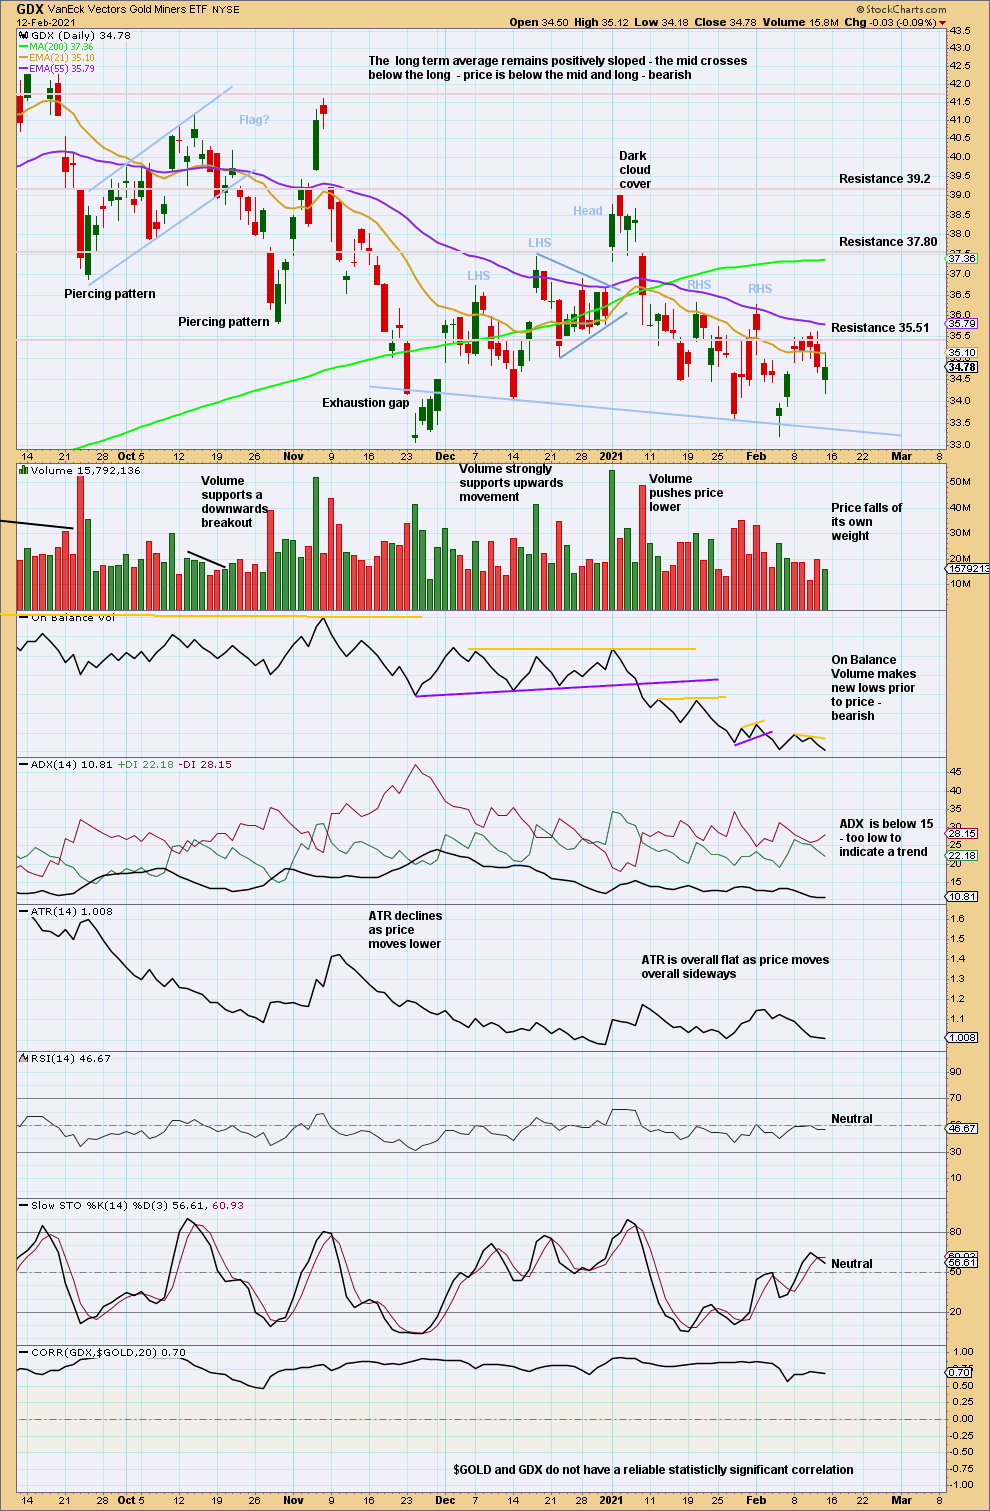
Click chart to enlarge. Chart courtesy of StockCharts.com.
Overall, from the high on August 5th, there is still a series of lower lows and lower highs, the basic definition of a downwards trend. For this view to change a new high above 39.01 would have to be seen.
The mid-term 55 day average has crossed below the long-term 200 day average. This crossover is bearish.
A possible complex Head and Shoulders pattern is identified. The neck line is drawn from the two troughs between the outer shoulders. A target calculated from the height of the pattern is about 28.30. This pattern requires a downwards breakout, with a close below the neckline, before the target may be used.
US OIL
The next target for upwards movement to be interrupted was at 58.41. Price this week has passed this target by 1.4.
Summary: Assume price will keep going up while price remains within the best fit channel on the daily chart. The next possible target for an interruption to this trend may be at 61.11.
A breach of the best fit channel would indicate a trend change and the start of a multi-week pullback or consolidation. Likewise, a bearish candlestick pattern on the daily chart should be given much weight; in these extreme conditions, it may signal a trend change.
A longer-term target for a third wave is at 87.90 or 121.43.
Oil may have found a major sustainable low in April 2020.
ELLIOTT WAVE COUNT
MONTHLY CHART
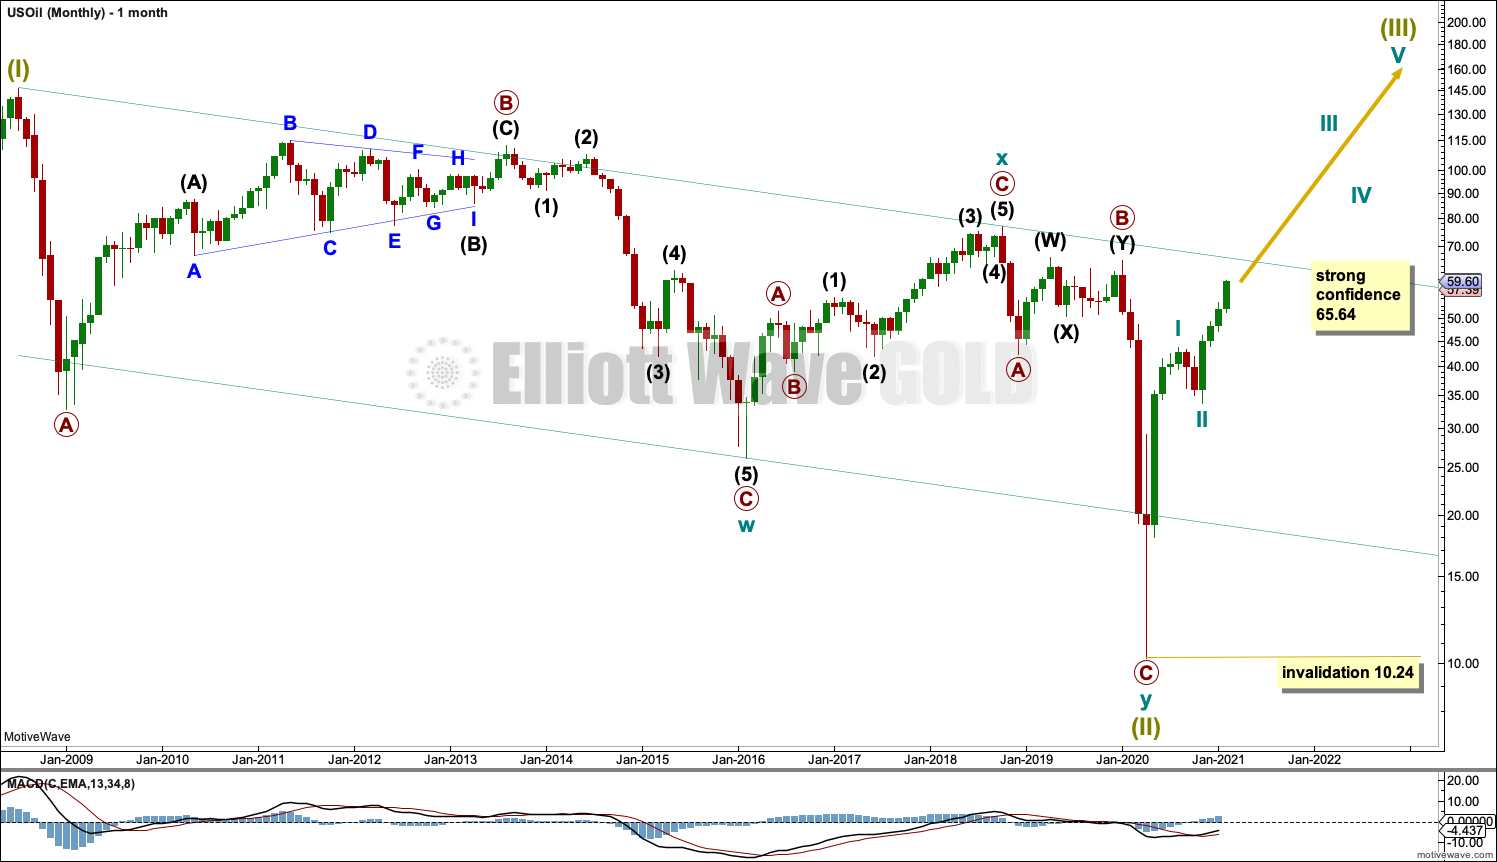
Click chart to enlarge.
The basic Elliott wave structure is five steps forward and three steps back. This Elliott wave count expects that US Oil has completed a three steps back pattern, which began in July 2008. The Elliott wave count expects that the bear market for US Oil may now be over.
Following Super Cycle wave (II), which was a correction (three steps back), Super Cycle wave (III), which may have begun, should be five steps up when complete. Super Cycle wave (III) may last a generation and must make a new high above the end of Super Cycle wave (I) at 146.73.
A channel is drawn about Super Cycle wave (II): draw the first trend line from the start of cycle wave w to the end of cycle wave x, then place a parallel copy on the end of cycle wave w. This trend line is breached, which is a typical look for the end of a movement for a commodity.
The upper edge of the channel may provide resistance. If resistance is breached, then the upper edge may provide support for a back test.
Super Cycle wave (III) may only subdivide as a five wave impulse. New trends for Oil usually start out very slowly with short first waves and deep time consuming second wave corrections. However, while this is a common tendency, it is not always seen and may not have been seen in this instance. The first reasonably sized pullback may be over already.
WEEKLY CHART
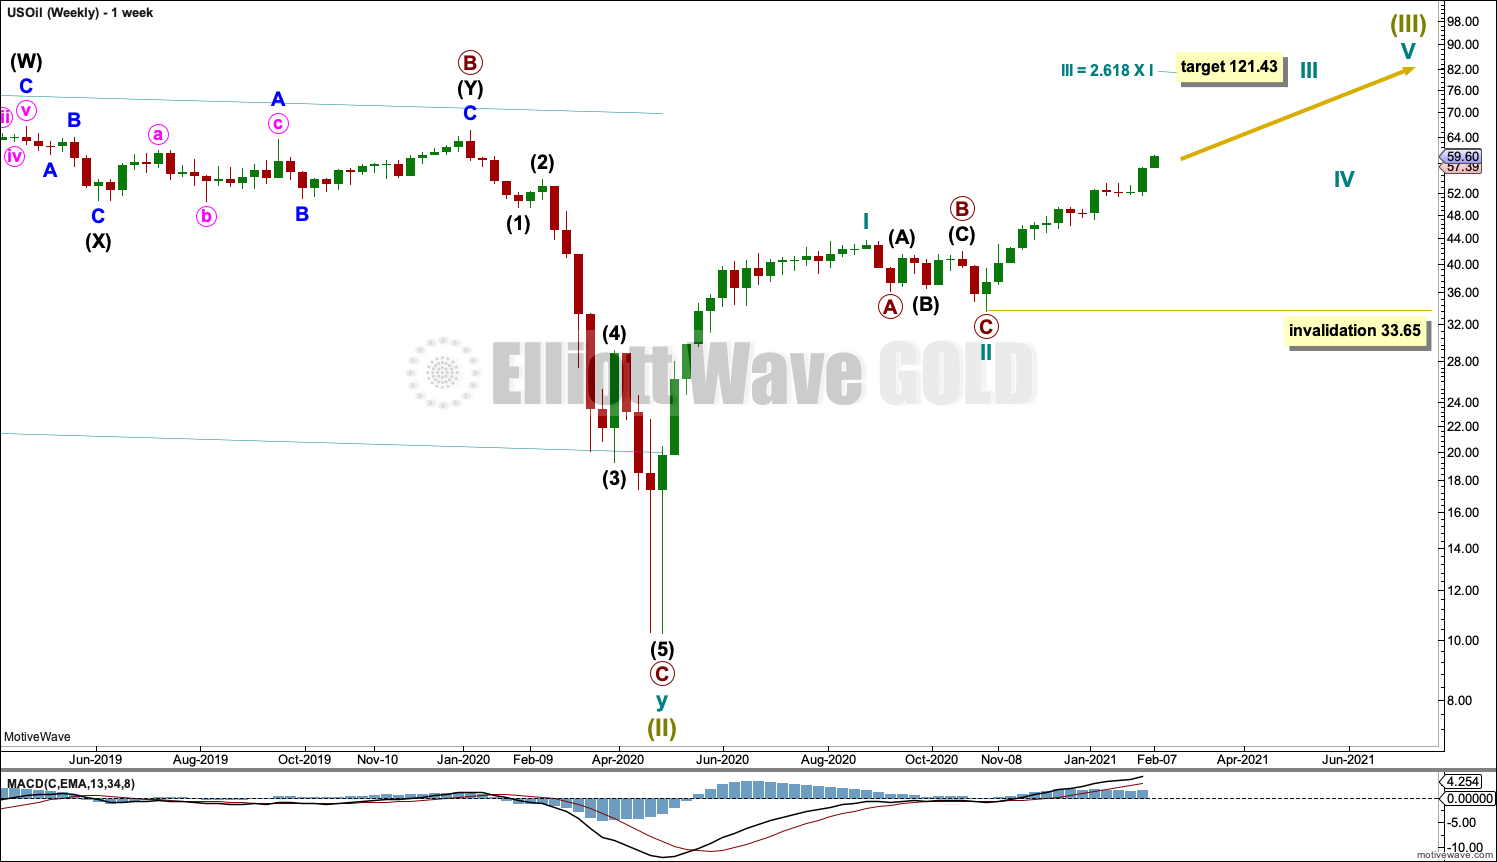
Click chart to enlarge.
Super Cycle wave (III) must subdivide as an impulse. Cycle wave I within the impulse may be complete. Cycle wave II may also now be complete, and cycle wave III upwards may now have begun. If cycle wave II continues lower, then it may not move beyond the start of cycle wave I below 10.24.
There is only one daily chart following this main weekly chart. An alternate is presented below on a weekly chart.
DAILY CHART
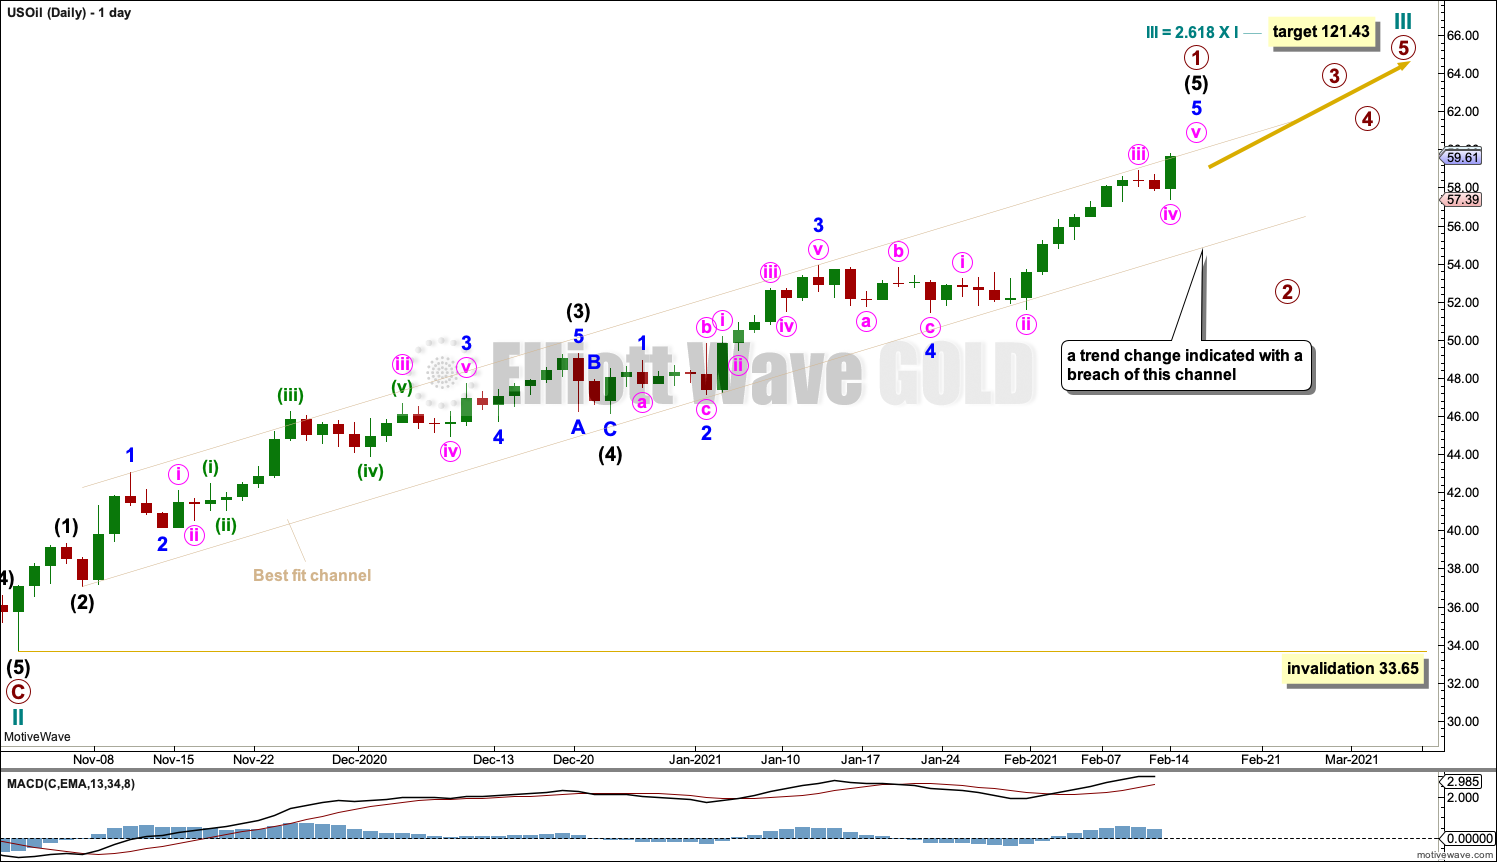
Click chart to enlarge.
Cycle wave III may only subdivide as an impulse. Within the impulse: Primary wave 1 may be either complete at this week’s high or may complete very soon, and primary wave 2 may not move beyond the start of primary wave 1 below 33.65.
Intermediate wave (5) within primary wave 1 may now be a complete structure. However, there is as yet no evidence of a trend change in the form of a bearish candlestick pattern or a trend channel breach. The next possible target for intermediate wave (5) to end would be at 61.11, where it would reach 2.618 the length of intermediate wave (1).
Use the best fit channel as a guide to when primary wave 1 may be over. At least one full daily candlestick of downwards movement (not sideways) below and not touching the lower trend line would constitute a breach. A breach of this channel would indicate a trend change. Assume the upwards trend remains while price continues higher and remains within the channel. Be aware though that the trend is now extreme and may end at any time.
When the channel is breached, then draw a Fibonacci retracement along the length of primary wave 1. The 0.382 and 0.618 Fibonacci ratios would be targets for primary wave 2.
When primary wave 1 is complete, then a multi-week pullback or consolidation for primary wave 2 should begin.
ALTERNATE WEEKLY CHART
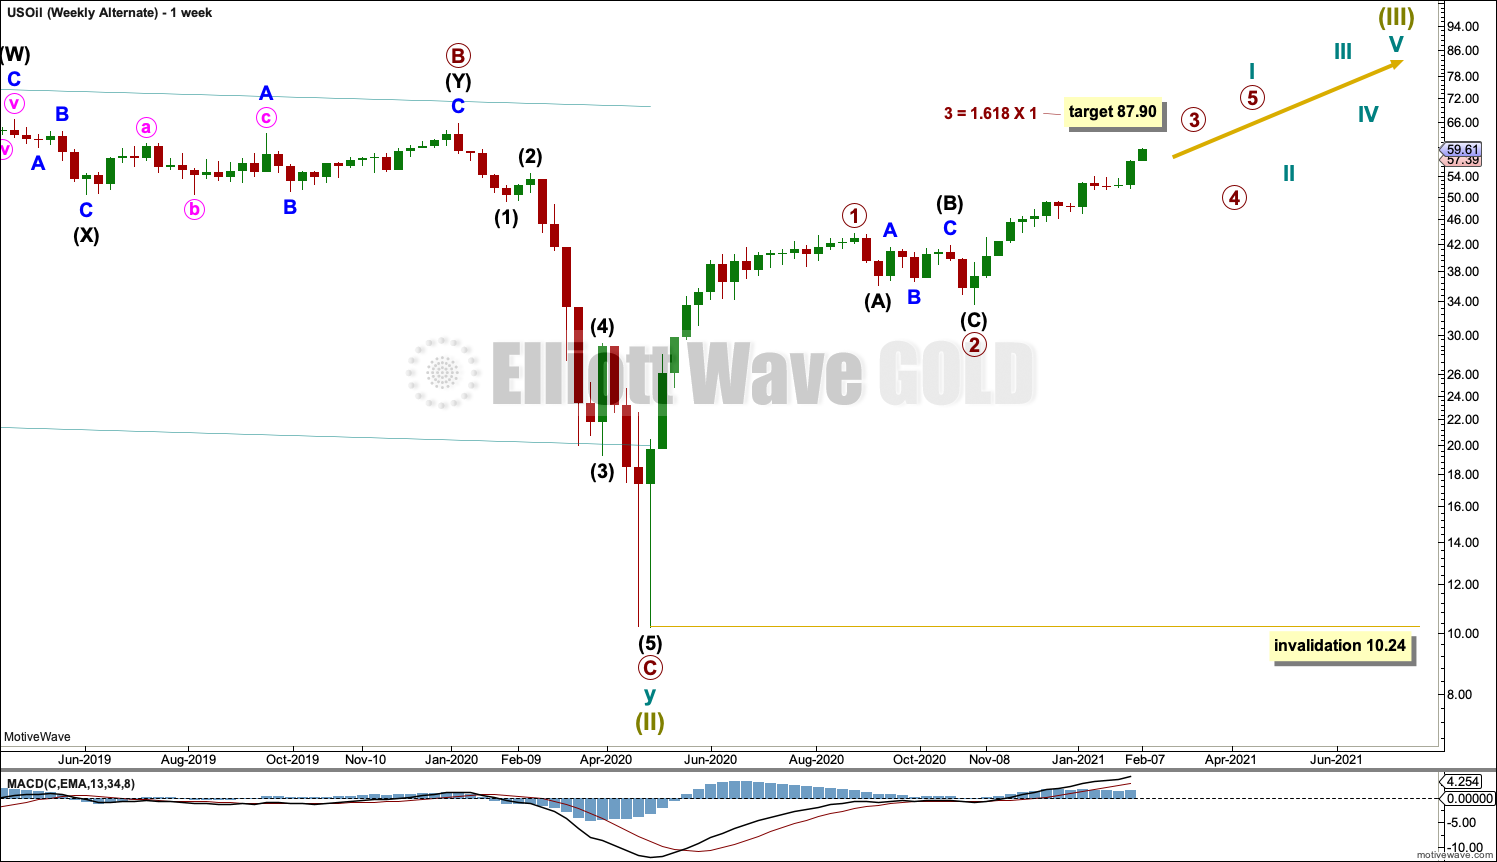
Click chart to enlarge.
This alternate wave count moves the degree of labelling within the start of the bull market down one degree. It is possible that cycle wave I is incomplete.
The target for primary wave 3 is lower than the target on the first wave count.
A daily chart for this alternate would be the same as the daily chart for the main wave count, except the degree of labelling would be one degree lower. The channel would be the same.
TECHNICAL ANALYSIS
WEEKLY CHART
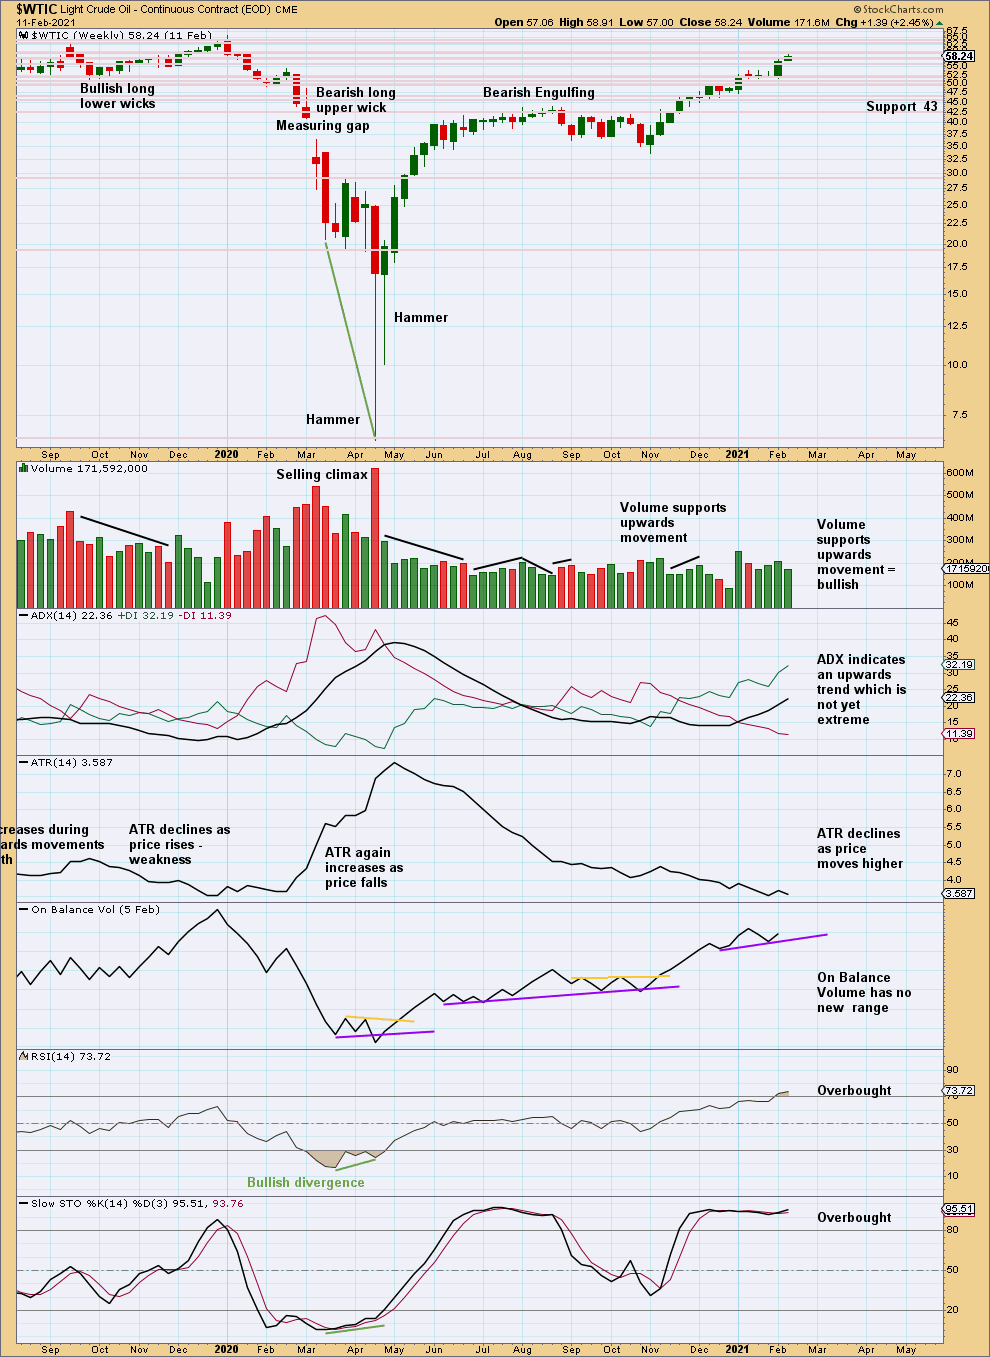
Click chart to enlarge. Chart courtesy of StockCharts.com.
Price is within a cluster of resistance and support; this may slow it down.
RSI this week remains overbought, but it may become more deeply overbought before a trend ends. ADX is still not extreme; there is room for this upwards trend to continue.
DAILY CHART
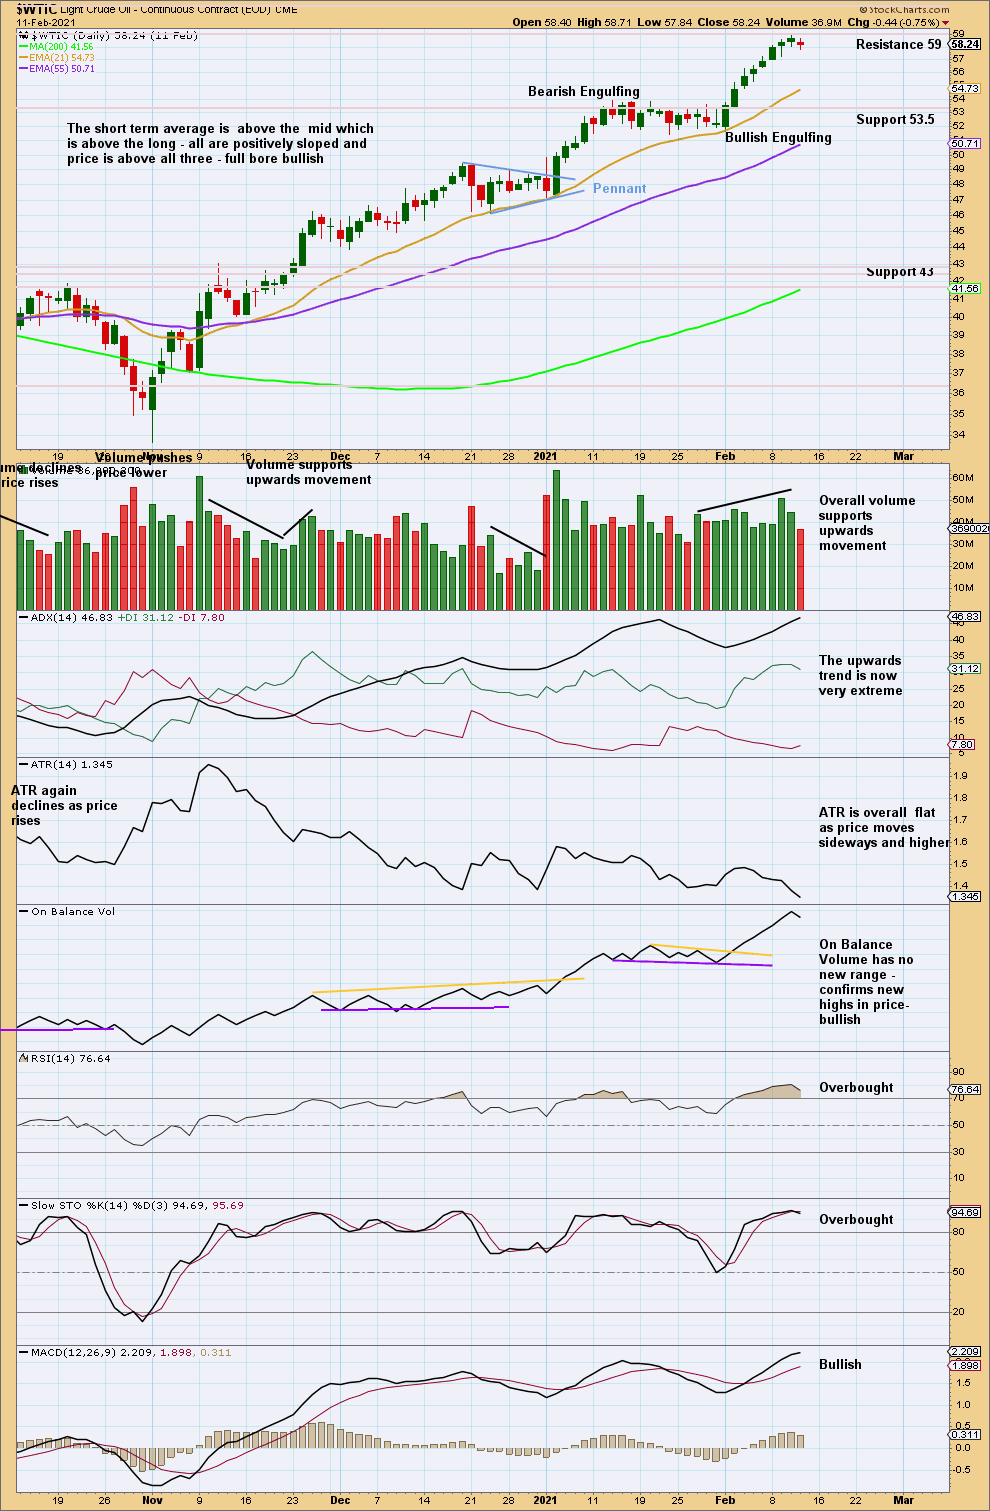
Click chart to enlarge. Chart courtesy of StockCharts.com.
At the daily chart level, this upwards trend is now very extreme and RSI is overbought. While this market can sustain extreme conditions for a reasonable time while price continues to move a reasonable distance, conditions are now beginning to be overstretched. The risk of a trend change is now increasing.
In these conditions, a bearish candlestick pattern should be given much weight.
Assume the upwards trend remains until proven otherwise.
—
Always practice good risk management as the most important aspect of trading. Always trade with stops and invest only 1-5% of equity on any one trade. Failure to manage risk is the most common mistake new traders make.