
GOLD: Elliott Wave and Technical Analysis | Charts – March 19, 2021
The week ends with a little upwards movement that lacks range and support from volume.
The Elliott wave counts remain the same at the daily and weekly chart level.
Summary: The first wave count is bearish for the bigger picture and classic technical analysis supports this view. This wave count expects a multi-year bear market may be in its early stages to end below 1,046.
Downwards momentum may show a further increase. A short-term target is at 1,645, but this may not be low enough. A long-term target is at 657.
The second wave count is bullish. A new upwards wave may now begin. The target is at 2,124.
Grand SuperCycle analysis is here.
Last analysis of monthly charts is here.
FIRST ELLIOTT WAVE COUNT
WEEKLY CHART
Click chart to enlarge.
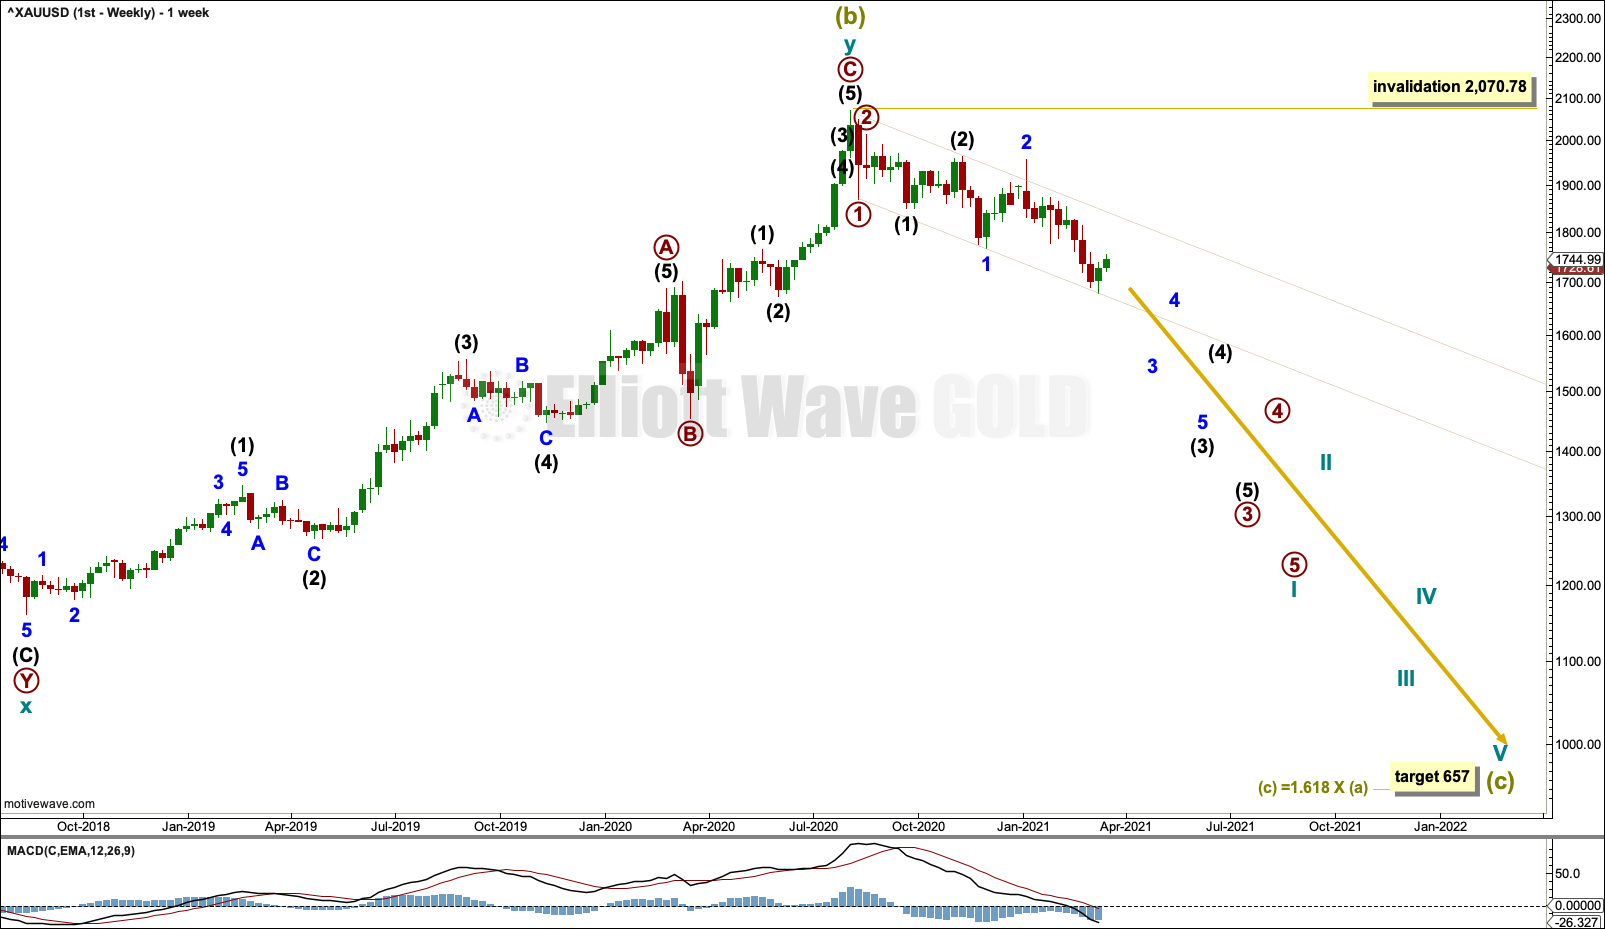
The bigger picture for this first Elliott wave count sees Gold as now within a bear market, in a three steps back pattern that is labelled Grand Super Cycle wave IV on monthly charts. Grand Super Cycle wave IV may be subdividing as an expanded flat pattern.
Super Cycle wave (b) within Grand Super Cycle wave IV may be a complete double zigzag. This wave count expects Super Cycle wave (c) to move price below the end of Super Cycle wave (a) at 1,046.27 to avoid a truncation and a very rare running flat. The target calculated expects a common Fibonacci ratio for Super Cycle wave (c).
DAILY CHART
Click chart to enlarge.
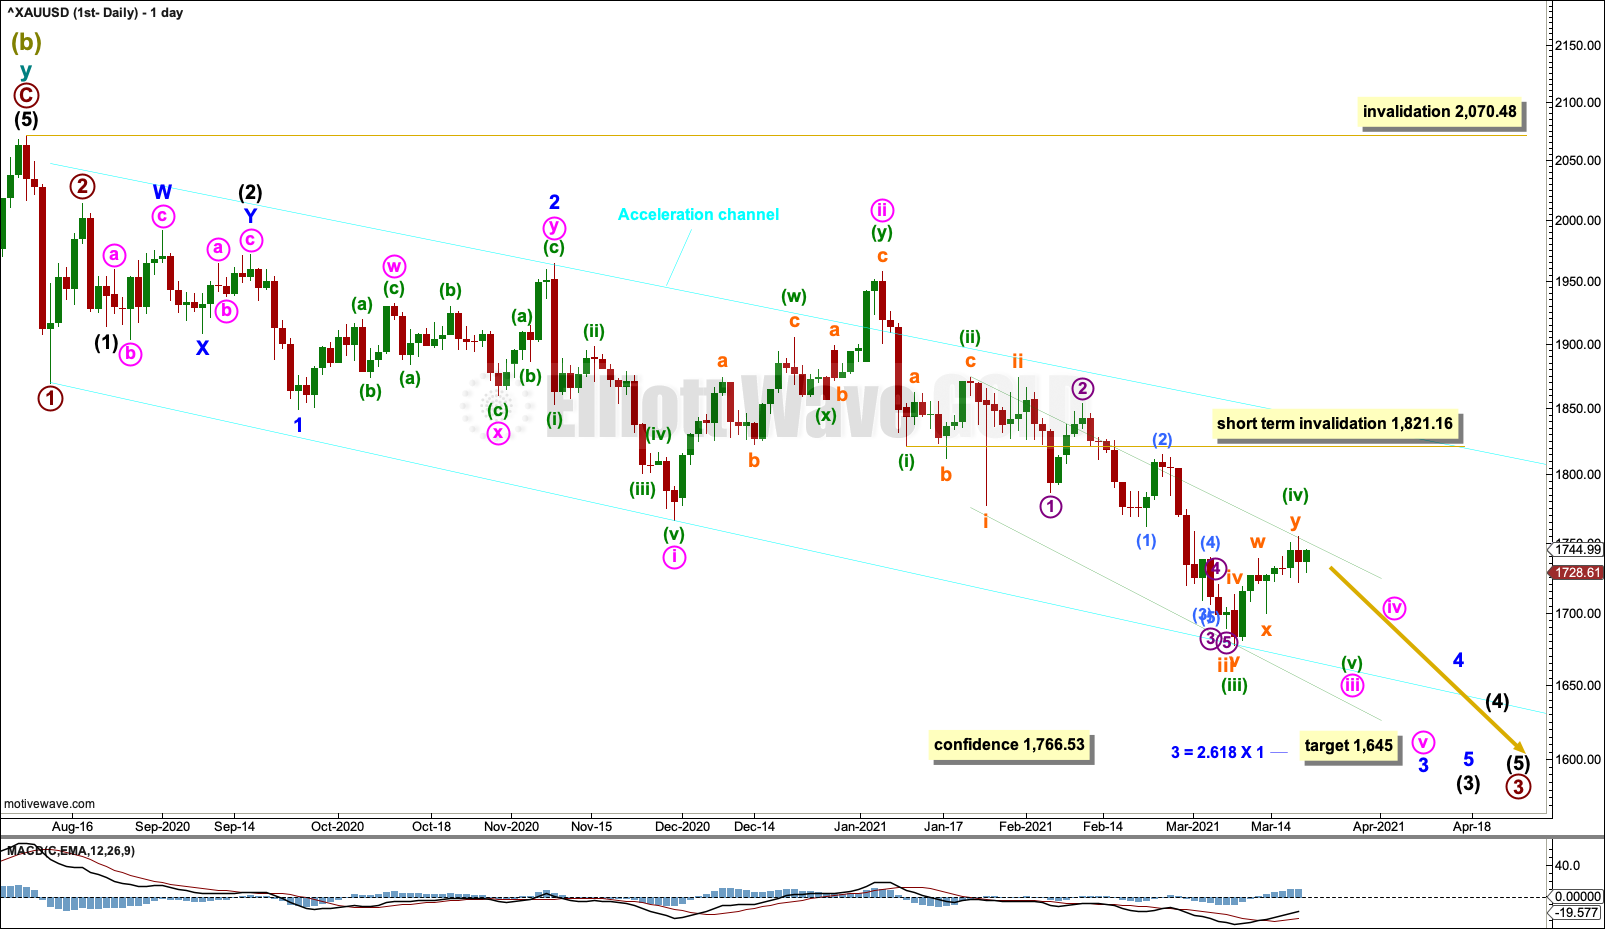
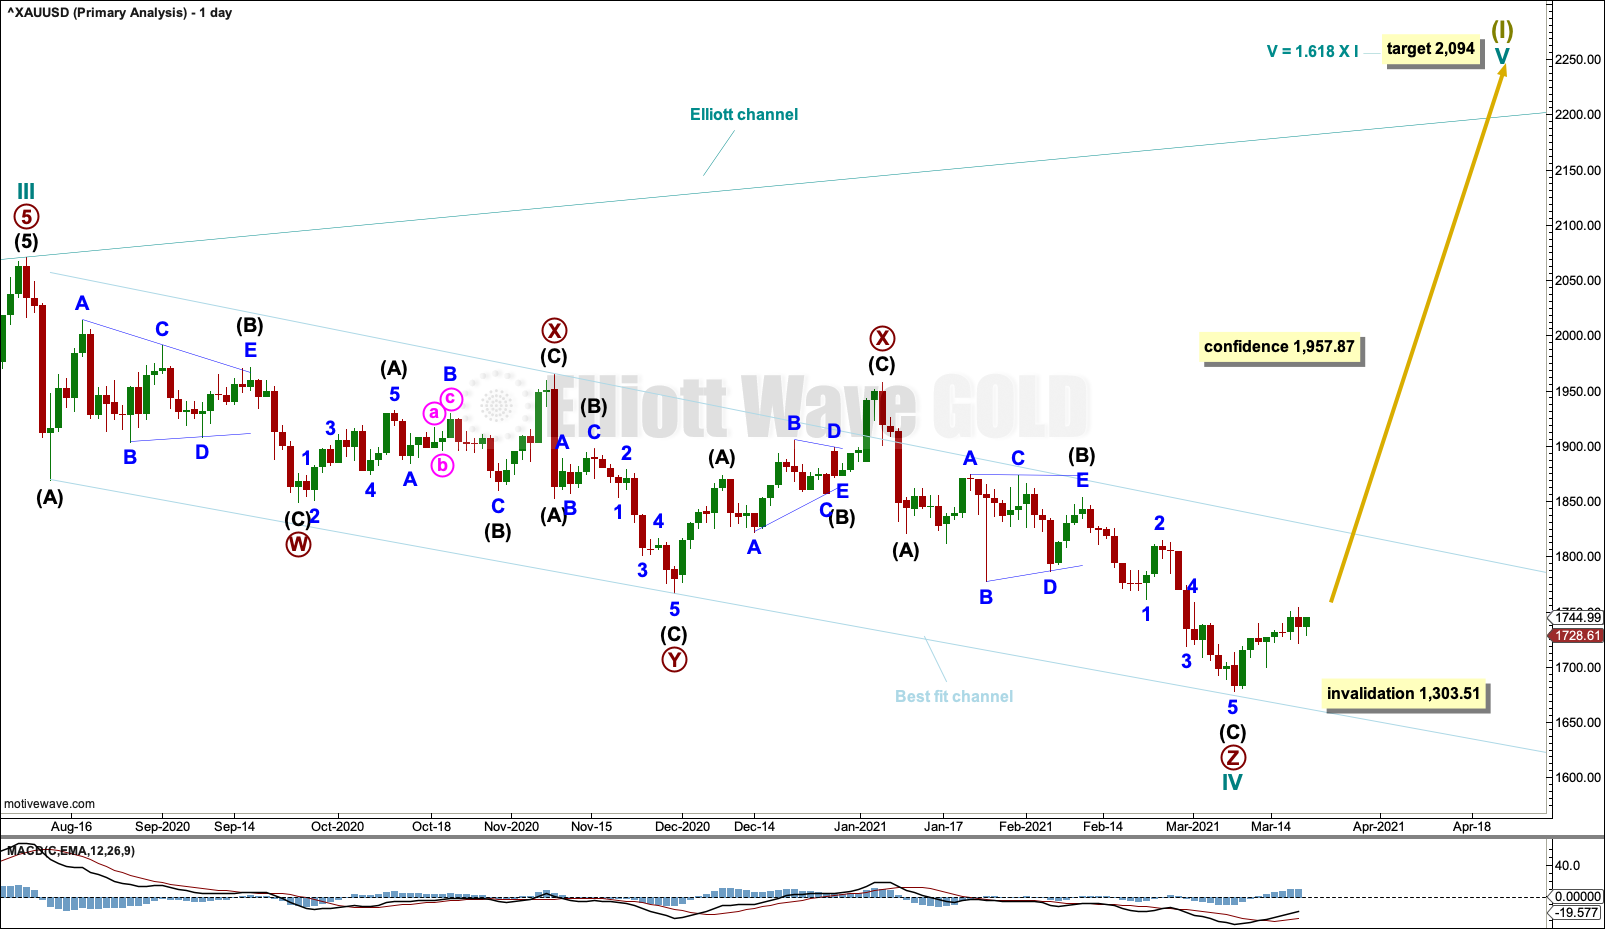
Within a new bear market, cycle wave I may be an incomplete five wave impulse.
Cycle wave II within the new downwards trend may not move beyond the start of cycle wave I above 2,070.48.
Gold typically exhibits extended and strong fifth waves; this tendency is especially prevalent for fifth waves to end third wave impulses one degree higher. One or more of minuette wave (v), minute wave v, minor wave 5 or intermediate wave (5) may exhibit this tendency; there may be one or more selling climaxes along the way down. Minute wave iv and minor wave 4 may be relatively brief and shallow.
Draw an acceleration channel about downwards movement. Draw the first trend line from the end of primary wave 1 to the last low, then place a parallel copy on the end of primary wave 2. Keep redrawing the channel as price continues lower. When primary wave 3 is complete, then this would be drawn using Elliott’s first technique and may show where primary wave 4 may find resistance.
The channel about minute wave iii is redrawn using Elliott’s second technique. The first trend line is drawn from the ends of minuette waves (ii) to (iv), then a copy is pulled lower to the end of minuette wave (iii). Minuette wave (v) may end mid way within the channel or about its lower edge.
Minuette wave (iv) may not move into minuette wave (i) price territory above 1,821.16.
HOURLY CHART
Click chart to enlarge.
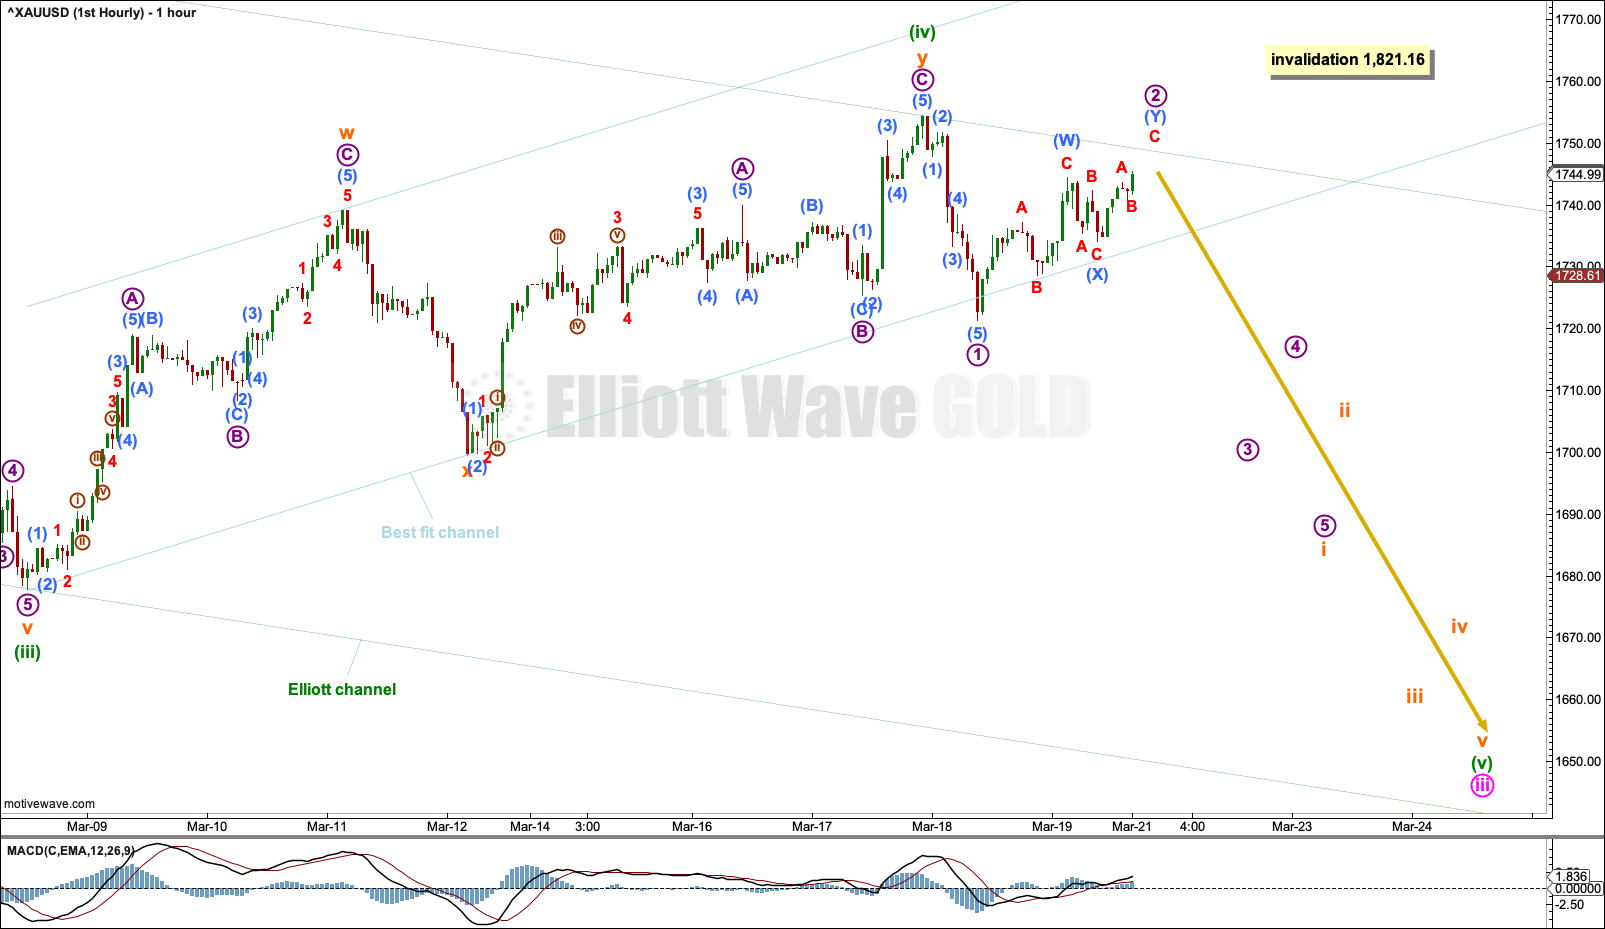
Minuette wave (iv) may be complete as a double zigzag. This has a good fit.
If minuette wave (iv) continues higher, then it may not move into minuette wave (i) price territory above 1,821.16.
Minuette wave (v) downwards may possibly exhibit an increase in momentum to end minute wave iii.
A channel is drawn about minuette wave (iv). When this light blue best fit channel is breached by downwards movement, then that may provide confidence that minuette wave (iv) should be over.
When confidence may be had that minuette wave (iv) is over, then a target for minuette wave (v) may be calculated.
SECOND ELLIOTT WAVE COUNT
WEEKLY CHART
Click chart to enlarge.
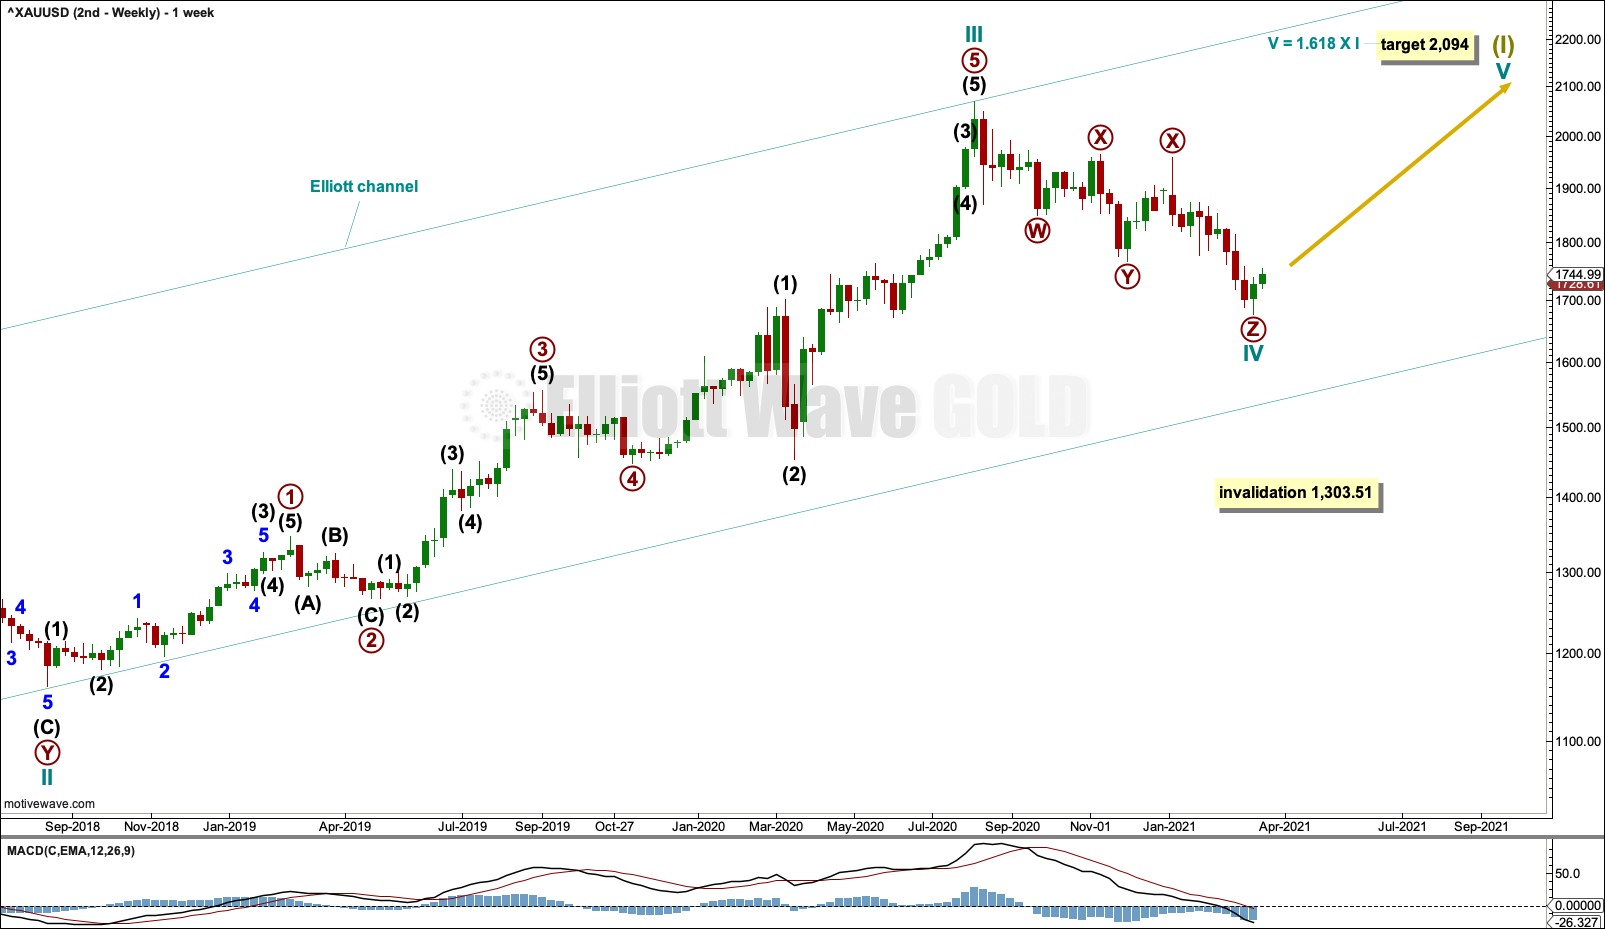
This wave count sees the the bear market complete at the last major low for Gold on 3 December 2015.
If Gold is in a new bull market, then it should begin with a five wave structure upwards on the weekly chart.
Cycle wave I fits as a five wave impulse with reasonably proportionate corrections for primary waves 2 and 4.
Cycle wave II fits as a double flat. However, within the first flat correction labelled primary wave W, this wave count needs to ignore what looks like an obvious triangle from July to September 2016 (this can be seen labelled as a triangle on the second weekly chart on prior analysis here). This movement must be labelled as a series of overlapping first and second waves. Ignoring this triangle reduces the probability of this wave count in Elliott wave terms.
Cycle wave IV has moved lower; it may again be a complete triple zigzag. The rarity of triple zigzags reduces the probability of this wave count further.
If the third zigzag of primary wave Z continues lower, then cycle wave IV may not move into cycle wave I price territory below 1,303.51.
DAILY CHART
Click chart to enlarge.
Cycle wave IV may be a complete triple zigzag.
The purpose of multiple zigzags is to deepen a correction when the first zigzag does not move price deep enough. To achieve this purpose multiple zigzags normally have a clear counter trend slope. Cycle wave IV looks normal with a clear downwards slope.
A target is recalculated for cycle wave V. If cycle wave IV continues lower, then this target must again be recalculated.
A best fit channel is drawn about cycle wave IV. If this channel is breached by upwards movement with at least one full daily candlestick above and not touching the upper edge of the channel, then that may provide confidence in this second Elliott wave count.
HOURLY CHART
Click chart to enlarge.
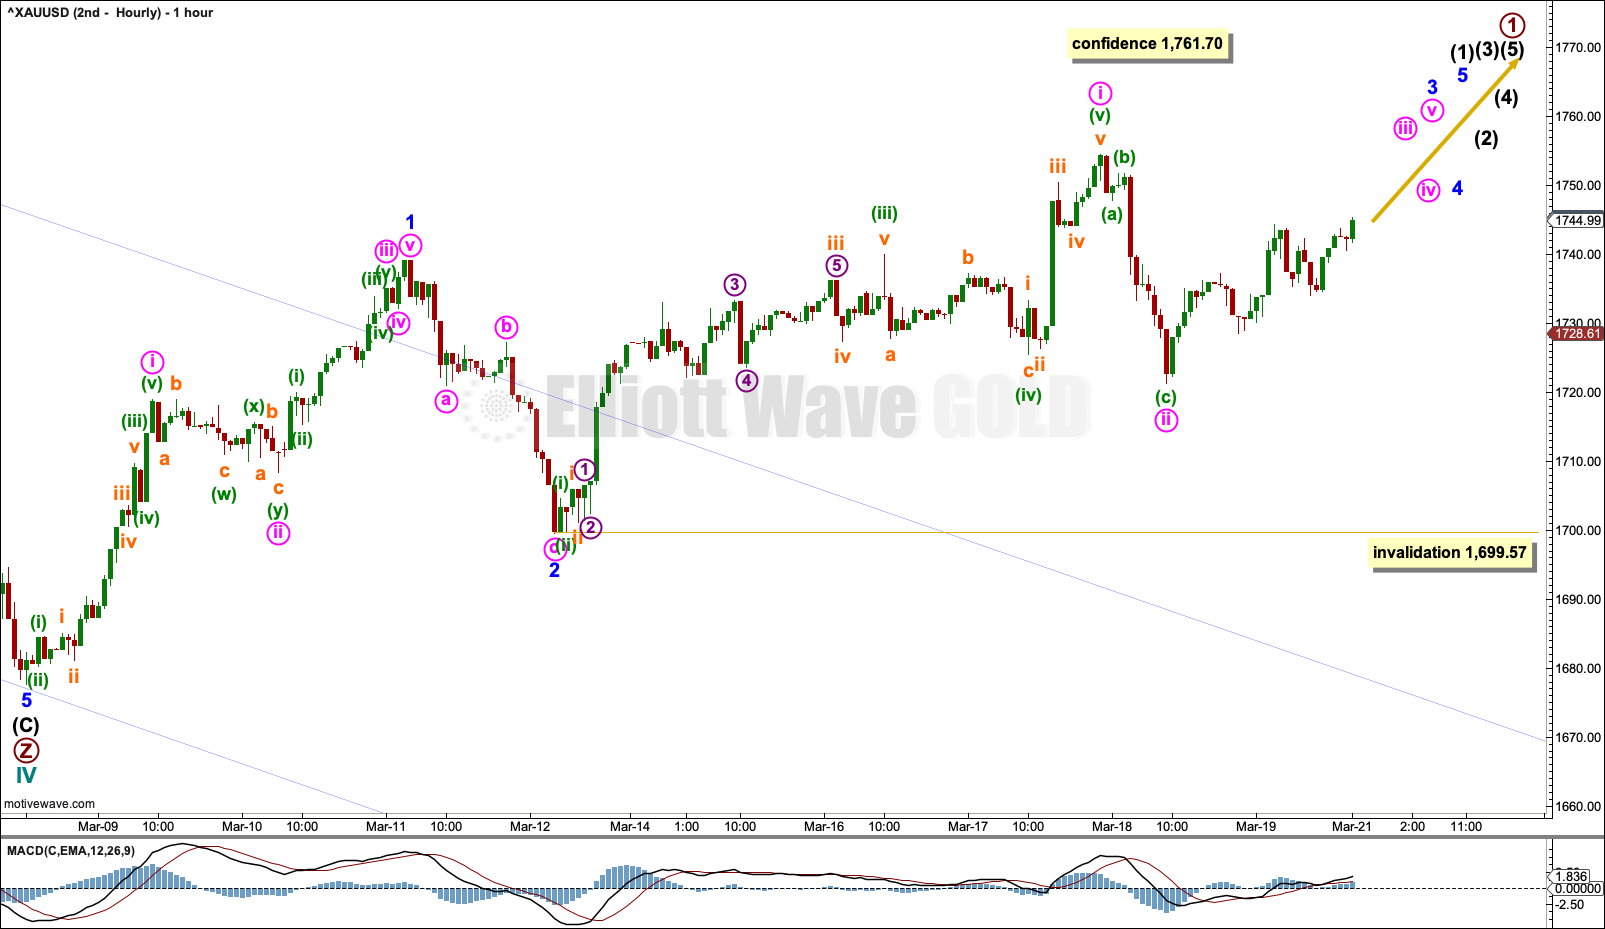
The hourly chart focusses on the beginning of cycle wave V.
Minor waves 1 and 2 within the new trend may be complete.
Minute wave i within minor wave 3 is now labelled as complete at the last high. Minute wave ii may also be complete.
Minute wave i is labelled as a complete five wave impulse. However, this part of the wave count seems forced and does not have the right look. While Gold’s impulses often have a curved three wave look, it is more like a hockey stick (for a bullish move) than an S shape as this is. This upwards wave fits better as a zigzag. Micro wave 3 within minute wave i does not subdivide well as an impulse at the hourly chart level.
If it continues further as a double zigzag or flat, then minute wave ii may not move beyond the start of minute wave i below 1,699.57.
A new high above 1,761.70 may not be a continuation of minor wave 4, as minor wave 4 may not overlap into minor wave 1 price territory. A new high above 1,761.70 would add confidence that intermediate wave (C) should be over and add confidence in a trend change.
TECHNICAL ANALYSIS
WEEKLY CHART
Click chart to enlarge. Chart courtesy of StockCharts.com.
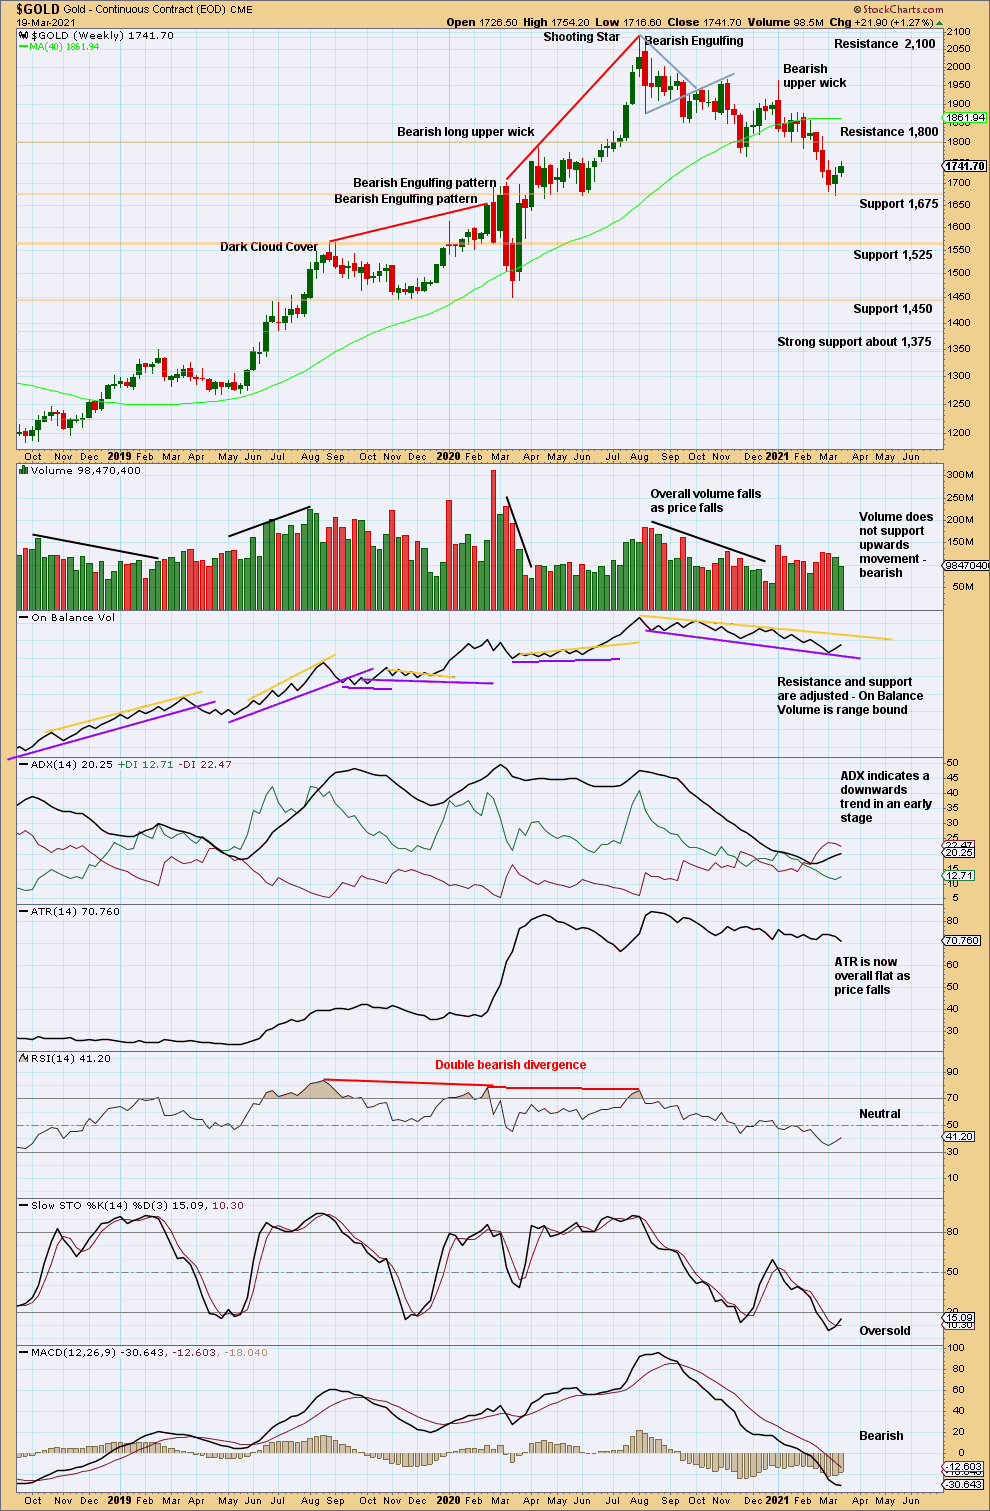
There is a series of lower swing lows and lower swing highs from the last all time high in August 2020. Downwards movement is now beginning to have a steeper slope. ADX now indicates a downwards trend at the weekly time frame, and price has made another important new swing low.
Neither ADX nor RSI are extreme. There is plenty of room for a downwards trend to continue.
A downwards trend should now be the dominant view until the trend reaches extreme and then a bullish candlestick reversal pattern is seen.
This chart supports the first Elliott wave count.
Within the prior upwards trend, the last major swing low is the week beginning June 1, 2020, at 1,671.70. So far price has not made a new low below this point. If price does make a new low below 1,671.70, then the view of a new downwards trend would be strengthened.
The last two green weekly candlesticks lack range and support from volume. So far this looks like a small counter trend movement.
DAILY CHART
Click chart to enlarge. Chart courtesy of StockCharts.com.
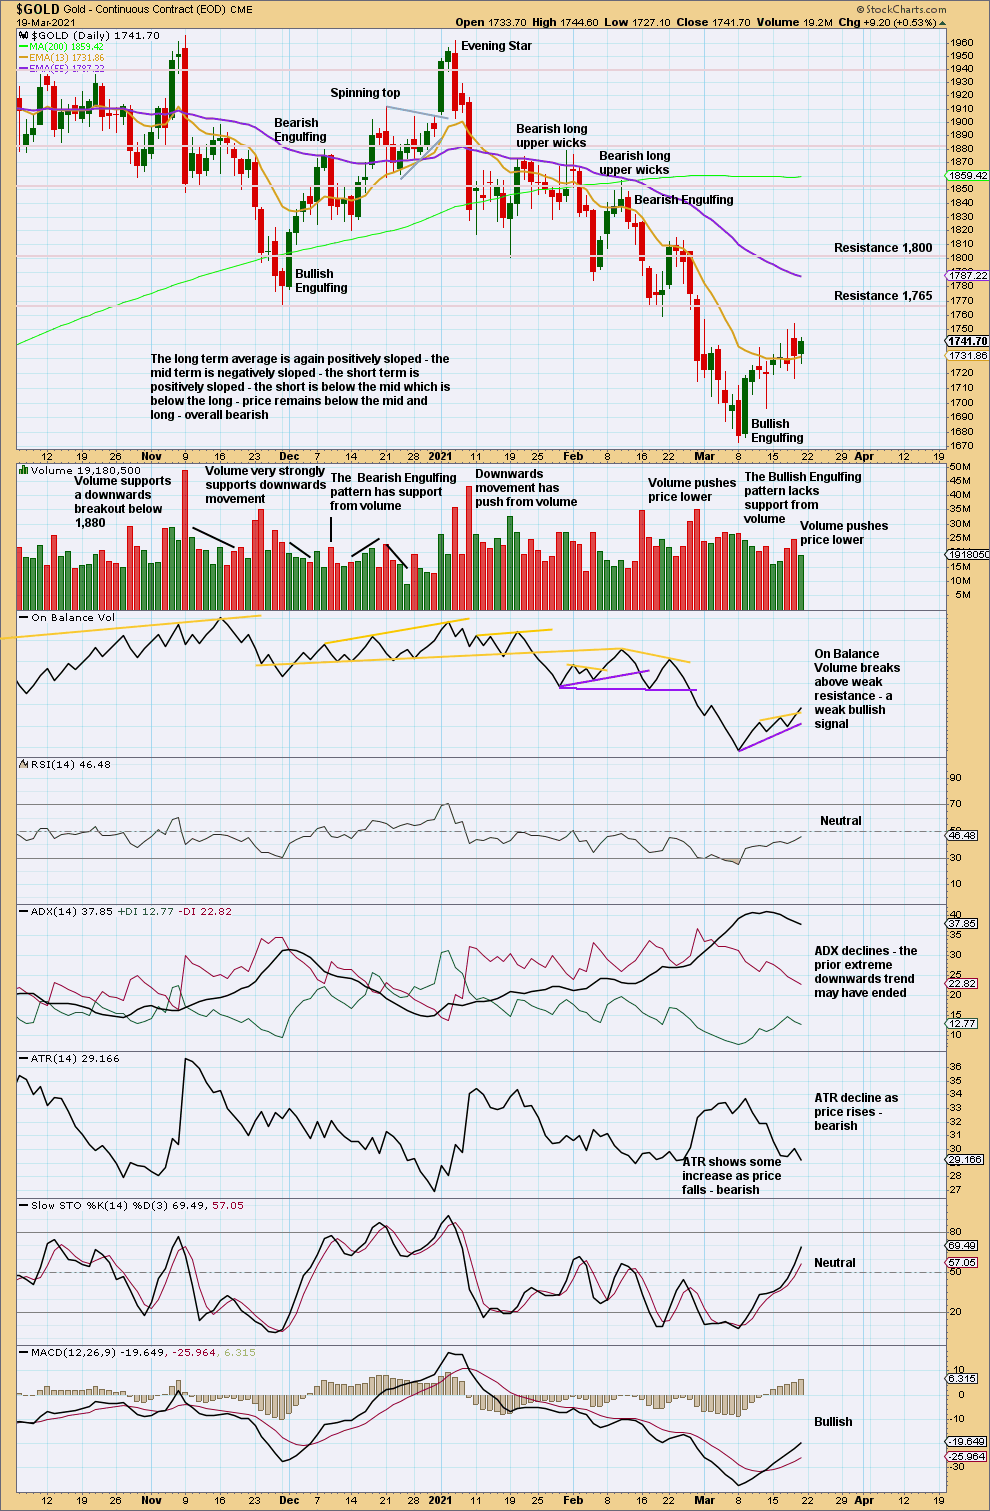
The Bullish Engulfing pattern on the 9th of March may not be an indicator of a strong reversal because it lacks support from volume. A bounce has now relieved some extreme conditions; RSI is no longer oversold, although ADX is still above both DX lines.
ADX may reach very extreme (over 45 and above both directional lines) before a trend in this market may end. It is currently declining, indicating no clear trend. But if it again increases, then it would again indicate an extreme downwards trend.
Apart from the 9th of March, upwards movement following that session is unconvincing.
The last session completes an inside day that has closed green. Upwards movement within this session lacks support from volume.
GDX WEEKLY CHART
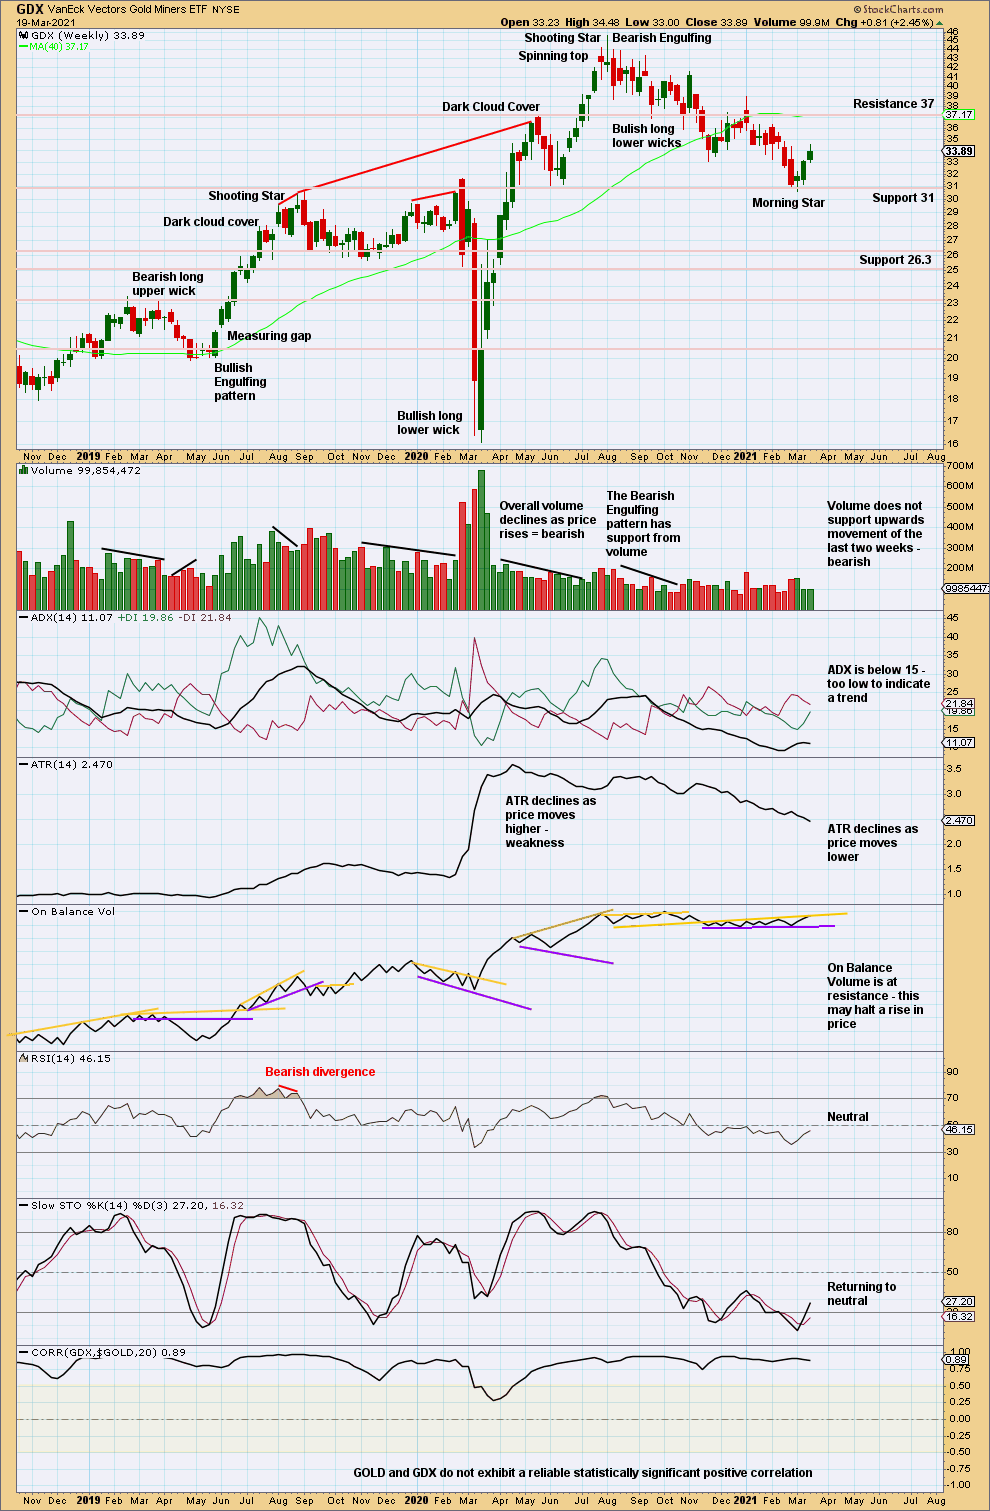
Click chart to enlarge. Chart courtesy of StockCharts.com.
For GDX the last major swing low within the prior upwards trend is the low at 31.06 in the week beginning June 1, 2020. Last week GDX has made a slight new low below this point. This is significant and supports the view that GDX may have had a trend change.
For confidence in a Morning Star reversal pattern the third candlestick should have support from volume. This one does not, so confidence may not be had in this pattern.
Another small range upwards week again lacks support from volume. This looks most likely to be another counter trend bounce.
GDX DAILY CHART
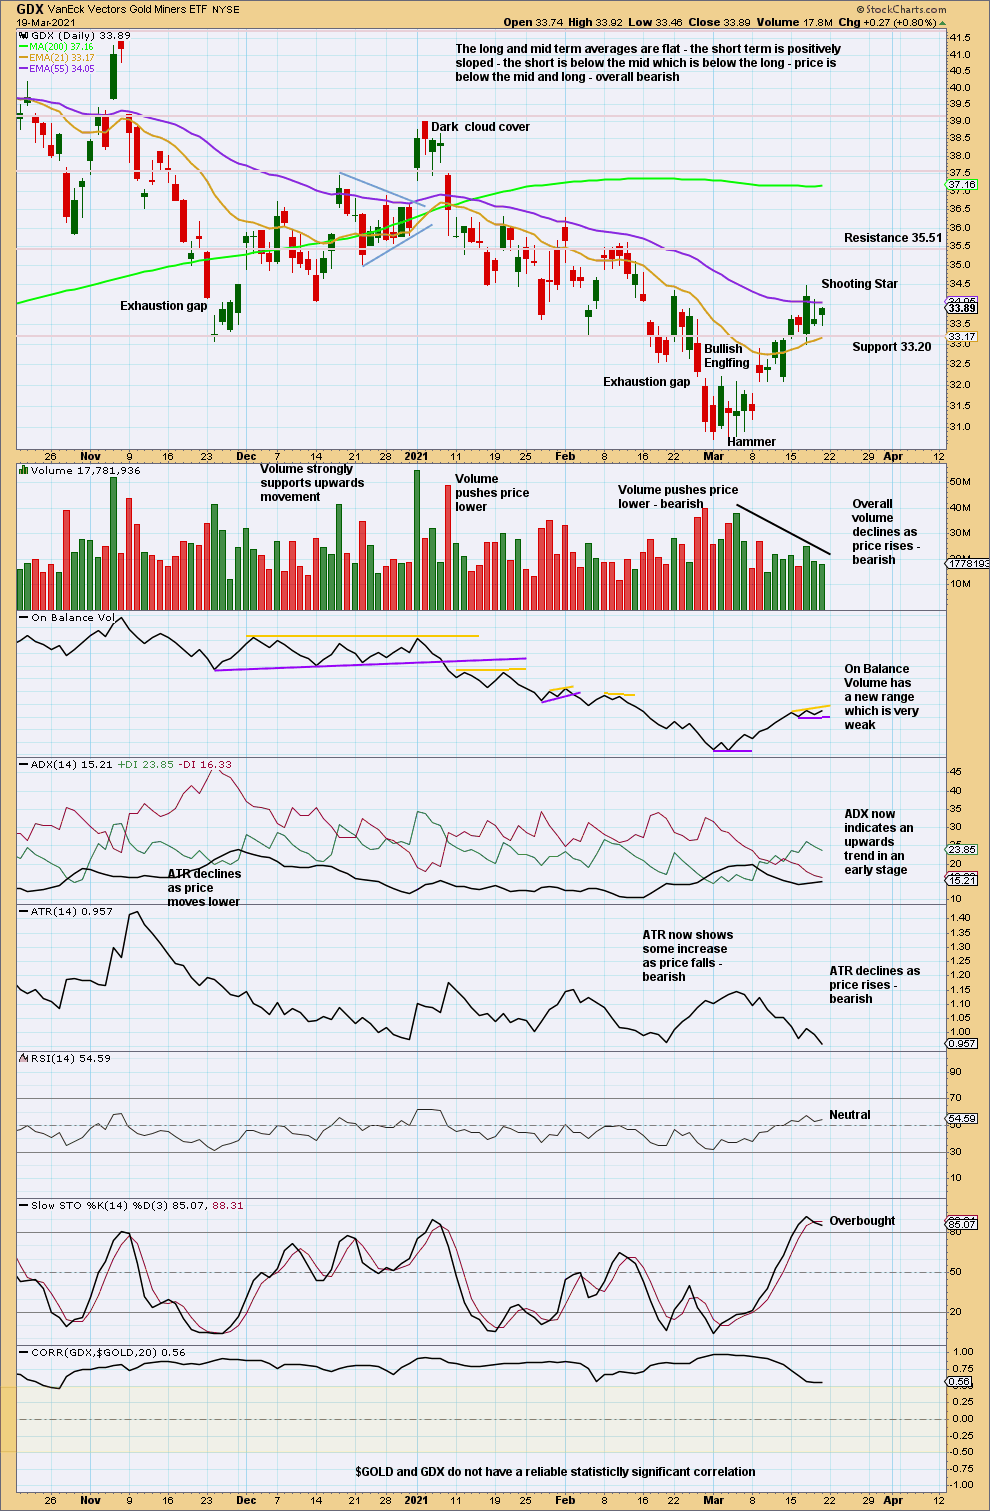
Click chart to enlarge. Chart courtesy of StockCharts.com.
The last swing high within the downwards trend at 34.35 has been slightly exceeded by a new high today at 34.38. This may be a significant event suggesting a trend change for GDX from down to up. If ADX reaches 15 and is rising, then some confidence in a new upwards trend may be had.
However, Thursday completes a Shooting Star. This is a bearish reversal pattern.
Friday’s small range inside day does not change this view.
Published @ 07:32 p.m. ET.
—
Careful risk management protects your trading account(s).
Follow my two Golden Rules:
1. Always trade with stops.
2. Risk only 1-5% of equity on any one trade.
—
New updates to this analysis are in bold.